 Zhao Hua
 Ding Xin
 Wang Xiaoting*
- Department of Critical Care Medicine, Peking Union Medical College Hospital, Peking Union Medical College, Chinese Academy of Medical Sciences, Beijing, China
Background: Optimal adjustment of cardiac preload is essential for improving left ventricle stroke volume (LVSV) and tissue perfusion. Changes in LVSV caused by central venous pressure (CVP) are the most important concerns in the treatment of critically ill patients.
Objectives: This study aimed to clarify the changes in LVSV after negative fluid balance in patients with elevated CVP, and to elucidate the relationship between the parameters of right ventricle (RV) filling state and LVSV changes.
Methods: This prospective cohort study included patients with high central venous pressure (CVP) (≥8 mmHg) within 24 h of ICU admission in the Critical Medicine Department of Peking Union Medical College Hospital. Patients were classified into two groups based on the LVSV changes after negative fluid balance. The cutoff value was 10%. The hemodynamic and echo parameters of the two groups were recorded at baseline and after negative fluid balance.
Results: A total of 71 patients included in this study. Forty in VI Group (LVOT VTI increased ≥10%) and 31 in VNI Group (LVOT VTI increased <10%). Of all patients, 56.3% showed increased LVSV after negative fluid balance. In terms of hemodynamic parameters at T0, patients in VI Group had a higher CVP (p < 0.001) and P(v-a)CO2 (p < 0.001) and lower ScVO2 (p < 0.001) relative to VNI Group, regarding the echo parameters at T0, the RVD/LVD ratio (p < 0.001), DIVC end−expiratory (p < 0.001), and ΔLVOT VTI (p < 0.001) were higher, while T0 LVOT VTI (p < 0.001) was lower, in VI Group patients. The multifactor logistic regression analysis suggested that a high CVP and RVD/LVD ratio ≥0.6 were significant associated with LVSV increase after negative fluid balance in critically patients. The AUC of CVP was 0.894. A CVP >10.5 mmHg provided a sensitivity of 87.5% and a specificity of 77.4%. The AUC of CVP combined with the RVD/LVD ratio ≥0.6 was 0.926, which provided a sensitivity of 92.6% and a specificity of 80.4%.
Conclusion: High CVP and RVD/LVD ratio ≥0.6 were significant associated with RV stressed in critically patients. Negative fluid balance will not always lead to a decrease, even an increase, in LVSV in these patients.
Introduction
In the management of hemodynamic instability, optimal adjustment of cardiac preload is essential for improving stroke volume (SV) and tissue perfusion. Fluid management in critical patients is crucial for prognosis, as both inadequate fluid or fluid overload can lead to negative outcomes (1). In particular, fluid overload and high CVP are associated with poor outcomes in critically ill patients (2). Some studies have concluded that elevated CVP is associated with increased mortality in critically ill patients (3). Conversely, early reductions in CVP during treatment may help maintain good organ function and result in a higher survival rate (4). Negative fluid balance is the most common clinical intervention to reduce CVP. Based on the Frank-Starling mechanism and venous return theory proposed by Guyton, venous return should match cardiac output (CO) as determined by the mean systemic filling pressure (MSFP) and the CVP gradient (5, 6). Changes in CO due to CVP are important concerns for the treatment of critically ill patients. The trend of changes between CVP and CO is not consistent in different conditions. Nevertheless, increases in CO with decreases in CVP occur in routine clinical work, which are indicative of improvement of heart function and pulmonary circulation, especially right heart function.
Right heart function is essential for venous return (7, 8). The healthy human RV fills at or below its unstressed volume, such that RV end-diastolic volume changes occur without any changes in RV diastolic wall stretch. With increased volume loading of the RV, right ventricular end-diastolic pressure (RVEDP) and LVSV both increased. When RV reaches the flat part of the pressure-volume curve, the RV further increases in size will lead a leftward ventricular septal (VS) shift (9). VS shift can result in decreased LVSV, leading to a phenomenon colloquially termed “falling off the Starling curve” (7).
According to the understanding of fluid responsiveness (FR), assessing the filling state of the RV is key to judging the volume status. However, evaluation of the filling state remains a challenge. Dynamic monitoring of CVP and assessment of RV size via echocardiography are currently used as indices of RV filling state (10–13). In our previous retrospective study, the patients with increased cardiac output (CO) and decreased CVP achieved negative fluid balance, but the effect of cardiotonic drugs couldn't be rule out (14). The changes of LVSV after negative fluid balance is still unknown in patients with high CVP. CVP has been used as a surrogate of right ventricle filling pressure, but CVP as a single measure is highly questionable: (1) It remains unclear what level of CVP is deleterious and may be considered a trigger for intervention; (2) The effect of varying intrathoracic pressure in mechanically ventilated patients, and might not reflect preload directly. Several studies have reported that fluid overload can increase RV size [the right to left ventricular end-diastolic dimensions (RVD/LVD) ratio is ≥0.6] (15–17). Furthermore, the relationship between hemodynamic parameters and LVSV changes after negative fluid balance is unclear. We therefore aimed to assess the changes of LVSV after negative fluid management and to elucidate the relationship between the parameters of right ventricle (RV) filling state and LVSV changes.
Materials and Methods
Study Design and Patient Enrollment
This is a post-hoc analysis of data collected during a prospective cohort study at the Critical Care Department of Peking Union Medical College Hospital. All patients with abnormally high CVP (i.e., outside the normal range of 0–7 mmHg) within 24 h of ICU admission from July 2017 to December 2017 were included in the study. All the patients authorized us to use their clinical data. The research protocol was reviewed and approved by Ethics Committee of Peking Union Medical College Hospital (PUMCH-S617).
Inclusion and Exclusion Criteria
The inclusion criteria were (1) CVP ≥8 mmHg and (2) age >18 years. The exclusion criteria were (1) negative balance therapy was not performed; (2) non-curative goals of therapy, (3) a history of cardiac disease, pulmonary hypertension, or precaval malformations, and (4) abdominal hypertension.
Study Protocol
All patients were treated as follows:
All enrolled patients underwent the routine procedures of the Critical Care Department of Peking Union Medical College Hospital. Arterial and venous lines were inserted. Time 0 (T0) is defined as the time of patient enrollment, and Time 1 (T1) is defined as a negative fluid balance of 500 ml. Central venous and arterial blood gases analysis were performed at T0 and T1. Patients were divided into two groups according to the LVOT VTI changes after negative fluid balance: VI Group comprised patients with ΔLVOT VTI(T1-T0)/T0 LVOT VTI ≥10% (VI) and VNI Group comprised patients with ΔLVOT VTI(T1-T0) /T0 LVOT VTI <10%(VNI).
• Hemodynamic monitoring methods: The lines of central venous and arterial were inserted, CVP, central venous oxygen saturation (ScVO2), central venous-arterial carbon dioxide difference [P(v-a)CO2], and serum lactate levels (lac) were tested (detailed were showed in Supplementary Material 1). Bladder pressure was used as a surrogate of intra-abdominal pressure (IAP), IAP ≥12 mmHg is defined as abdominal hypertension.
• Echocardiography: Echocardiography was also performed at T0 and T1 by competent attending physicians or fellows, who had at least 3 years of experience in echocardiography performance and interpretation. An ultrasound system equipped with an array probe (X-Porte, Sonosite, Bothell, WA, USA) was used. At least five standard views (acoustic windows) were obtained and recorded for each scan (Figure 1) (detailed were showed in Supplementary Material 1). All the reviews were confirmed by two competent attending physicians.
• Clinical treatment: The method of negative fluid balance (application of diuretic drugs or continuous renal replacement therapy) was determined by the physician. No changes were made that may cause changes in CVP. In the case of patient hypoxia, the inhaled oxygen concentration was adjusted to ensure SPO2 >95%, PaO2 >60 mmHg.
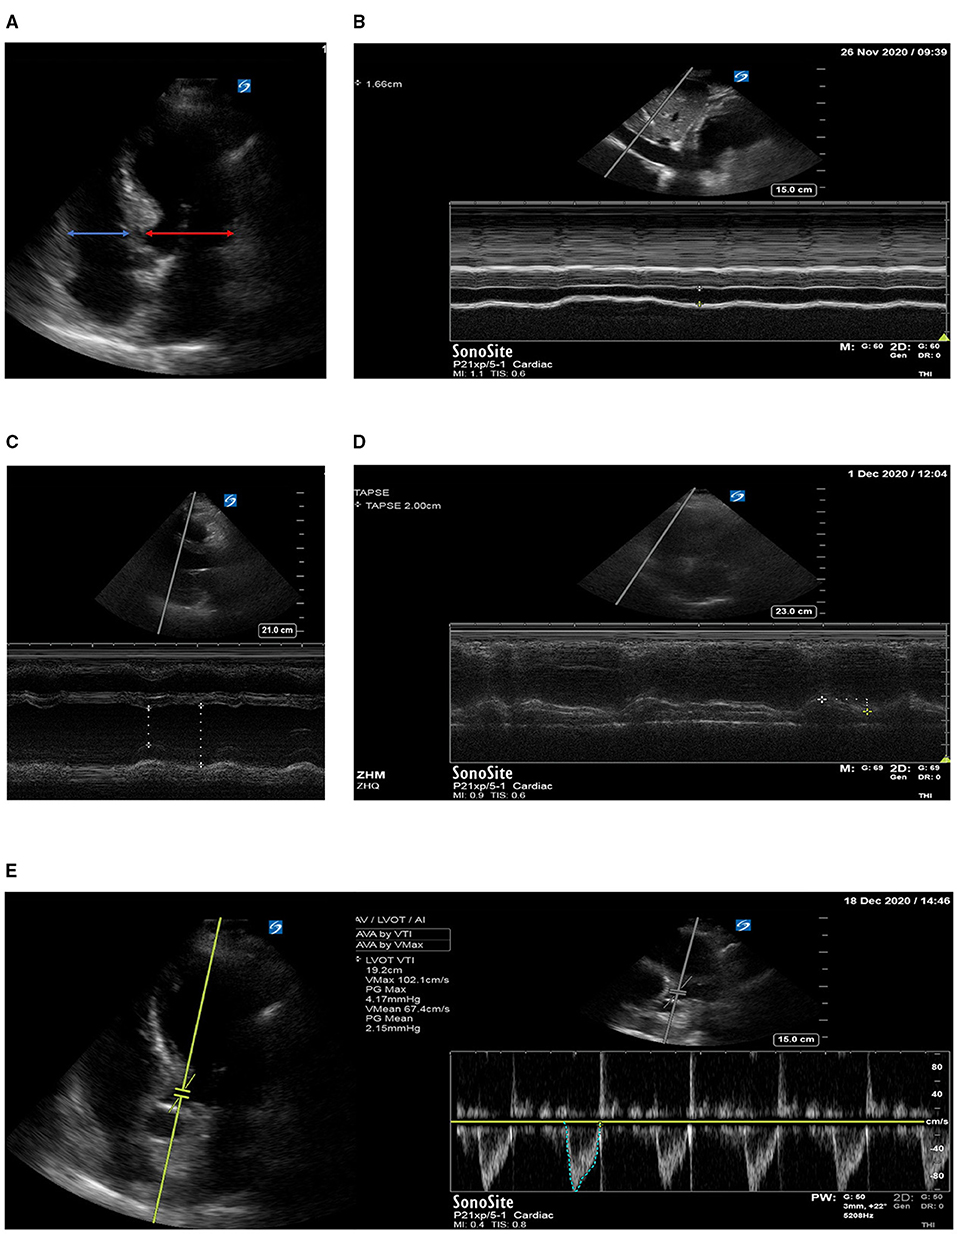
Figure 1. (A) Right to left ventricular diastolic dimensions ratio (RVD/LVD ratio); (B) diameter of the inferior vena cava; (C) left ventricular eject fraction EF; (D) tricuspid annular plane systolic excursion TPASE; (E) left ventricular outflow tract velocity time integral VTI.
Data Collection
Clinical data were extracted from the ICU computerized database and medical records, including patients' socio-demographic data, biometric parameters, comorbidities, respiratory support mode, and Acute Physiology and Chronic Health Evaluation II score, SOFA score. Hemodynamic parameters [heart rate, mean arterial blood pressure, CVP, ScVO2, P(v-a)CO2, and lac] and echo parameters [such as tricuspid annular plane systolic excursion (TAPSE), diameter of the inferior vena cava (DIVC end−expiratory), left ventricular eject fraction (LVEF), RVD/LVD ratio, left ventricle outflow tract velocity-time integral (LVOT VTI), mitral annular plane systolic excursion (MAPSE), mitral diastolic filling Eatly (Em), mitral diastolic filling Atrial (A m), and early diastolic velocity of the mitral annulus Ea m] were recorded at T0 and T1, were also recorded at the same time. The primary outcome of the study was to clarify LVOT VTI changes after negative fluid management in patients with high CVP. The secondary outcome was to evaluate the relationship between the relationship between the parameters of RV filling state and LVOT VTI changes after negative fluid management.
Statistical Analysis
Statistical analysis was performed using SPSS software version 20.0 for Windows (IBM, Armonk, NY). Considering this is a post-hoc analysis of data, sample size was calculated through events per variable (EPV) method. EPV of 5–10 is usually used to estimate sample size in the literature. At most 6 candidate variables could be included in the multivariate modeling process when half of patients will present positive result. The data distribution test and the homogeneity of variance test were performed on the data. Results for continuous variables with a normal distribution (e.g., age, Acute Physiology and Chronic Health Evaluation II score) are reported as the mean ± standard deviation. Student's t-test was used to compare means between two groups. Results for continuous variables that were not normally distributed are reported as the median (25th and 75th percentiles) and compared using non-parametric tests. Qualitative data were expressed as proportions; testing for differences was performed using a chi-square test or Fisher's exact test. The paired sample t-test was used for comparisons between groups before and after treatment. The correlation between RV variables and LVOT VTI changes was analyzed using Pearson correlation analysis. Risk factors associated with VI were identified in univariate and multivariate logistic regression analysis, variables with a P < 0.2 were subjected to a multivariate analysis with backward stepwise models to measure the odd risk (OR) and 95% confidence intervals (CIs). Receiver operating characteristic (ROC) curves were used to determine the ability of the indices to predict LVOT VTI increase >10% after negative fluid balance. The areas under the ROC curves (AUCs) were compared using DeLong's test. The AUC, sensitivity, and specificity are expressed as values with 95% CI. A p < 0.05 was considered to be statistically significant.
Results
Demographic and Clinical Characteristics of Patients
During the study period, a total of 154 patients were admitted with CVP ≥8 mmHg. Of these, 65 did not meet the study criteria (28 didn't undergo negative fluid management, 26 had underlying heart disease, 5 had abdominal hypertension, 6 with non-curative goals of therapy). In addition, 9 were excluded due to poor TT image quality or incomplete image acquisition; 6 were excluded due to inconsistent judgments of the ultrasound results by the two physicians; and 3 were excluded due to new tachyarrhythmia during the trial. Thus, the final sample for analysis comprised 71 patients (33 males, 38 females) (Figure 2). Overall, 40 (56.3%) patients were grouped to VI Group, 31 (43.7%) patients were grouped to VNI Group. The demographical and clinical characteristics of all patients are shown in Table 1. Except for the P/F ratio (p < 0.05), there were no significant differences in other demographic characteristics between the two groups. In terms of hemodynamic parameters at T0, patients in VI Group had a higher CVP and P(v-a) CO2 and lower ScVO2 relative to VNI Group (all p < 0.05). No group differences were observed for HR, MAP, or lactate levels. Regarding the echo parameters at T0, the RVD/LVD ratio ≥0.6, DIVC end−expiratory, ΔLVOT VTI were higher, while T0 LVOT VTI was lower, in VI Group (all p < 0.05). There were no group differences in LV systolic and diastolic function, RV systolic fuction, and tricuspid regurgitation as shown in Table 2.
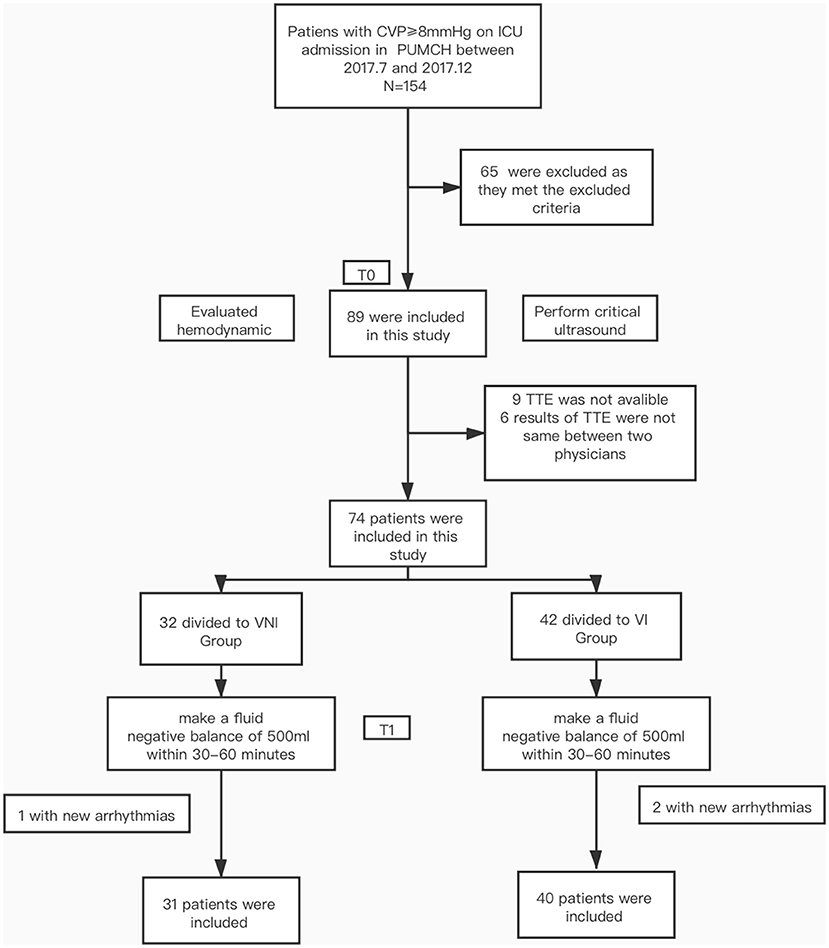
Figure 2. Flow chart.
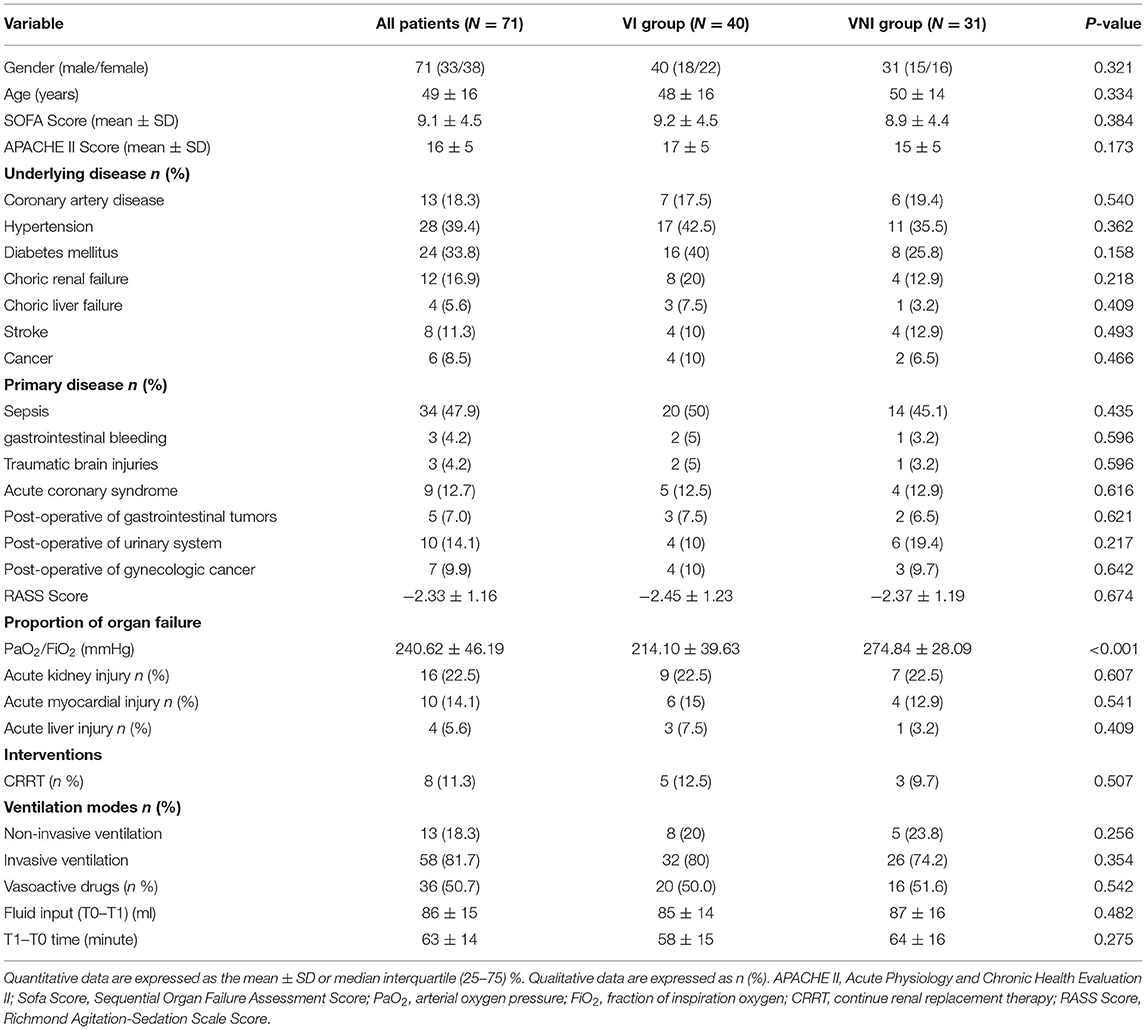
Table 1. The demographic and clinical characteristics of the patients included in this study at T0.
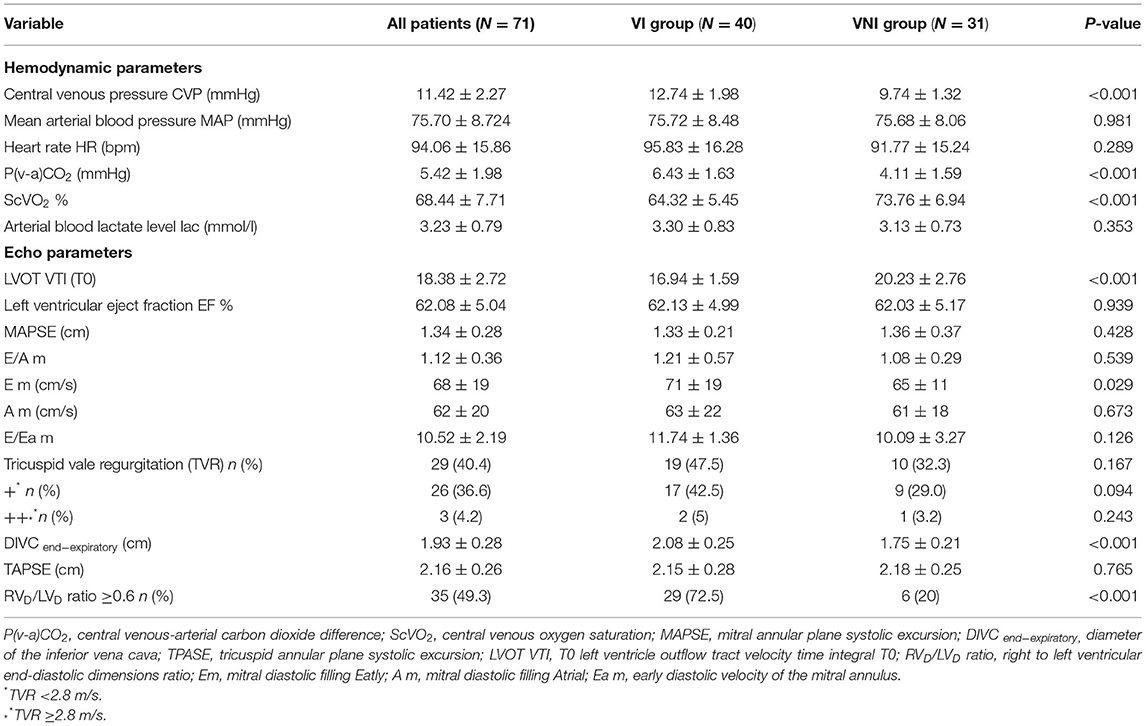
Table 2. The hemodynamic and echo characteristics of all the included patients at T0.
Comparison of Hemodynamic Parameters at T0 and T1 Between Patients With Rv Dilation or Not
The analysis showed there was a significant difference in proportion of RVD/LVD ratio ≥0.6 (RV dilation) between the two groups. We compared the hemodynamic parameters at T0 and T1 between patients with RVD/LVD ratio ≥0.6 (RV dilation) or not (non-RV dilation).
As shown in Figure 3, CVP, DIVC end−expiratory, and RVD/LVD ratio decreased significantly in both groups after negative fluid management (p < 0.05). None of the patients in our study experienced tissue perfusion insufficiency. Flow related parameters [LVOT VTI, P(v-a)CO2, ScVO2] improved in patients with RVD/LVD ratio ≥0.6 (p < 0.05), and the lactate level decreased in patients with RVD/LVD ratio <0.6 (p < 0.05). In addition, the P/F ratio increased significantly in both groups (p < 0.05).
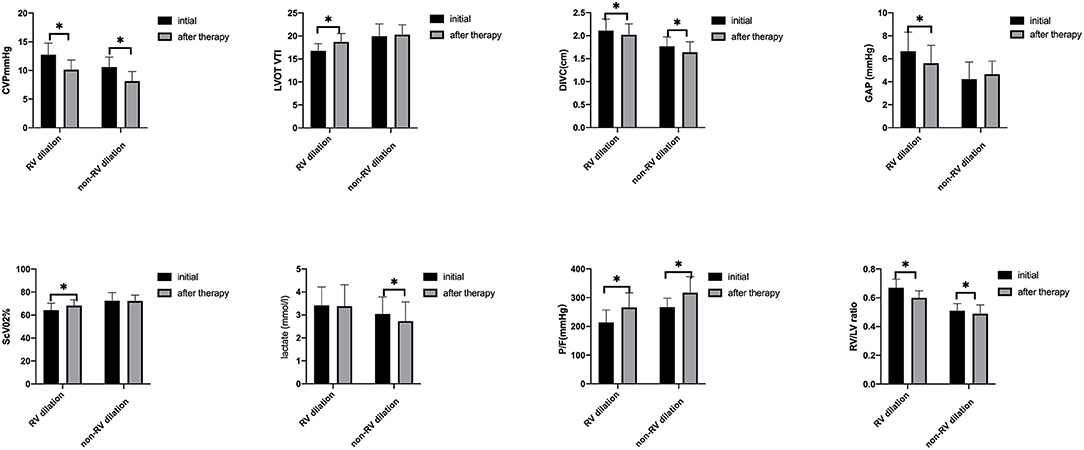
Figure 3. Hemodynamic parameters between T0 and T1 in the two groups, *indicates a p < 0.05 between the two groups. CVP, central venous pressure; LVOT VTI, left ventricular outflow tract velocity time integral; DIVC end−expiratory, diameter of the inferior vena cava; P(V-A)CO2, central venous-arterial carbon dioxide difference; ScVO2, central venous oxygen saturation; P/F, arterial partial pressure of oxygen to fractional concentration of inspired oxygen; RVD/LVD ratio, right to left ventricular diastolic dimensions ratio.
Correlation Between RV Parameters and Δ LVOT VTI/T0 LVOT VTI
Figure 4 presents the individual parameter values for RV and Δ LVOT VTI/T0 LVOT VTI among all patients. CVP, RVD/LVD ratio, and DIVC end−expiratory were significantly correlated with Δ LVOT VTI/T0 LVOT VTI [r = 0.64 (p < 0.05), 0.64 (p < 0.053), and 0.59 (p < 0.05), respectively]. By contrast, no relationship was observed between LV systolic and diastolic functions, RV systolic function and tricuspid regurgitation and Δ LVOT VTI/T0 LVOT VTI.
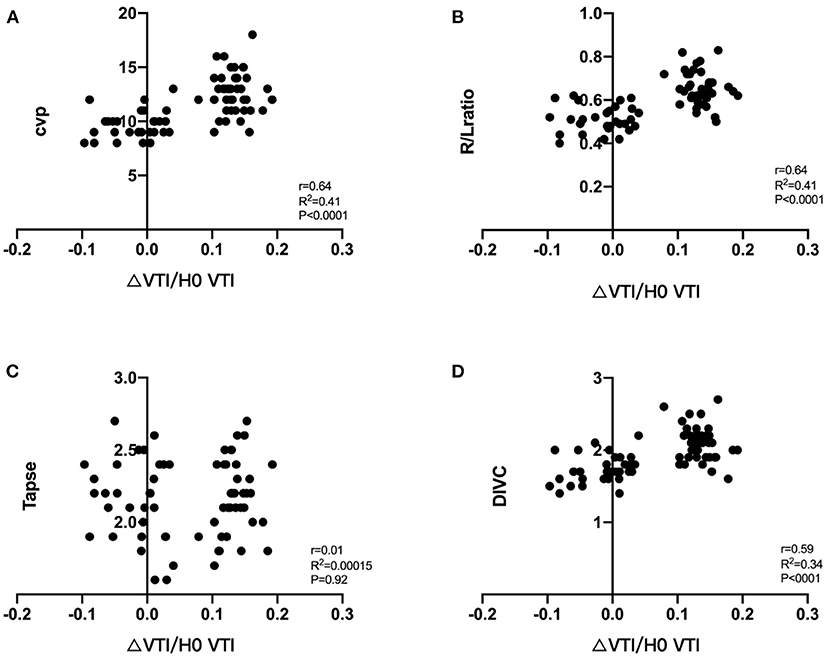
Figure 4. Correlation between ΔLVOT VTI/T0 LVOT VTI and RV parameters, ΔLVOT VTI/T0LVOT VTI = T1LVOT VTI-T0 LVOT VTI/T0LVOT VTI, its relationship with CVP (A), RVD/LVD ratio (B), TAPSE (C), DIVC end−expiratory (D). VTI, velocity time integral; CVP, central venous pressure; TPASE, tricuspid annular plane systolic excursion; RVD/LVD ratio, right to left ventricular diastolic dimensions ratio; DIVC end−expiratory, diameter of the inferior vena cava.
Risk Factors for a LVOT VTI Increase ≥10% at T1
The multifactor logistic regression analysis was used to examine possible risk factors for the changes of LVOT VTI after negative fluid management. All relevant variables were taken into account (including demographics and clinical characteristics, hemodynamic and ECHO findings). P(v-a) CO2 and ScVO2 were excluded, as they are derived variables of LVOT VTI, P/F was exclude as it was consequence variables of RV stressed. The results of univariate analysis suggested that the P-value of CVP, RVD/LVD ratio, LVOT VTI, DIVC end−expiratory and E m was <0.2 (Table 3). Then these variables were subjected to the multivariate logistic regression analysis with backward stepwise model. The results suggested that a high CVP and RVD/LVD ratio were significant associated with LVSV increase after negative fluid balance in critically patients (p < 0.05). The OR of CVP and RVD/LVD ratio were 2.425 (95% CI, 1.458–4.003) and 8.588 (95% CI, 1.947–37.887), respectively (Table 3).
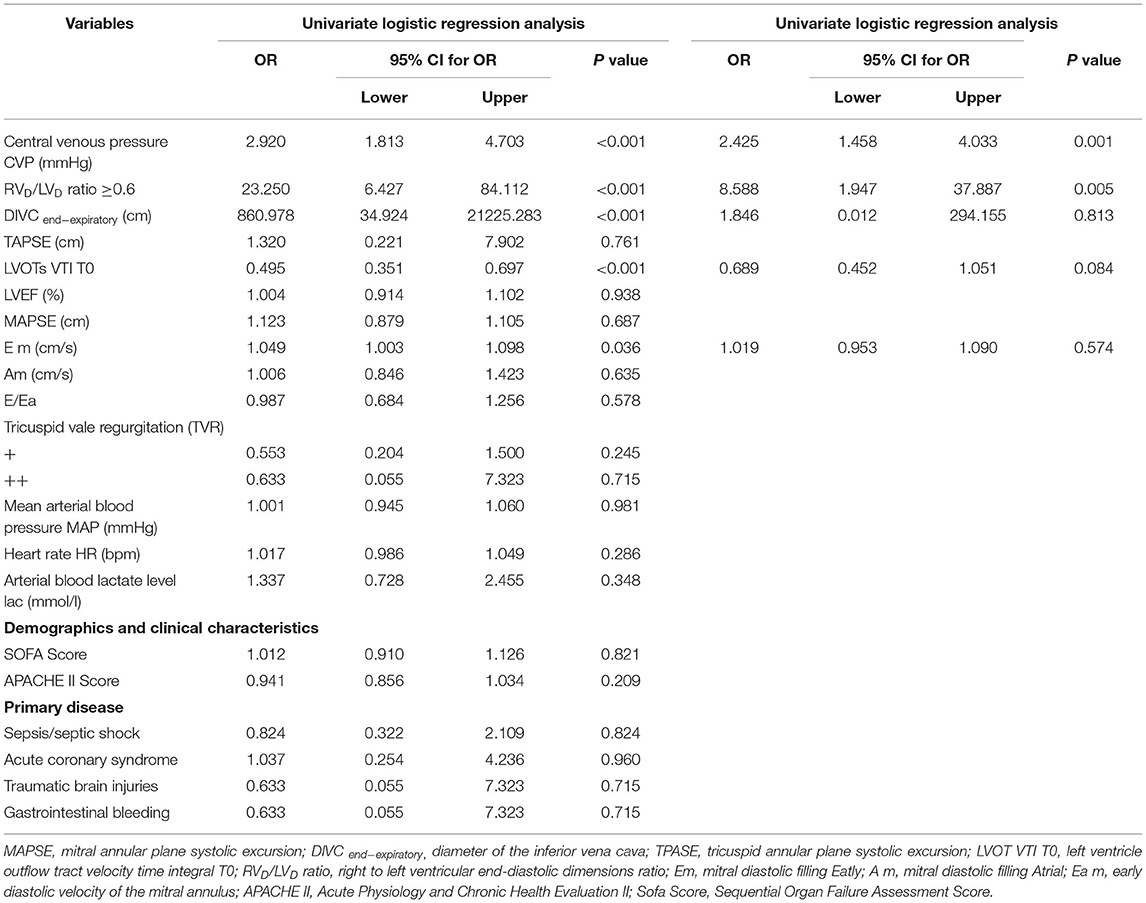
Table 3. Logistic regression analysis for possible risk factors of LVOT VTI increased ≥10% after negative fluid balance.
Effect of Risk Parameters for Predicting a LVOT VTI Increase >10% at T1
The AUC of CVP for predicting a LVOT VTI increase >10% at T1 was 0.883 (95% CI 0.804–0.902). The best diagnostic threshold was 10.5 mmHg, which provided a sensitivity of 87.5% and a specificity of 77.4% (Figure 5).
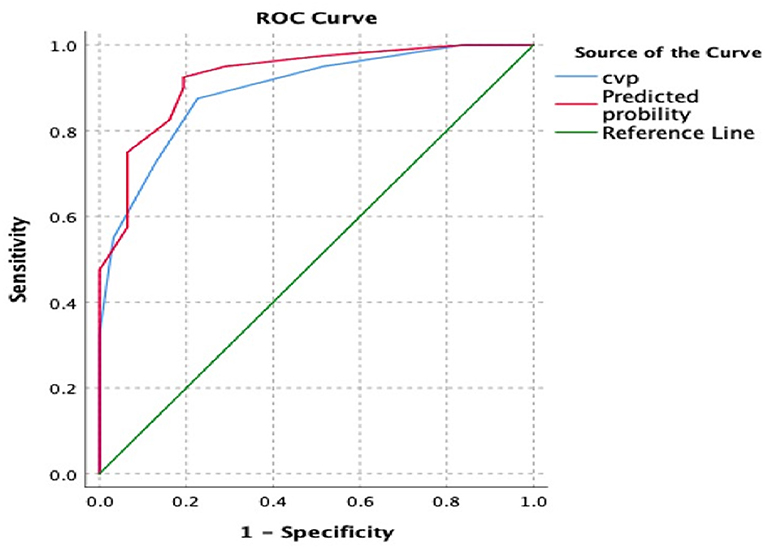
Figure 5. The receiver operating characteristic (ROC) curves and the area under the ROC curve (AUC) for prediction of VTI increase after negative fluid balance. The “red model” included CVP and RVD/LVD ratio, while the “blue model” only included CVP. The AUC was 0.926 and 0.894, respectively. VTI, velocity time integral; CVP, central venous pressure; RVD/LVD ratio, right to left ventricular diastolic dimensions ratio.
The regression equation for all of the risk parameters is:
Logit (P) = −10.474 + CVP * 0.886 + RVD/LVD ratio * 2.854 (≥0.6 = 1, <0.6 = 0).
The AUC of CVP combined with RVD/LVD ratio for predicting a LVOT VTI increase >10% at T1 was 0.926 (95% CI 0.866–0.96). The best diagnostic threshold was 0.3689, which provided a sensitivity of 92.5% and a specificity of 80.6% (Figure 5).
Discussion
The main findings of our study are as follows: (1) Negative fluid balance will not always lead to a decrease, even an increase, in patients with high CVP, especially combined with RVD/LVD ratio ≥0.6. (2) The underling mechanism may be related to the filling state of RV. Our results suggested high CVP and RVD/LVD ratio (≥0.6) were significantly associated with RV stressed, CVP ≥10.5 combined with RVD/LVD ratio ≥0.6 can predict higher LVSV derived from negative fluid balance. (3) We found that the patients with high CVP can benefit from oxygenation index improvement through dehydration treatment, CVP can be used as a clinical safety mechanism to avoid fluid overload.
In our study, the intervention was performed in a short period of time (63 ± 14 min), while other factors affecting CVP were unchanged. Notably, 56.3% of our patients showed increased VTI after negative fluid balance, 43.7% showed decreased or unchanged VTI, which is not exactly the same as the comment cognition. As the Starling curve does not have descending branches, it cannot explain the increase in LVSV after negative fluid management. Thus, we assume that patients experienced RV stressed. A negative fluid balance can reduce RV volume, resulting in a rightward VS shift, an increase in left ventricular end-diastolic volume, and an increase in LVSV.
In terms of the hemodynamic and echo parameters in our cohort, CVP, P(v-a)CO2, ScVO2, RVD/LVD ratio, LVOT VTI, and DIVC end−expiratory differed significantly between the two groups at T0. A high CVP value and RVD/LVD ratio ≥0.6 were significantly associated with RV stressed. Antoine Vieillard-Baron also found RV failure was frequent (42% of cases) when defined by the association of RV dilatation (RV/LV EDA ≥0.6) with systemic congestion (CVP ≥8 mmHg) in septic shock patients, and only 20–30% patients responded to fluid (18, 19). Due to its geometrical complexity, assessment of RV volume is a very difficult task. Although quantitative validation is lacking, RVD/LVD ratio has prognostic value in multiple patient populations, including acute pulmonary embolism, idiopathic pulmonary arterial hypertension, and post-left ventricular assist device implantation, the correlation of RV linear dimensions with RV end-diastolic volumes appears to worsen with increased preload (20–22). RVD/LVD ratio has been shown to be an indicator of RV size, and can thus provide reliable information about RV shape and size. A ratio ≥0.6, regardless of whether RV is within the normal reference limits, may relate to certain conditions such as RV stressed (20). Our results are similar to those of previous studies (23). Our measurement method is more clinically operable and repeatable. However, in patients with pulmonary embolism and chronic pulmonary hypertension, only RVEDA/LVEDA >1 indicates RV stressed (24, 25). When R/V ratio is applied clinically, it should be considered in combination with the patient's underlying disease and ventricular septal morphology. We also identified high CVP was significantly associated with RV stressed. The gold standard for evaluating RV filling pressure is invasive monitoring using a centrally placed venous catheter (26). Since the filling pressure and LVSV of the RV do not have a linear relationship, it has recently been acknowledged that CVP is ineffective for evaluating a patient's fluid responsiveness (27–29). While the absolute value of CVP alone cannot predict fluid responsiveness, it is necessary to understand that CVP is a marker of pressure and a regulating factor of venous return. Thus, an increase in CVP can be used as a clinical safety mechanism to avoid fluid overload and high RV filling pressure (30). In the present study, we found that a high CVP may reflect that the RV volume load has exceeded the normal range; failure to appreciate this limit may result in a VS rightward shift and reduced LVSV. It has been proposed that, once CVP has exceeded 10–14 mm Hg in non-intubated patients with acute RV myocardial infarction, further volume loading is detrimental. A mean CVP >14 mmHg is almost always associated with a reduced RVSWI (31, 32). Garcia-Montilla et al. (33) reported that the optimal RV filling pressure in patients with acute respiratory distress syndrome (ARDS) is 13 ± 2 mm Hg. Furthermore, they demonstrated that once CVP reaches 15 mmHg, further increments in filling pressure did not increase RVSPG; rather, due to overstretching of myocardial fibers, RVSPG decreased. These values may be considered the optimal RV filling pressure in patients with acute RV infarction or ARDS. Our results suggest that CVP >10.5 mmHg can predict whether VTI increases after a negative fluid balance in patients without underlying cardiac disease with high sensitivity but low specificity, when combined with RVD/LVD ratio ≥0.6 the predictive ability improved.
Notably, none of our patients experienced tissue perfusion insufficiency after negative fluid balance. However, the oxygenation index improved in both groups—especially VI Group. It is well-known that fluid overload may lead to pulmonary edema and failure of weaning from mechanical ventilation. A milestone study by National Heart, Lung, and Blood Institute Acute Respiratory Distress Syndrome (ARDS) Clinical Trials Network et al. (34) showed that a conservative fluid management protocol aimed to lower CVP resulted in a major reduction in net fluid balance, improving lung function and shortening the duration of mechanical ventilation. Clinicians should be alert to high CVP as it may indicate increased RV tension and leftward VS, potentially leading to increased left ventricular filling pressure and pulmonary edema. Accurate fluid therapy for patients with high CVP (systemic congestion) will not lead to hypoperfusion, but will be beneficial for other organs.
This study has some limitations. First, it was a single- center, prospective cohort study. In addition, the sample size is limited, and may have thus systematically excluded some participant groups. As a pragmatic study, this population had similar characteristics to previous clinical audits using the same inclusion criteria. Although RVD/LVD ratio entered to the equation and the P < 0.05, but the range of 95% CI for OR was widely. A study with larger sample size is needed to confirm our findings. Secondly, although we excluded patients with any pre-existing heart disease based on clinical records or echocardiography, some patients might have developed subclinical heart disease after their last echocardiography. Thirdly, the determination of RV volume load may be imperfect, more accurate RV volume measurement should be performed in the future study. Fourthly, as all the participants were enrolled within 24 h of entering the ICU, the treatments prior to inclusion were implemented in other departments, the detailed information could not be obtained accurately, we will pay more attention to the collection of relevant information in future studies.
Conclusion
In general, this study challenges traditional fluid resuscitation, which is frequently used in everyday practice. We found negative fluid balance will not always lead to a decrease, even an increase, in LVSV in patients with high CVP (≥8 mmHg) especially combined with RVD/LVD ratio ≥0.6. The underling mechanism may be related to the filling state of RV. High CVP value and RVD/LVD ratio ≥0.6 were significantly associated with RV stressed. Further studies of whether precise fluid management can improve patients' 28-day mortality, shorten ICU stay, or shorten the duration of mechanical ventilation are required.
Data Availability Statement
The raw data supporting the conclusions of this article will be made available by the authors, without undue reservation.
Ethics Statement
The research protocol was reviewed and approved by Ethics Committee of Peking Union Medical College Hospital (PUMCH-S617). The patients/participants provided their written informed consent to participate in this study.
Author Contributions
LD and WX: conception and design, review, and revision of the manuscript. DX and ZH: data extraction. ZH: statistical analysis, interpretation of data, and writing. All authors contributed to the article and approved the submitted version.
Funding
This work was supported by capital clinic research and demonstration application of diagnosis and treatment project (No. Z201100005520038).
Conflict of Interest
The authors declare that the research was conducted in the absence of any commercial or financial relationships that could be construed as a potential conflict of interest.
Publisher's Note
All claims expressed in this article are solely those of the authors and do not necessarily represent those of their affiliated organizations, or those of the publisher, the editors and the reviewers. Any product that may be evaluated in this article, or claim that may be made by its manufacturer, is not guaranteed or endorsed by the publisher.
Supplementary Material
The Supplementary Material for this article can be found online at: https://www.frontiersin.org/articles/10.3389/fmed.2021.715099/full#supplementary-material
References
1. Rivers E, Nguyen B, Havstad S, Ressler J, Muzzin A, Knoblich B, et al. Early goal-directed therapy in the treatment of severe sepsis and septic shock. N Engl J Med. (2001) 345:1368–77. doi: 10.1056/NEJMoa010307
2. Boyd JH, Forbes J, Nakada TA, Walley KR, Russell JA. Fluid resuscitation in septic shock: a positive fluid balance and elevated central venous pressure are associated with increased mortality. Crit Care Med. (2011) 39:259–65. doi: 10.1097/CCM.0b013e3181feeb15
3. Acheampong A, Vincent JL. A positive fluid balance is an independent prognostic factor in patients with sepsis. Crit Care. (2015) 19:251. doi: 10.1186/s13054-015-0970-1
4. Wang XT, Yao B, Liu DW, Zhang HM. Central venous pressure dropped early is associated with organ function and prognosis in septic shock patients: a retrospective observational study. Shock. (2015) 44:426–30. doi: 10.1097/SHK.0000000000000445
5. Berlin DA, Bakker J. Starling curves and central venous pressure. Crit Care. (2015) 19:55. doi: 10.1186/s13054-015-0776-1
6. Magder S. Bench-to-bedside review: an approach to hemodynamic monitoring–Guyton at the bedside. Crit Care. (2012) 16:236. doi: 10.1186/cc11395
7. Pinsky MR. The right ventricle: interaction with the pulmonary circulation. Crit Care. (2016) 20:266. doi: 10.1186/s13054-016-1524-x
8. Takata M, Harasawa Y, Beloucif S, Robotham JL. Coupled vs. uncoupled pericardial constraint: effects on cardiac chamber interactions. J Appl Physiol. (1985) (1997) 83:1799–813. doi: 10.1152/jappl.1997.83.6.1799
9. Funk DJ, Jacobsohn E, Kumar A. The role of venous return in critical illness and shock-part I: physiology. Crit Care Med. (2013) 41:255–62. doi: 10.1097/CCM.0b013e3182772ab6
10. Martyn JA, Snider MT, Farago LF, Burke JF. Thermodilution right ventricular volume: a novel and better predictor of volume replacement in acute thermal injury. J Trauma. (1981) 21:619–26. doi: 10.1097/00005373-198108000-00005
11. Krishnan S, Schmidt GA. Acute right ventricular dysfunction: real-time management with echocardiography. Chest. (2015) 147:835–46. doi: 10.1378/chest.14-1335
12. Puchalski MD, Williams RV, Askovich B, Minich LL, Mart C, Tani LY. Assessment of right ventricular size and function: echo versus magnetic resonance imaging. Congenit Heart Dis. (2007) 2:27–31. doi: 10.1111/j.1747-0803.2007.00068.x
13. Dandel M, Hetzer R. Evaluation of the right ventricle by echocardiography: particularities and major challenges. Expert Rev Cardiovasc Ther. (2018) 16:259–75. doi: 10.1080/14779072.2018.1449646
14. Su L, Pan P, Li D, Zhang Q, Zhou X, Long Y, et al. Central venous pressure (CVP) reduction associated with higher cardiac output (CO) favors good prognosis of circulatory shock: a single-center, retrospective cohort study. Front Med. (2019) 6:216. doi: 10.3389/fmed.2019.00216
15. Atherton JJ, Moore TD, Lele SS, Thomson HL, Galbraith AJ, Belenkie I, et al. Diastolic ventricular interaction in chronic heart failure. Lancet. (1997) 349:1720–4. doi: 10.1016/S0140-6736(96)05109-4
16. Tyberg JV, Taichman GC, Smith ER, Douglas NW, Smiseth OA, Keon WJ. The relationship between pericardial pressure and right atrial pressure: an intraoperative study. Circulation. (1986) 73:428–32. doi: 10.1161/01.CIR.73.3.428
17. Rudski LG, Lai WW, Afilalo J, Hua L, Handschumacher MD, Chandrasekaran K, et al. Guidelines for the echocardiographic assessment of the right heart in adults: a report from the American Society of Echocardiography endorsed by the European Association of Echocardiography, a registered branch of the European Society of Cardiology, and the Canadian Society of Echocardiography. J Am Soc Echocardiogr. (2010) 23:685–713; quiz: 786–8. doi: 10.1016/j.echo.2010.05.010
18. Abou-Arab O, Moussa MD, Beyls C, Mahjoub Y. Comments on “right ventricular failure in septic shock: characterization, incidence and impact on fluid responsiveness”: which parameter to assess right ventricular failure and venous congestion? Crit Care. (2021) 25:136. doi: 10.1186/s13054-021-03473-0
19. Vieillard-Baron A, Prigent A, Repesse X, Goudelin M, Prat G, Evrard B, et al. Right ventricular failure in septic shock: characterization, incidence and impact on fluid responsiveness. Crit Care. (2020) 24:630. doi: 10.1186/s13054-020-03345-z
20. Lai WW, Gauvreau K, Rivera ES, Saleeb S, Powell AJ, Geva T. Accuracy of guideline recommendations for two-dimensional quantification of the right ventricle by echocardiography. Int J Cardiovasc Imaging. (2008) 24:691–8. doi: 10.1007/s10554-008-9314-4
21. Haddad F, Hunt SA, Rosenthal DN, Murphy DJ. Right ventricular function in cardiovascular disease, part I: anatomy, physiology, aging, and functional assessment of the right ventricle. Circulation. (2008) 117:1436–48. doi: 10.1161/CIRCULATIONAHA.107.653576
22. Meyer G, Vieillard-Baron A, Planquette B. Recent advances in the management of pulmonary embolism: focus on the critically ill patients. Ann Intensive Care. (2016) 6:19. doi: 10.1186/s13613-016-0122-z
23. Wiesenack C, Fiegl C, Keyser A, Laule S, Prasser C, Keyl C. Continuously assessed right ventricular end-diastolic volume as a marker of cardiac preload and fluid responsiveness in mechanically ventilated cardiac surgical patients. Crit Care. (2005) 9:R226–33. doi: 10.1186/cc3503
24. Mercat A, Diehl JL, Meyer G, Teboul JL, Sors H. Hemodynamic effects of fluid loading in acute massive pulmonary embolism. Crit Care Med. (1999) 27:540–4. doi: 10.1097/00003246-199903000-00032
25. Fremont B, Pacouret G, Jacobi D, Puglisi R, Charbonnier B, de Labriolle A. Prognostic value of echocardiographic right/left ventricular end-diastolic diameter ratio in patients with acute pulmonary embolism: results from a monocenter registry of 1,416 patients. Chest. (2008) 133:358–62. doi: 10.1378/chest.07-1231
26. Beigel R, Cercek B, Luo H, Siegel RJ. Noninvasive evaluation of right atrial pressure. J Am Soc Echocardiogr. (2013) 26:1033–42. doi: 10.1016/j.echo.2013.06.004
27. Eskesen TG, Wetterslev M, Perner A. Systematic review including re-analyses of 1148 individual data sets of central venous pressure as a predictor of fluid responsiveness. Intensive Care Med. (2016) 42:324–32. doi: 10.1007/s00134-015-4168-4
28. Cecconi M, Hofer C, Teboul JL, Pettila V, Wilkman E, Molnar Z, et al. Fluid challenges in intensive care: the FENICE study: a global inception cohort study. Intensive Care Med. (2015) 41:1529–37. doi: 10.1007/s00134-015-3850-x
29. Osman D, Ridel C, Ray P, Monnet X, Anguel N, Richard C, et al. Cardiac filling pressures are not appropriate to predict hemodynamic response to volume challenge. Crit Care Med. (2007) 35:64–8. doi: 10.1097/01.CCM.0000249851.94101.4F
30. Sondergaard S, Parkin G, Aneman A. Central venous pressure: we need to bring clinical use into physiological context. Acta Anaesthesiol Scand. (2015) 59:552–60. doi: 10.1111/aas.12490
31. Greyson CR. Pathophysiology of right ventricular failure. Crit Care Med. (2008) 36:S57–65. doi: 10.1097/01.CCM.0000296265.52518.70
32. Berisha S, Kastrati A, Goda A, Popa Y. Optimal value of filling pressure in the right side of the heart in acute right ventricular infarction. Br Heart J. (1990) 63:98–102. doi: 10.1136/hrt.63.2.98
33. Garcia-Montilla R, Imam F, Miao M, Stinson K, Khan A, Heitner S. Optimal right heart filling pressure in acute respiratory distress syndrome determined by strain echocardiography. Echocardiography. (2017) 34:851–61. doi: 10.1111/echo.13546
Keywords: central venous pressure, fluid management, echocardiography, right ventricle size, right ventricle filling
Citation: Hua Z, Xin D, Xiaoting W and Dawei L (2021) High Central Venous Pressure and Right Ventricle Size Are Related to Non-decreased Left Ventricle Stroke Volume After Negative Fluid Balance in Critically Ill Patients: A Single Prospective Observational Study. Front. Med. 8:715099. doi: 10.3389/fmed.2021.715099
Received: 26 May 2021; Accepted: 29 July 2021;
Published: 31 August 2021.
Edited by:
Zhanqi Zhao, Furtwangen University, GermanyReviewed by:
Yi Yang, Southeast University, ChinaJiapeng Huang, University of Louisville, United States
Copyright © 2021 Hua, Xin, Xiaoting and Dawei. This is an open-access article distributed under the terms of the Creative Commons Attribution License (CC BY). The use, distribution or reproduction in other forums is permitted, provided the original author(s) and the copyright owner(s) are credited and that the original publication in this journal is cited, in accordance with accepted academic practice. No use, distribution or reproduction is permitted which does not comply with these terms.
*Correspondence: Wang Xiaoting, d2FuZ3hpYW90aW5nQHB1bWNoLmNu; Liu Dawei, ZHdsaXU5OEAxNjMuY29t