
94% of researchers rate our articles as excellent or good
Learn more about the work of our research integrity team to safeguard the quality of each article we publish.
Find out more
ORIGINAL RESEARCH article
Front. Med. , 15 June 2021
Sec. Gastroenterology
Volume 8 - 2021 | https://doi.org/10.3389/fmed.2021.686885
 Yu-feng Chen1,2,3†
 Zhao-liang Yu1,2,3†
 Min-yi Lv1,2,3†Bin Zheng2,3Ying-xin Tan4Jia Ke1,2,3Xuan-hui Liu1,2,3Ze-rong Cai1,2,3Yi-feng Zou1,2,3
 Ping Lan1,2,3*
 Xiao-jian Wu1,2,3*
 Feng Gao1,2,3*
Background: Hypoxia is associated with a poorer clinical outcome and resistance to chemotherapy in solid tumors; identifying hypoxic-related colorectal cancer (CRC) and revealing its mechanism are important. The aim of this study was to assess hypoxia signature for predicting prognosis and analyze relevant mechanism.
Methods: Patients without chemotherapy were selected for the identification of hypoxia-related genes (HRGs). A total of six independent datasets that included 1,877 CRC patients were divided into a training cohort and two validation cohorts. Functional annotation and analysis were performed to reveal relevant mechanism.
Results: A 12-gene signature was derived, which was prognostic for stage II/III CRC patients in two validation cohorts [TCGA, n = 509, hazard ratio (HR) = 2.14, 95% confidence interval (CI) = 1.18 – 3.89, P = 0.01; metavalidation, n = 590, HR = 2.46, 95% CI = 1.59 – 3.81, P < 0.001]. High hypoxic risk was correlated with worse prognosis in CRC patients without adjuvant chemotherapy (HR = 5.1, 95% CI = 2.51 – 10.35, P < 0.001). After integration with clinical characteristics, hypoxia-related gene signature (HRGS) remained as an independent prognostic factor in multivariate analysis. Furthermore, enrichment analysis found that antitumor immune response was suppressed in the high hypoxic group.
Conclusions: HRGS is a promising system for estimating disease-free survival of stage II/III CRC patients. Hypoxia tumor microenvironment may be via inhibiting immune response to promote chemoresistance in stage II/III CRC patients.
Colorectal cancer (CRC) is the third most common cancer type in men (10.9% of all cancers) and the second in women (9.5% of all cancers) worldwide (1). Currently, the therapeutic treatment for individual patients is mainly based on the TNM staging (2). However, for stages II and III CRC patients, the current staging method cannot provide indications of how and when to use chemotherapy, neither is the possible effectiveness of chemotherapy. As a result, chemotherapy frequently leads to diverse unpredictable responses due to risk factors such as T stage, tumor differentiation, and microsatellite instability (MSI) status (3–5). A previous study has shown that some stage II CRC patients have worse prognosis, whereas some stage III patients are overtreated (6). Therefore, investigating new reliable biomarkers can help to choose the appropriate therapy at the right time for CRC patients.
Hypoxia is a common microenvironmental condition found in most solid tumors and is associated with poor prognosis (7–9). Hypoxia-inducible factors can be activated under the hypoxia condition in the cellular environment. Evidence has shown that these factors can promote the tumor invasion and metastasis (10–12). Furthermore, recent studies have found that the hypoxic tumor microenvironment could affect the chemotherapy efficiency to CRC patients (13, 14). Therefore, it is important to identify prognostic hypoxia-inducible factors that could help to choose the appropriate therapy against the CRC.
Currently, hypoxic gene signatures are found to have prognostic and predictive effects for diverse cancers including head and neck, bladder, soft tissue sarcoma, and cervical cancers, which allow clinicians to coordinate the therapeutic agent use for patients with most benefit (7, 8, 15–18). In this study, we analyzed hypoxia-related genes from large amounts of CRC transcriptional data and created a hypoxia-related gene signature (HRGS) for CRC prognosis. The prognostic prediction value of the HRGS was systematically validated in a metavalidation cohort. In addition, we demonstrated a relevant mechanism underlying the poor survival outcome of the high hypoxic risk CRC patients at stage II/III, and this finding may help to detect out new therapeutic target for CRC patients. This would help improve therapeutic strategy for CRC patients.
This meta-analysis study used the gene expression data of frozen CRC tumor tissue samples from six public cohorts. To be included in the study, patients needed to meet the following inclusion criterion: patients with pathologic diagnosed as CRC. The exclusion criterion was patients without survival information. In total, data of 1,877 patients, including 309 CRC patients without adjuvant chemotherapy, were used. The two largest individual datasets, CIT/GSE39582 and The Cancer Genome Atlas (TCGA) CRC cohort, were used for training and independent validation. The remaining four microarray datasets (GSE14333, GSE17536, GSE37892, and GSE33113) obtained from the Gene Expression Omnibus (GEO) database were merged as a metavalidation cohort. Data of the TCGA CRC cohort were downloaded from Broad GDAC Firehose (http://gdac.broadinstitute.org/), and transcripts per million of level 3 RNA-Seq data in log2 scale were used for the analysis. Other datasets were obtained in processed format from GEO database through R using the Bioconductor package “GEOquery.” The batch effects were corrected using “combat” algorithm implemented in the R package “sva,” and z scores of each gene were used for the following analyses. The staging classification in each dataset was based on pathologic stage. Data were collected from September 27 to December 26, 2018.
The Molecular Signatures Database (MSigDB) is one of the most widely used and comprehensive databases of gene sets for performing gene set enrichment analysis (GSEA) (19–21). We created a list of hypoxia-related genes (HRGs) including all gene sets found in MSigDB (version 6.2) with the keyword “hypoxia.” In order to construct a prognostic HRGS, we assessed the association between all HRGs found in this meta-analysis and the patients' disease-free survival (DFS) in GSE39582 dataset using the log-rank test with 1,000 times randomization (80% proportion of samples each time). HRGs, which have frequently been significantly associated with the patients' DFS, were selected as candidates for the construction of HRGS. To minimize the risk of overfitting, we applied a Cox proportional hazards regression model combined with the least absolute shrinkage and selection operator (LASSO) (glmnet, version 2.0-16). The penalty parameter was estimated by 10-fold cross-validation in the training dataset at 1 SE beyond the minimum partial likelihood deviance.
In order to separate patients into low- or high-risk groups, the optimal HRGS cutoff was determined by a time-dependent receiver operating characteristic (ROC) curve (survival ROC, version 1.0.3) at 5 years in the training dataset. The Kaplan–Meier estimation method was used to estimate the ROC curve. The predictive value of HRGS that corresponded to the shortest distance between the ROC curve and the point representing both the 100% true positive rate and 0% false-positive rate was selected as the cutoff value.
The prognostic value of the HRGS was assessed in stage II/III CRC patients and patients with all stages in the training and independent validation cohorts in univariate analyses, respectively. The prognostic value of HRGS was also examined with available clinical and pathologic variables in multivariate analyses.
To investigate the biological characteristic of the HRGS, we conducted enrichment analysis for differentially expressed genes between hypoxic risk groups in TCGA CRC dataset using the R package “gProfileR.” The biological pathways of interest were further analyzed by GSEA in R using the Bioconductor package “HTSanalyzeR.” (22) In addition, we estimated the proportion of infiltrated immune cells and stromal cells within the tumor tissues using the ESTIMATE (Estimation of STromal and Immune cells in MAlignant Tumor tissues using Expression data) (23). The proportion of different types of immune cells such as lymphocytes, monocytes, and neutrophils and necrosis percentage were calculated using CIBERSORT (24).
Statistical analysis was conducted using SPSS (version 22.0.0, IBM SPSS Statistics, IBM Corp., Armonk, NY) and R software (version 3.5.1; http://www.Rproject.org). Means with standard deviations or medians with interquartile ranges were calculated for continuous values, whereas frequencies were determined for categorical values. The significance between two different groups composed of continuous values was examined using the Student t test. Univariate analysis of the association of HRGS and other clinical pathologic factors with DFS was conducted using log-rank test. Multivariate analysis was conducted for the factors with a p < 0.01 in the univariate analysis, using the Cox proportional hazards regression model. The C-index was calculated with survcomp (version 1.32.0). A P < 0.05 was considered statistically significant.
According to the CIT gene microarray dataset (GSE39582), a total of 309 eligible CRC patients without chemotherapy were enrolled in the analysis as a discovery cohort. Among 3,444 HRGs selected from MSigDB, 3,184 HRGs were detected in the meta-analysis in this study. Filtering based on conditions that the median absolute deviation is >0.5 and expression level is greater than the total median expression level, 1,636 HRGs remained. Then, the HRGs were used as candidates to construct HRGS and stage II/III CRC patients in GSE39582 as training cohort. The association between these genes and patients' DFS were assessed using 1,000 times randomization of Cox univariate regression model, and choosing 95% repeatable genes, 40 HRGs were selected. Using LASSO Cox regression in stage II/III patients, 12 prognostic HRGs were selected to construct the HRGS (Figure 1). We used satisfactory RFS cutoff at 5 years in a time-dependent ROC curve analysis to train HRGS for stratifying high and low hypoxic risk groups (Supplementary Figure 1A). The prognosis correlation coefficient of each gene in HRGS was determined (Table 1), and the related risk score calculation model was defined (Supplementary Figures 1B,C). As expected, GSEA showed that the hypoxia pathways were enriched in the high hypoxic risk patients from GSE39582, confirming that the HRGS was hypoxic-related signature (Supplementary Figure 1D). Using stage II/III CRC patients in the CIT dataset (n = 469) as training dataset, more recurrence cases were arranged in the hypoxia high-risk group than in the low-risk group (Figures 2A,D; P < 0.001). Furthermore, this trend was confirmed in TCGA CRC cohort and Meta-validation cohort (Figures 2B,C,E,F).
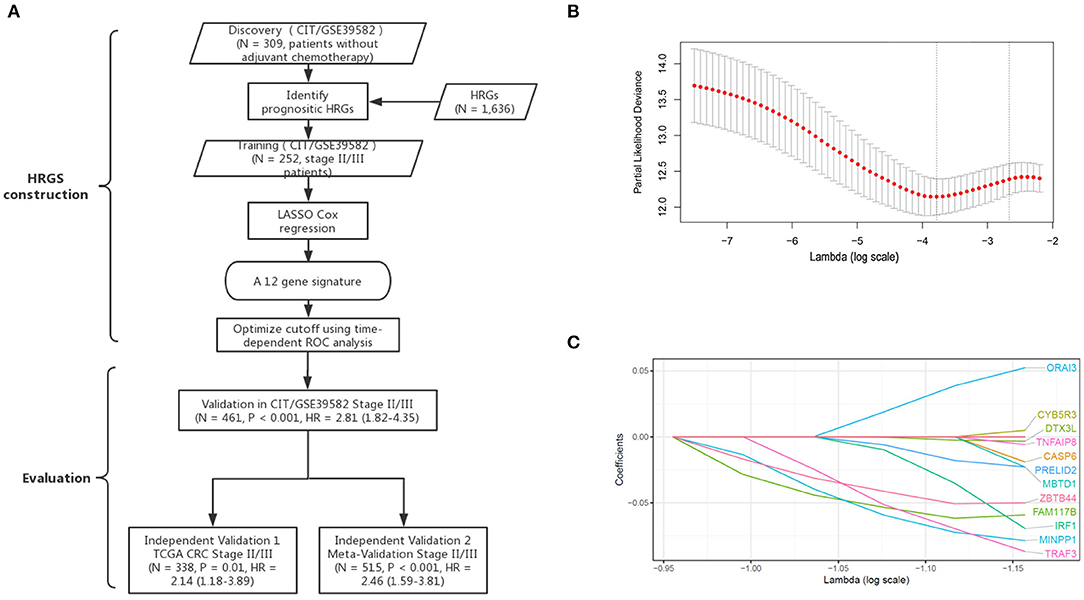
Figure 1. Establishment and verification of HRGS. A schematic flowchart of study design and analysis steps (A). The optimal lambda in the LASSO model was chosen, and the lowest standard 5-fold crossvalidation was used. By using the minimum standard and the minimum standard of 1 SE (1 – SE standard), a vertical line was drawn at the optimal value (B). Twelve hypoxia-related genes selected in LASSO COX regression (C).
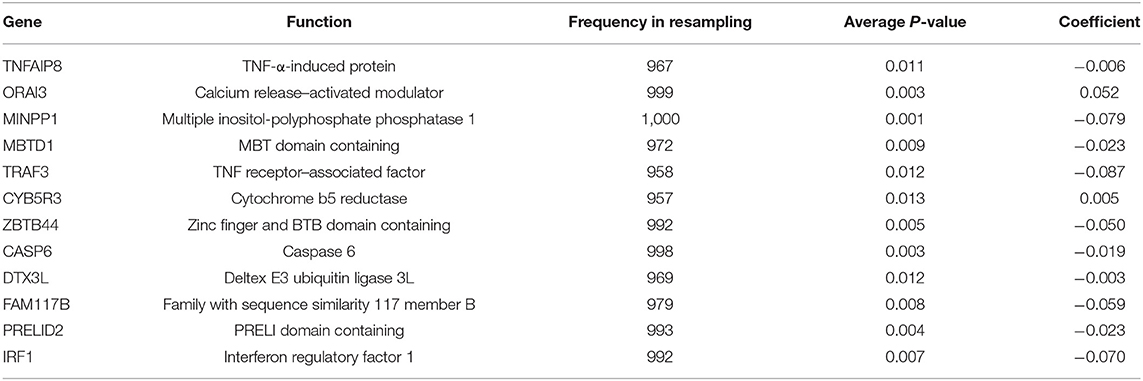
Table 1. Twelve-Gene hypoxia signature.
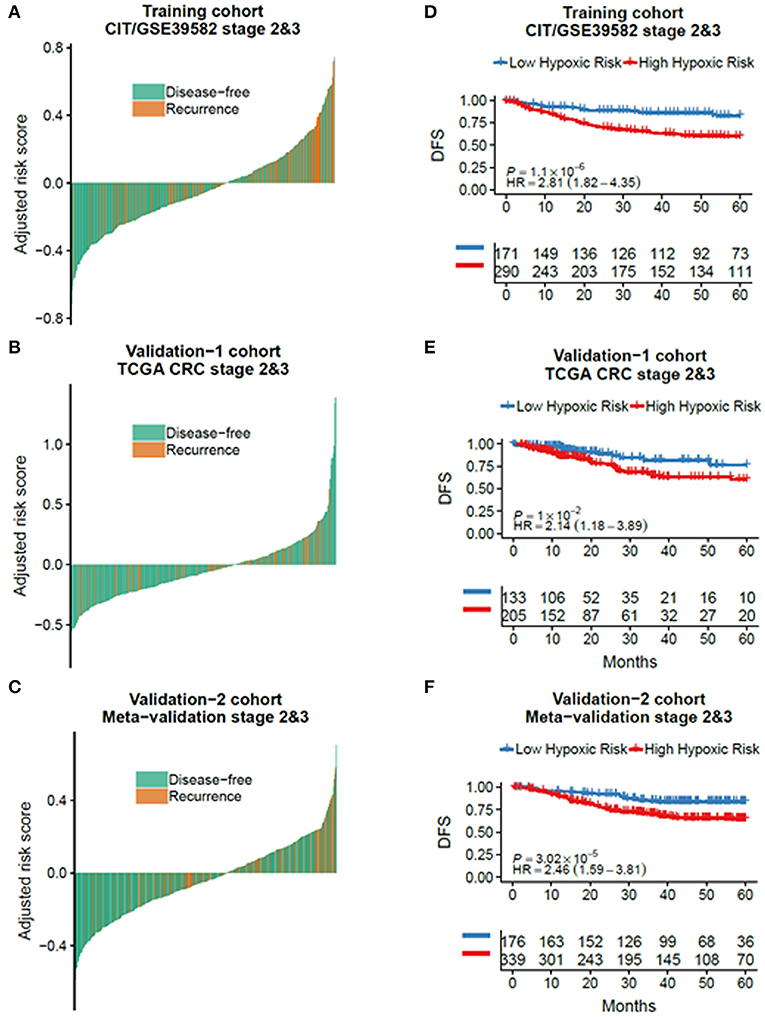
Figure 2. The outcome of low and high hypoxic risk in stage II/III CRC patients. The disease-free and recurrence patients in the different hypoxic risk groups of training cohort (A), TCGA cohort (B), and metavalidation cohort (C). Kaplan–Meier curves comparing patients with low or high hypoxic risk in training cohort (D), TCGA cohort, (E) and metavalidation cohort (F). P values were calculated using log-rank tests. HR, hazard ratio.
To validate the prognostic power of HRGS, the TCGA dataset (n = 624) and the metavalidation cohort (n = 687) composed of GSE17536, GSE33113, GSE37892, and GSE14333 were used. All datasets include the transcriptional data and prognostic information. No significant difference was observed among the three cohorts regarding the clinical and pathologic factors (Table 2, Supplementary Tables 1, 2). To evaluate the HRGS signature, we compared the nomogram with or without HRGS in R and analyzed the area under the curve (AUC) of the ROC curve. The AUC of nomogram with HRGS was 0.61, which was better than the nomogram without HRGS 0.56 (Supplementary Figures 2A,B). Decision curve analysis (DCA) was conducted to determine the clinical usefulness of the predicted nomogram by quantifying the net benefits at different threshold. As expected, addition of HRGS improved the DCA in patients of GSE39582, TCGA, and metavalidation cohorts (Supplementary Figure 2C).
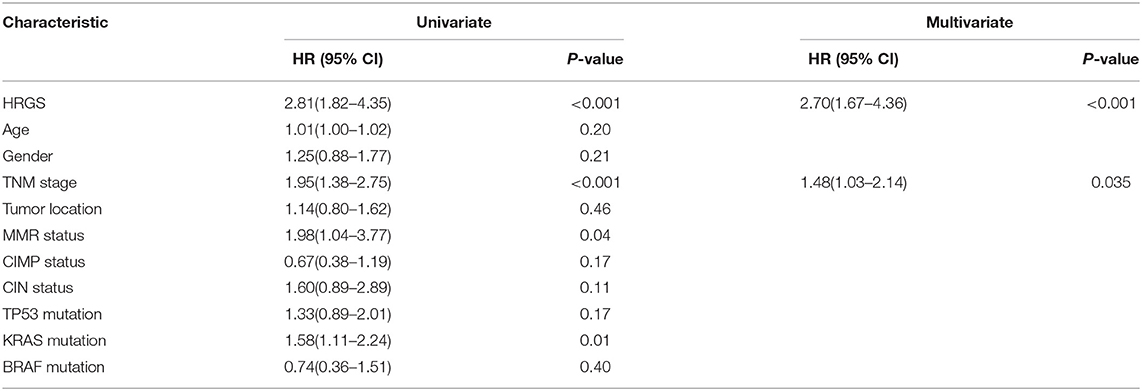
Table 2. Univariate and multivariate analyses of HRGS and clinical and pathologic factors with DFS of stage II/III patients in training cohorts (CIT/GSE39582).
Using the same risk score calculation model, stage II/III CRC patients were divided into low and high hypoxic risk groups. Statistical differences of the DFS score were detected between these two risk groups in the training cohort [hazard ratio (HR) = 2.81, 95% confidence interval (CI) = 1.82–4.35, P < 0.001], validation (HR = 2.14, 95% CI = 1.18–3.89, P = 0.01), and metavalidation cohort (HR = 2.46, 95% CI = 1.59–3.81, P < 0.001) (Figures 2D–F). To further validate its clinical prognostic value, HRGS was compared with Oncotype DX, a commercially available diagnostic test that estimates the recurrence risk of the breast cancer (Supplementary Table 3). The result showed that HRGS has a better C-index in the training cohort (0.73 vs. 0.60), TCGA cohort (0.69 vs. 0.51), and the metavalidation cohort (0.72 vs. 0.67).
Furthermore, the HRGS test showed satisfactory prognostic value to evaluate patents' DFS in all-stage CRC cohort (CSE39582 cohort, HR = 2.30, 95% CI = 1.60–3.30, P < 0.001; TCGA cohort, HR = 2.10, 95% CI = 1.30–3.39, P = 0.01; metavalidation cohort, HR = 2.43, 95% CI = 1.59–3.70, P < 0.001) (Supplementary Figures 3D–F) and had a prognostic value to evaluate patents' overall survival (Supplementary Figures 3G–I).
Univariate and multivariate analyses were applied to determine if the age, sex, tumor stage, tumor location, pathologic gene status, and HRGS were associated with CRC patients' outcomes. Univariate analysis data showed that high HRGS was significantly associated with worse prognosis in the training cohort (HR = 2.81, 95% CI = 1.82 – 4.35, P < 0.001, Table 2), TCGA cohort (HR = 2.11, 95% CI = 1.16–3.83, P = 0.01, Supplementary Table 2), and metavalidation cohort (HR = 2.46, 95% CI = 1.49 – 3.81, P < 0.001, Supplementary Table 2). In addition, multivariate analysis revealed that HRGS could be an independent prognostic factor in the (CSE39582 cohort, HR = 2.70, 95% CI = 1.67–4.36, P < 0.001, Table 2; TCGA cohort, HR = 2.02, 95% CI = 1.11–3.68, P = 0.02; metavalidation cohort, HR = 2.12, 95% CI = 1.36–3.29, P < 0.001, Supplementary Table 2).
To examine whether HRGS could predict the effect of adjuvant chemotherapy for CRC patients, we separated the non–chemotherapy-treated and the chemotherapy-treated group into high and low hypoxia groups using HRGS test and analyzed the prognosis data of these patient groups. In CRC patients without adjuvant chemotherapy, the DFS of the high hypoxia group was worse than that of the low hypoxia group in both the training (HR = 5.10, 95% CI = 2.51–10.35, P < 0.001, Figure 3A) and TCGA cohorts (HR = 2.54, 95% CI = 1.03–6.30, P = 0.037, Figure 3D). In patients who received adjuvant chemotherapy, no significant difference in DFS was found between the two groups (Figures 3B,E; P > 0.05). Moreover, the DFS of the high hypoxia group without chemotherapy treatment had a similar outcome as compared with the chemotherapy-treated patients (Figures 3C,F; P > 0.05).
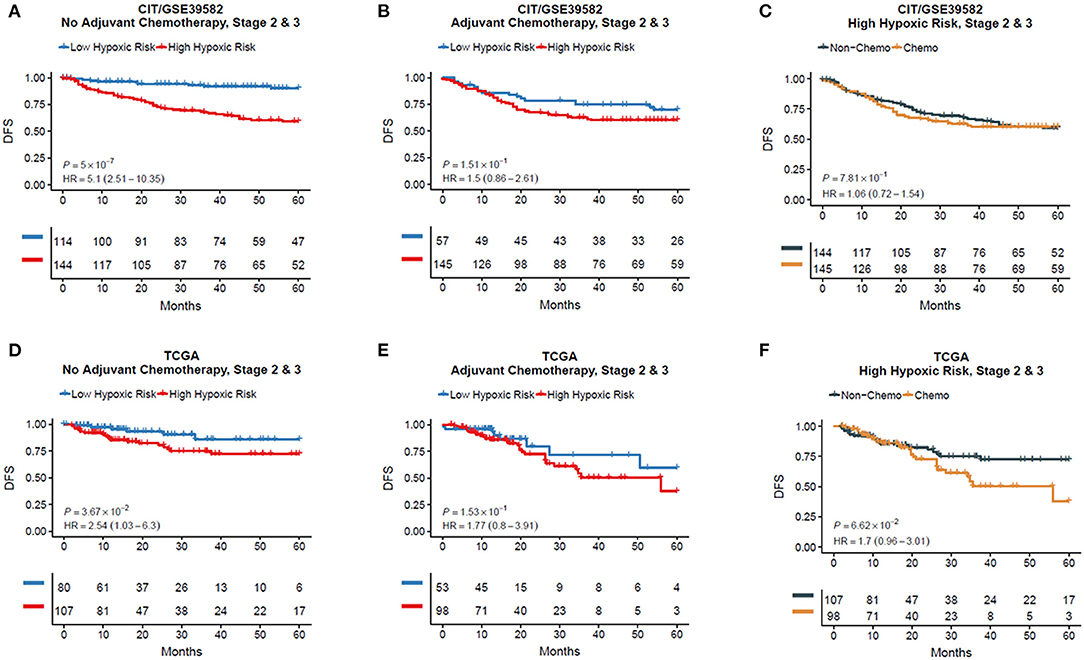
Figure 3. Kaplan–Meier plots for validations of the 12-gene hypoxia signature in chemotherapy and non-chemotherapy cohorts (A–F).
To explore the possible underlying mechanisms responsible for the worse outcome of DFS in the high hypoxic risk patients, enrichment analysis of differentially expressed genes was conducted by identifying several overrepresented biological processes in the Gene Ontology (GO) and Kyoto Encyclopedia of Genes and Genomes (KEGG). Interestingly, the most valuable biological processes were found to be associated with immune system response (Figure 4A). To further evaluate the role of genes corresponding to the HRGS, GSEA was performed in TCGA CRC cohort and found that the hypoxia environment was statistically related to interferon α (IFN-α), IFN-γ, interleukin 6 (IL-6), and IL-2 (Figure 4B), which are important components of the immune response network.
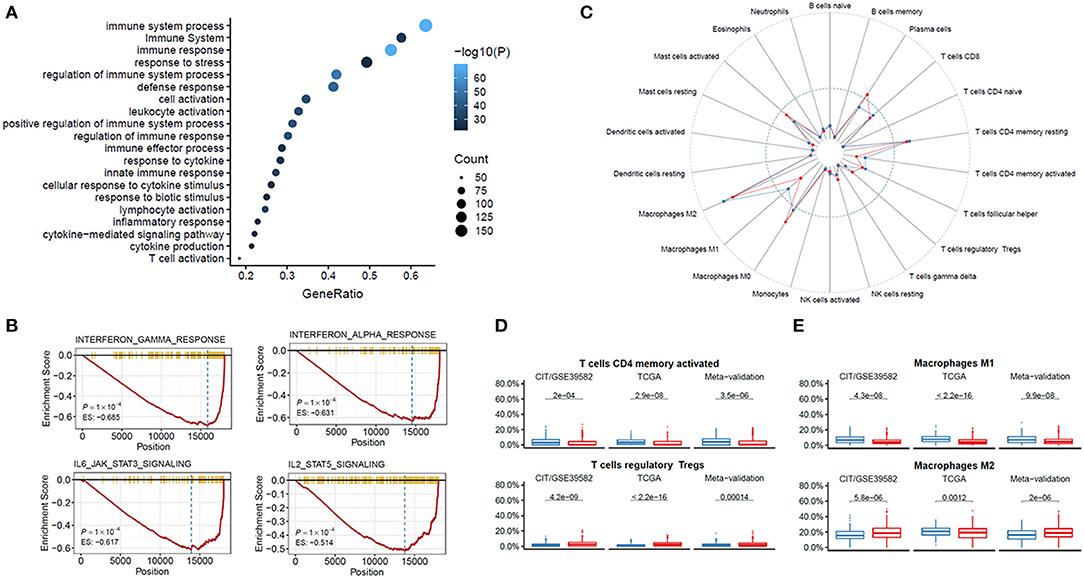
Figure 4. Functional annotation of the HRGS. Enrichment analysis of the differentially expressed genes between risk groups in GO and KEGG (A). GSEA showed IFN-α, IFN-γ, IL-6, and IL-2 were depressed in the high hypoxic risk patients (B). Immune cells were assessed based on data from TCGA (C). CD4 T cells and M1 macrophages were depressed while T cells and M2 macrophages were enriched in the high hypoxia group (D,E). P values comparing hypoxia high- and low-risk groups were calculated with t tests.
ESTIMATE algorithm was used to further validate the immune system response between different hypoxic risk patients. A lower stromal score (P < 0.001), immune score (P < 0.001), and ESTIMATE score (P < 0.001) were found in the high hypoxic risk group (Supplementary Figures 4A,B). Further analysis of the specific immune cell types were identified using CIBERSORT, lower percentages of CD4 T cells, and M1 macrophages, whereas higher percentages of regulatory T cells and M2 macrophages were detected in the high hypoxia group (Figures 4C,D). To investigate whether the HRGS can predict the prognosis of immunotherapy, we evaluated HRGS in a cohort of patients with programmed cell death (PD-1) blockade treatment (25). The results show that high hypoxic risk patients have a tendency for worse prognosis after immunotherapy but cannot reach statistical significance (Supplementary Figure 5A). In addition, high-risk group patients have a lower score of T-effector cell infiltration score (IMmotion150 Teff signature), immune infiltration (Javelin signature), and Merck18, which are consistent with our results (Supplementary Figure 5B).
To investigate the therapeutic strategy for high hypoxic risk patients, we analyzed the half maximal inhibitory concentration (IC50) of different drugs in the Pharmacogenomics database Genomics of Drug Sensitivity in Cancer (GDSC) with HRGS. Using the same risk score calculation model, all cell lines in the GDSC were divided into low and high hypoxic risk groups and analyzed the IC50 of different drugs. A total of five drugs have statistical significance: AZ6102, fulvestrant, irinotecan, temozolomide, and topotecan (Supplementary Figure 5C). As expected, high hypoxic risk group cells were more resistant to the traditional chemotherapeutic drugs, such as fulvestrant, irinotecan, temozolomide, and topotecan. Interestingly, high hypoxic risk group cells were more sensitive to AZ6102, a selective TNKS1/2 inhibitor.
Current cancer-related clinical trials have not included the hypoxia status as a variable factor despite large variability of tumor microenvironment due to the hypoxia status (26–29). Although hypoxia tumor microenvironment has been shown to affect the chemotherapy outcome in various cancer types (14, 30–32), there is no tool that could distinguish the high/low hypoxia risk and predict prognostic response to chemotherapy in CRC. In this study, we selected various HRGs to create an HRGS for CRC patients. The data suggested that the HRGS can stratify stage II/III CRC patients into subgroups with different DFS at a 5-year follow-up duration. Moreover, HRGS test showed a better C-index outcome as compared with the existing prognostic tool, Oncotype DX. These results indicate that the HRGS test could be an effective prognostic tool to distinguish the hypoxia status among CRC patients.
Current TNM stage classification could not efficiently separate the patient group for whom chemotherapy was effective within stage II CRC patients. Studies have shown that chemotherapy-treated patients have >5% improvement in the 5-year survival rate (2, 33), and the treatment did not reduce the recurrence risk (34–36). A more efficient selection method is required to determine the patient group for whom chemotherapy was effective within stage II CRC patients. A hypoxia gene signature–based test may be a potential candidate, as it is known that the hypoxia microenvironment could promote tumor invasion and metastasis (10, 11, 37), and HRGS could effectively select patients for individual-based treatment in other cancer types (7, 8). However, the predictive potential of HRGS for the disease prognosis and the chemotherapy outcome in CRC patients has not been examined yet. In this study, we identified high and low hypoxic risk groups within CRC patients using HRGS. The high hypoxic risk group within non–chemotherapy-treated CRC patients had a similar disease prognosis as compared to the chemotherapy-treated CRC patients and had a significantly worse prognosis as compared with low hypoxic risk group. These results implied that high hypoxic risk related to tumor recurrence and HRGS could help to determine the non–chemotherapy-treated patients who could benefit from chemotherapy or other adjuvant treatment.
To find a novel therapeutic strategy for high hypoxia risk patients, it is important to understand the intrinsic mechanism among hypoxia-related poor prognosis. Our previous study showed that the hypoxia tumor microenvironment was related to dysregulated cell cycle machinery and PI3K-AKT-mTOR pathways (38). To date, a genome-wide mechanistic analysis of how hypoxia tumor microenvironment induces poor chemotherapy response is still lacking. Analysis of an HRGS test identified that the hypoxia high-risk group has significantly lower scores of stromal and immune cell infiltrations than those observed in the hypoxia low-risk group. Previous studies have postulated that tumor hypoxia reduces the antitumor effect by suppressing the microenvironment immune response (37, 39). A large number of immunosuppressive cells, such as myeloid-derived suppressor cells, tumor-associated macrophages, and T-regulatory cells, were found in the hypoxic zones of the tumor (37, 40, 41). In line with these data, we also found that the enriched T-regulatory cells and M2 macrophages, but less amount of M1 macrophages in the high-hypoxic risk patients. These data suggest that hypoxia microenvironment was probably associated with immune suppression and enhanced tumor progression. As hypoxic microenvironment could provide tumor resistant to immunotherapy (42, 43), which has emerged as an effective therapy for CRC (44, 45), HRGS may have the potential to predict the outcome of the immunotherapy. Further studies will be required to verify this hypothesis.
Despite the exciting finding in this study, some limitations to the study should be noted. First, although we included as many datasets as possible for validation of our HRGS, the results of this study should be carefully evaluated because of the shortage of the retrospective design. Second, gene expression signature is subject to sampling bias caused by intratumor genetic heterogeneity (46). Although we have reduced as many as possible cross-study batch effects by constant ordering and excluding HRGs, their complex nature implies that not all batch effects can be addressed. To be more objective, further validation using prospective data from multiple centers would be ideal and necessary before its application in clinical practice.
In conclusion, the proposed prognostic HRGS is a promising test system to estimate the DFS of stage II/III CRC patients and to predict the possible beneficial effect from the chemotherapy. Hypoxia tumor microenvironment may promote chemoresistance in stage II/III CRC patients by inhibiting the local immune response.
The datasets generated for this study can be found in online repositories. The names of the repository/repositories and accession number(s) can be found in the article/Supplementary Material.
The studies involving human participants were reviewed and approved by Institutional Review Board (IRB) of The Sixth Affiliated Hospital of Sun Yat-sen University. The patients/participants provided their written informed consent to participate in this study.
Y-fC, Z-lY, M-yL, PL, X-jW, and FG contributed to study concept and design, acquisition, analysis, interpretation of data, and drafting of the manuscript. Y-fC, Z-lY, BZ, X-hL, Z-rC, M-yL, and Y-xT contributed to data collections and manuscript review. Y-fC, Z-lY, Y-fZ, and JK contributed to study concept and design, analysis and interpretation of data, and critical revision of the manuscript for important intellectual content. PL, X-jW and FG supervised the study. All authors read and approved the final manuscript.
This work was supported by National Key Clinical Discipline, National Natural Science Foundation of China (NSFC) (Nos. 81972212, 82002221, 82003197), Guangdong Natural Science Foundation (No. 2017A030310517), Science and Technology Planning Project of Guangdong Province (No. 2017B020226001), and Fundamental Research Funds for the Central Universities (No.17ykpy66).
The authors declare that the research was conducted in the absence of any commercial or financial relationships that could be construed as a potential conflict of interest.
Thanks for the support and useful discussions with other members of The Sixth Affiliated Hospital, Sun Yat-sen University.
The Supplementary Material for this article can be found online at: https://www.frontiersin.org/articles/10.3389/fmed.2021.686885/full#supplementary-material
Supplementary Figure 1. Obtain the optimal cutoff at 5 years in a time-dependent ROC curve analysis (A). The risk score calculation model was defined: β is the prognosis correlation coefficient, and expr represents the expression value of the corresponding gene (B). Heatmap of HRGs in the two groups (C). GSEA showed hypoxia pathways were enriched in the high hypoxic risk patients (D).
Supplementary Figure 2. Nomogram for evaluation of HRGS. Development of the nomogram based on the result of multivariate analysis (A). The receiver operating characteristic (ROC) curve (B) and decision curve analysis (DCA) (C) of nomogram with or without HRGS.
Supplementary Figure 3. The clinical outcome of low and high hypoxic risk groups in all-stage CRC patients. The disease-free and recurrence patients in the different hypoxic risk groups of training cohort (A), TCGA cohort (B), and metavalidation cohort (C). Kaplan–Meier curves comparing patients' DFS with low or high hypoxic risk in training cohort (D), TCGA cohort (E), and metavalidation cohort (F). Kaplan–Meier curves comparing patients' OS with low or high hypoxic risk in training cohort (G), TCGA cohort (H), and metavalidation cohort (I). P values were calculated using log-rank tests. HR, hazard ratio.
Supplementary Figure 4. Functional annotation of the HRGS. Heatmap of differentially expressed genes in the two groups (A). Analysis of ESTIMATE algorithm to the TCGA dataset (B).
Supplementary Figure 5. The overall survival of low and high hypoxic risk groups in advanced clear cell renal cell carcinoma patients with PD-1 blockade treatment (A). The score of T-effector cell infiltration score (IMmotion150 Teff signature), immune infiltration (Javelin signature), and Merck18 in low and high hypoxic risk group patients. The IC50 of AZ6102, fulvestrant, irinotecan, temozolomide, and topotecan in low and high hypoxic risk group patients (C).
Supplementary Table 1. Characteristics of II/III stage patients in training, validation and meta-validation cohorts.
Supplementary Table 2. Univariate and multivariate analysis of HRGs, clinical and pathologic factors of II/III stage patients in validation cohorts.
Supplementary Table 3. C-index for Hypoxic Risk compared with Oncotype DX in three cohorts.
Supplementary Table 4. Patients' hypoxic risk stratification.
1. Bray F, Ferlay J, Soerjomataram I, Siegel RL, Torre LA, Jemal A. Global cancer statistics 2018: GLOBOCAN estimates of incidence and mortality worldwide for 36 cancers in 185 countries. CA Cancer J Clin. (2018) 68:394–424. doi: 10.3322/caac.21492
2. Glynne-Jones R, Wyrwicz L, Tiret E, Brown G, Rodel C, Cervantes A, et al. Rectal cancer: ESMO Clinical Practice Guidelines for diagnosis, treatment and follow-up. Ann Oncol. (2017) 28:iv22–40. doi: 10.1093/annonc/mdx224
3. Dienstmann R, Salazar R, Tabernero J. Personalizing colon cancer adjuvant therapy: selecting optimal treatments for individual patients. J Clin Oncol. (2015) 33:1787–96. doi: 10.1200/JCO.2014.60.0213
4. Kopetz S, Tabernero J, Rosenberg R, Jiang ZQ, Moreno V, Bachleitner-Hofmann T, et al. Genomic classifier ColoPrint predicts recurrence in stage II colorectal cancer patients more accurately than clinical factors. Oncologist. (2015) 20:127–33. doi: 10.1634/theoncologist.2014-0325
5. Provenzale D, Gupta S, Ahnen DJ, Bray T, Cannon JA, Cooper G, et al. Genetic familial high-risk assessment colorectal version 1.2016, NCCN clinical practice guidelines in oncology. J Natl Compr Canc Netw. (2016) 14:1010–30. doi: 10.6004/jnccn.2016.0108
6. Miller KD, Siegel RL, Lin CC, Mariotto AB, Kramer JL, Rowland JH, et al. Cancer treatment and survivorship statistics, 2016. CA Cancer J Clin. (2016) 66:271–89. doi: 10.3322/caac.21349
7. Toustrup K, Sorensen BS, Nordsmark M, Busk M, Wiuf C, Alsner J, et al. Development of a hypoxia gene expression classifier with predictive impact for hypoxic modification of radiotherapy in head and neck cancer. Cancer Res. (2011) 71:5923–31. doi: 10.1158/0008-5472.CAN-11-1182
8. Eustace A, Mani N, Span PN, Irlam JJ, Taylor J, Betts GN, et al. A 26-gene hypoxia signature predicts benefit from hypoxia-modifying therapy in laryngeal cancer but not bladder cancer. Clin Cancer Res. (2013) 19:4879–88. doi: 10.1158/1078-0432.CCR-13-0542
9. Yang L, Roberts D, Takhar M, Erho N, Bibby BAS, Thiruthaneeswaran N, et al. Development and validation of a 28-gene Hypoxia-related prognostic signature for localized prostate cancer. EBioMedicine. (2018) 31:182–9. doi: 10.1016/j.ebiom.2018.04.019
10. Zhang Q, Chen Y, Zhang B, Shi B, Weng W, Chen Z, et al. Hypoxia-inducible factor-1α polymorphisms and risk of cancer metastasis a meta-analysis. PLoS ONE. (2013) 8:e70961. doi: 10.1371/journal.pone.0070961
11. Wang T, Gilkes DM, Takano N, Xiang L, Luo W, Bishop CJ. Hypoxia-inducible factors and RAB22A mediate formation of microvesicles that stimulate breast cancer invasion and metastasis. Proc Natl Acad Sci U S A. (2014) 111:E3234–42. doi: 10.1073/pnas.1410041111
12. Ka-Lun Kai A, Chan LK, Cheuk-Lam Lo R, Man-Fong Lee J, Chak-Lui Wong C, Chun-Ming Wong J, et al. Down-regulation of TIMP2 by HIF-1α/miR-210/HIF-3α regulatory feedback circuit enhances cancer metastasis in hepatocellular carcinoma. Hepatology. (2016) 64:473–87. doi: 10.1002/hep.28577
13. Wen YA, Stevens PD, Gasser ML, Andrei R, Gao T. Downregulation of PHLPP expression contributes to hypoxia-induced resistance to chemotherapy in colon cancer cells. Mol Cell Biol. (2013) 33:4594–605. doi: 10.1128/MCB.00695-13
14. Tang YA, Chen YF, Bao Y, Mahara S, Yatim S, Oguz G, et al. Hypoxic tumor microenvironment activates GLI2 via HIF-1alpha and TGF-beta2 to promote chemoresistance in colorectal cancer. Proc Natl Acad Sci U S A. (2018) 115:E5990–9. doi: 10.1073/pnas.1801348115
15. Betts GN, Eustace A, Patiar S, Valentine HR, Irlam J, Ramachandran A, et al. Prospective technical validation and assessment of intra-tumour heterogeneity of a low density array hypoxia gene profile in head and neck squamous cell carcinoma. Eur J Cancer. (2013) 49:156–65. doi: 10.1016/j.ejca.2012.07.028
16. Fjeldbo CS, Julin CH, Lando M, Forsberg MF, Aarnes EK, Alsner J, et al. Integrative analysis of DCE-MRI and gene expression profiles in construction of a gene classifier for assessment of hypoxia-related risk of chemoradiotherapy failure in cervical cancer. Clin Cancer Res. (2016) 22:4067–76. doi: 10.1158/1078-0432.CCR-15-2322
17. Ragnum HB, Vlatkovic L, Lie AK, Axcrona K, Julin CH, Frikstad KM, et al. The tumour hypoxia marker pimonidazole reflects a transcriptional programme associated with aggressive prostate cancer. Br J Cancer. (2015) 112:382–90. doi: 10.1038/bjc.2014.604
18. Yang L, Taylor J, Eustace A, Irlam JJ, Denley H, Hoskin PJ, et al. A gene signature for selecting benefit from hypoxia modification of radiotherapy for high-risk bladder cancer patients. Clin Cancer Res. (2017) 23:4761–8. doi: 10.1158/1078-0432.CCR-17-0038
19. Subramanian A, Tamayo P, Mootha VK, Mukherjee S, Ebert BL, Gillette MA, et al. Gene set enrichment analysis: a knowledge-based approach for interpreting genome-wide expression profiles. Proc Natl Acad Sci U S A. (2005) 102:15545–50. doi: 10.1073/pnas.0506580102
20. Liberzon A, Subramanian A, Pinchback R, Thorvaldsdottir H, Tamayo P, Mesirov JP. Molecular signatures database (MSigDB) 3.0. Bioinformatics. (2011) 27:1739–40. doi: 10.1093/bioinformatics/btr260
21. Liberzon A, Birger C, Thorvaldsdottir H, Ghandi M, Mesirov JP, Tamayo P. The Molecular Signatures Database (MSigDB) hallmark gene set collection. Cell Syst. (2015) 1:417–25. doi: 10.1016/j.cels.2015.12.004
22. Wang X, Terfve C, Rose JC, Markowetz F. HTSanalyzeR: an R/Bioconductor package for integrated network analysis of high-throughput screens. Bioinformatics. (2011) 27:879–80. doi: 10.1093/bioinformatics/btr028
23. Yoshihara K, Shahmoradgoli M, Martinez E, Vegesna R, Kim H, Torres-Garcia W, et al. Inferring tumour purity and stromal and immune cell admixture from expression data. Nat Commun. (2013) 4:2612. doi: 10.1038/ncomms3612
24. Newman AM, Liu CL, Green MR, Gentles AJ, Feng W, Xu Y, et al. Robust enumeration of cell subsets from tissue expression profiles. Nat Methods. (2015) 12:453–7. doi: 10.1038/nmeth.3337
25. Braun DA, Hou Y, Bakouny Z, Ficial M, Sant' Angelo M, Forman J, et al. Interplay of somatic alterations and immune infiltration modulates response to PD-1 blockade in advanced clear cell renal cell carcinoma. Nat Med. (2020) 26:909–18. doi: 10.1038/s41591-020-0839-y
26. Sormendi S, Wielockx B. Hypoxia pathway proteins as central mediators of metabolism in the tumor cells and their microenvironment. Front Immunol. (2018) 9:40. doi: 10.3389/fimmu.2018.00040
27. Ge X, Pan MH, Wang L, Li W, Jiang C, He J, et al. Hypoxia-mediated mitochondria apoptosis inhibition induces temozolomide treatment resistance through miR-26a/Bad/Bax axis. Cell Death Dis. (2018) 9:1128. doi: 10.1038/s41419-018-1176-7
28. Moreno Roig E, Yaromina A, Houben R, Groot AJ, Dubois L, Vooijs M. Prognostic role of hypoxia-inducible factor-2alpha tumor cell expression in cancer patients: a meta-analysis. Front Oncol. (2018) 8:224. doi: 10.3389/fonc.2018.00224
29. Graham K, Unger E. Overcoming tumor hypoxia as a barrier to radiotherapy, chemotherapy and immunotherapy in cancer treatment. Int J Nanomed. (2018) 13:6049–58. doi: 10.2147/IJN.S140462
30. Fotheringham S, Mozolowski GA, Murray EMA, Kerr DA. Challenges and solutions in patient treatment strategies for stage II colon cancer. Gastroenterol Rep. (2019) 7:151–61. doi: 10.1093/gastro/goz006
31. Cairns RA, Papandreou I, Sutphin PD, Denko NC. Metabolic targeting of hypoxia and HIF1 in solid tumors can enhance cytotoxic chemotherapy. Proc Natl Acad Sci U S A. (2007) 104:9445–50. doi: 10.1073/pnas.0611662104
32. Samanta D, Gilkes DM, Chaturvedi P, Xiang L, Semenza GL. Hypoxia-inducible factors are required for chemotherapy resistance of breast cancer stem cells. Proc Natl Acad Sci U S A. (2014) 111:E5429–38. doi: 10.1073/pnas.1421438111
33. Lee MM, MacKinlay A, Semira C, Schieber C, Jimeno Yepes AJ, Lee B, et al. Stage-based variation in the effect of primary tumor side on all stages of colorectal cancer recurrence and survival. Clin Colorectal Cancer. (2018) 17:e569–77. doi: 10.1016/j.clcc.2018.05.008
34. Gunderson LL, Jessup JM, Sargent DJ, Greene FL, Stewart AK. Revised TN categorization for colon cancer based on national survival outcomes data. J Clin Oncol. (2010) 28:264–71. doi: 10.1200/JCO.2009.24.0952
35. Nazemalhosseini Mojarad E, Kashfi SM, Mirtalebi H, Taleghani MY, Azimzadeh P, Savabkar S, et al. Low level of microsatellite instability correlates with poor clinical prognosis in stage II colorectal cancer patients. J Oncol. (2016) 2016:2196703. doi: 10.1155/2016/2196703
36. Draht MX, Smits KM, Tournier B, Jooste V, Chapusot C, Carvalho B, et al. Promoter CpG island methylation of RET predicts poor prognosis in stage II colorectal cancer patients. Mol Oncol. (2014) 8:679–88. doi: 10.1016/j.molonc.2014.01.011
37. Terry S, Buart S, Chouaib S. Hypoxic stress-induced tumor and immune plasticity, suppression, and impact on tumor heterogeneity. Front Immunol. (2017) 8:1625. doi: 10.3389/fimmu.2017.01625
38. Zou YF, Rong YM, Tan YX, Xiao J, Yu ZL, Chen YF, et al. A signature of hypoxia-related factors reveals functional dysregulation and robustly predicts clinical outcomes in stage I/II colorectal cancer patients. Cancer Cell Int. (2019) 19:243. doi: 10.1186/s12935-019-0964-1
39. Raggi F, Pelassa S, Pierobon D, Penco F, Gattorno M, Novelli F, et al. Regulation of human macrophage M1-M2 polarization balance by hypoxia and the triggering receptor expressed on myeloid cells-1. Front Immunol. (2017) 8:1097. doi: 10.3389/fimmu.2017.01097
40. Zaeem Noman M, Hasmim M, Messai Y, Terry S, Kieda C, Janji B, et al. Hypoxia: a key player in antitumor immune response. A review in the theme: cellular responses to hypoxia. Am J Physiol Cell Physiol. (2015) 309:C569–79. doi: 10.1152/ajpcell.00207.2015
41. Gabrilovich DI, Nagaraj S. Myeloid-derived suppressor cells as regulators of the immune system. Nat Rev Immunol. (2009) 9:162–74. doi: 10.1038/nri2506
42. Scharping NE, Menk AV, Whetstone RD, Zeng X, Delgoffe GM. Efficacy of PD-1 blockade is potentiated by metformin-induced reduction of tumor hypoxia. Cancer Immunol Res. (2017) 5:9–16. doi: 10.1158/2326-6066.CIR-16-0103
43. Ai M, Budhani P, Sheng J, Balasubramanyam S, Bartkowiak T, Jaiswal AR, et al. Tumor hypoxia drives immune suppression and immunotherapy resistance. J ImmunoTher Cancer. (2015) 3:P392. doi: 10.1186/2051-1426-3-S2-P392
44. Li Y, Liang L, Dai W, Cai G, Xu Y, Li X, et al. Prognostic impact of programed cell death-1 (PD-1) and PD-ligand 1 (PD-L1) expression in cancer cells and tumor infiltrating lymphocytes in colorectal cancer. Mol Cancer. (2016) 15:55. doi: 10.1186/s12943-016-0539-x
45. LaFleur MW, Muroyama Y, Drake CG, Sharpe AH. Inhibitors of the PD-1 pathway in tumor therapy. J Immunol. (2018) 200:375–83. doi: 10.4049/jimmunol.1701044
Keywords: hypoxia-related gene signature, immunosuppression, chemoresistance, colorectal cancer, biomarker
Citation: Chen Y-f, Yu Z-l, Lv M-y, Zheng B, Tan Y-x, Ke J, Liu X-h, Cai Z-r, Zou Y-f, Lan P, Wu X-j and Gao F (2021) Genome-Wide Analysis Reveals Hypoxic Microenvironment Is Associated With Immunosuppression in Poor Survival of Stage II/III Colorectal Cancer Patients. Front. Med. 8:686885. doi: 10.3389/fmed.2021.686885
Received: 28 March 2021; Accepted: 13 May 2021;
Published: 15 June 2021.
Edited by:
Xiang Xue, University of New Mexico, United StatesCopyright © 2021 Chen, Yu, Lv, Zheng, Tan, Ke, Liu, Cai, Zou, Lan, Wu and Gao. This is an open-access article distributed under the terms of the Creative Commons Attribution License (CC BY). The use, distribution or reproduction in other forums is permitted, provided the original author(s) and the copyright owner(s) are credited and that the original publication in this journal is cited, in accordance with accepted academic practice. No use, distribution or reproduction is permitted which does not comply with these terms.
*Correspondence: Feng Gao, Z2FvZjU3QG1haWwuc3lzdS5lZHUuY24=; Xiao-jian Wu, d3V4amlhbkBtYWlsLnN5c3UuZWR1LmNu; Ping Lan, bGFucGluZ0BtYWlsLnN5c3UuZWR1LmNu
†These authors have contributed equally to this work
Disclaimer: All claims expressed in this article are solely those of the authors and do not necessarily represent those of their affiliated organizations, or those of the publisher, the editors and the reviewers. Any product that may be evaluated in this article or claim that may be made by its manufacturer is not guaranteed or endorsed by the publisher.
Research integrity at Frontiers
Learn more about the work of our research integrity team to safeguard the quality of each article we publish.