 Tingshan He
 Liwen Huang
 Jing Li
 Peng Wang
 Zhiqiao Zhang
95% of researchers rate our articles as excellent or good
Learn more about the work of our research integrity team to safeguard the quality of each article we publish.
Find out more
ORIGINAL RESEARCH article
Front. Med. , 24 May 2021
Sec. Precision Medicine
Volume 8 - 2021 | https://doi.org/10.3389/fmed.2021.587496
This article is part of the Research Topic Computational Genomics and Structural Bioinformatics in Personalized Medicines View all 18 articles
Background: The tumour immune microenvironment plays an important role in the biological mechanisms of tumorigenesis and progression. Artificial intelligence medicine studies based on big data and advanced algorithms are helpful for improving the accuracy of prediction models of tumour prognosis. The current research aims to explore potential prognostic immune biomarkers and develop a predictive model for the overall survival of ovarian cancer (OC) based on artificial intelligence algorithms.
Methods: Differential expression analyses were performed between normal tissues and tumour tissues. Potential prognostic biomarkers were identified using univariate Cox regression. An immune regulatory network was constructed of prognostic immune genes and their highly related transcription factors. Multivariate Cox regression was used to identify potential independent prognostic immune factors and develop a prognostic model for ovarian cancer patients. Three artificial intelligence algorithms, random survival forest, multitask logistic regression, and Cox survival regression, were used to develop a novel artificial intelligence survival prediction system.
Results: The current study identified 1,307 differentially expressed genes and 337 differentially expressed immune genes between tumour samples and normal samples. Further univariate Cox regression identified 84 prognostic immune gene biomarkers for ovarian cancer patients in the model dataset (GSE32062 dataset and GSE53963 dataset). An immune regulatory network was constructed involving 63 immune genes and 5 transcription factors. Fourteen immune genes (PSMB9, FOXJ1, IFT57, MAL, ANXA4, CTSH, SCRN1, MIF, LTBR, CTSD, KIFAP3, PSMB8, HSPA5, and LTN1) were recognised as independent risk factors by multivariate Cox analyses. Kaplan-Meier survival curves showed that these 14 prognostic immune genes were closely related to the prognosis of ovarian cancer patients. A prognostic nomogram was developed by using these 14 prognostic immune genes. The concordance indexes were 0.760, 0.733, and 0.765 for 1-, 3-, and 5-year overall survival, respectively. This prognostic model could differentiate high-risk patients with poor overall survival from low-risk patients. According to three artificial intelligence algorithms, the current study developed an artificial intelligence survival predictive system that could provide three individual mortality risk curves for ovarian cancer.
Conclusion: In conclusion, the current study identified 1,307 differentially expressed genes and 337 differentially expressed immune genes in ovarian cancer patients. Multivariate Cox analyses identified fourteen prognostic immune biomarkers for ovarian cancer. The current study constructed an immune regulatory network involving 63 immune genes and 5 transcription factors, revealing potential regulatory associations among immune genes and transcription factors. The current study developed a prognostic model to predict the prognosis of ovarian cancer patients. The current study further developed two artificial intelligence predictive tools for ovarian cancer, which are available at https://zhangzhiqiao8.shinyapps.io/Smart_Cancer_Survival_Predictive_System_17_OC_F1001/ and https://zhangzhiqiao8.shinyapps.io/Gene_Survival_Subgroup_Analysis_17_OC_F1001/. An artificial intelligence survival predictive system could help improve individualised treatment decision-making.
Ovarian cancer (OC) is one of the most lethal malignant tumours in women, with 295,414 new cases and 184,799 deaths in 2018 (1). Although considerable progress has been made in diagnostic and therapeutic techniques, the 5-year survival rate of advanced OC patients remains poor (2). Early identification of patients with high mortality risk and more precise, individualised treatments will help improve the prognosis of OC patients. Regarding precision medicine, developing predictive models to provide early individualised mortality risk prediction and predicting the effectiveness of specific therapeutic schedules would be significant.
Considerable progress in bioinformatics helps scientists explore the intrinsic regulatory mechanisms of tumorigenesis and progression (3–6). The immune microenvironment plays an important role in the initiation and development of tumours (7, 8). Various studies have reported the clinical value of immunotherapy for ovarian cancer (5, 6). Several studies established prognostic models to predict the prognosis of OC patients (7, 8). However, regarding precision medicine, mortality risk prediction for high-risk and low-risk subgroups could not meet the needs of individualised treatment. Individualised treatment needs precise prognostic models to provide individual mortality risk prediction for a specific agent but not for a special subgroup.
Our team constructed two precision medicine predictive tools that predict individualised mortality risk for hepatocellular carcinoma (9, 10). These two precision medicine predictive tools provide online mortality risk prediction that is convenient and easy to understand. More importantly, these precision medicine predictive tools provide individual and specific mortality risk prediction, which is important for individualised treatment decision-making. Recently, artificial intelligence based on big data and advanced algorithms has been used to improve the accuracy of predictive models for the diagnosis and prognosis in various tumours (11–13). Therefore, the current study aimed to build artificial intelligence predictive tools to predict individualised mortality risk for OC patients based on immune genes.
We retrieved the Gene Expression Omnibus (GEO) database according to the following conditions to obtain valuable research datasets: (1) The dataset should have available gene expression profile data; (2) The dataset should have complete clinicopathological data; (3) The dataset should have follow-up survival information. The GSE32062 dataset contained expression profiling data from 260 advanced-stage high-grade OC patients (https://www.ncbi.nlm.nih.gov/geo/query/acc.cgi?acc=GSE32062). The GSE53963 dataset contained expression profiling data from 174 high-grade OC patients (https://www.ncbi.nlm.nih.gov/geo/query/acc.cgi?acc=GSE53963). To eliminate the effect of death caused by non-tumour factors on the results of survival analysis, surviving patients with a survival time of <3 months were removed from the current study. Therefore, the GSE32062 dataset and GSE53963 dataset involved 420 patients, and 19,569 mRNAs were downloaded as model datasets for further survival. Probe IDs generated on the GPL6480 platform were converted to gene symbols based on Gencode v29. The TCGA cohort contained 21,586 mRNAs and 370 OC patients as a validation dataset for survival. The gene count values were log2-transformed for the TCGA cohort. The flow chart of patient selection is shown in Supplementary Figure 1.
We searched the GEO database to explore a dataset containing gene expression information of ovarian cancer samples and normal samples. The GSE26712 dataset was generated on the Affymetrix Human Genome U133A Array platform. The GSE26712 dataset has gene expression profiling information from 185 primary ovarian tumours and 10 normal ovarian surface epithelium (https://www.ncbi.nlm.nih.gov/geo/query/acc.cgi?acc=GSE26712). Therefore, differential expression analyses were performed between 185 tumour samples and 10 normal samples (GSE26712). Cut-off values for differential expression analyses were log2 |fold change| > 1 and P < 0.05. The data were normalised using the trimmed mean of M values method with “edgeR” (14).
The Immunology Database and Analysis Portal database were used to identify the immune gene list (15). Transcription factors were identified via the Cistrome Cancer database (16). Cytoscape v3.6.1 was used to develop an immune regulatory network of prognostic immune genes and their highly related transcription factors (11). Thresholds of |correlation coefficient| > 0.5 and P < 0.01 were used to identify transcription factors highly correlated with prognostic immune genes. The biological processes of immune genes were identified using the TISIDB database (http://cis.hku.hk/TISIDB/index.php).
Associations among tumour infiltrating immune cells and immune genes were evaluated by the Tumour Immune Estimation Resource database (16). Twenty-eight tumour immune infiltration scores were generated by single sample gene set enrichment analysis (17, 18).
Statistical analyses were conducted by SPSS Statistics 19.0 (SPSS Inc., USA). Artificial intelligence and bioinformatics analyses were performed using Python language 3.7.2 and R software 3.5.2 with the following artificial intelligence algorithms: random survival forest (RFS) algorithm (19, 20), multitask logistic regression (MTLR) algorithm (21, 22), and Cox survival regression algorithm (23, 24). The important packages included pec, rms, survival, rmda, ggplot2, GOplot, timereg, randomForestSRC, and riskRegression. The threshold for a statistically significant difference was a P < 0.05.
The clinical information of the OC patients is shown in Table 1. There were 229 (61.9%) of 370 patients who died in the TCGA cohort (validation dataset), and 260 (61.9%) of 420 patients died in the GEO cohort (model dataset). As shown in Table 1, there was no significant difference regarding mortality, survival time of deceased patients, or grade between the modelling cohort and the validation cohort during the follow-up period (P > 0.05). The overall survival time of all patients and the survival time of the patients in the survival subgroup for the model dataset were significantly longer than those of the validation dataset. However, the survival time of patients in the death subgroup of the model dataset was shorter than that of the patients in the death subgroup of the validated dataset, indicating that the difference in survival time between the two datasets might be related to the longer follow-up time of patients in the GEO cohort (model dataset).
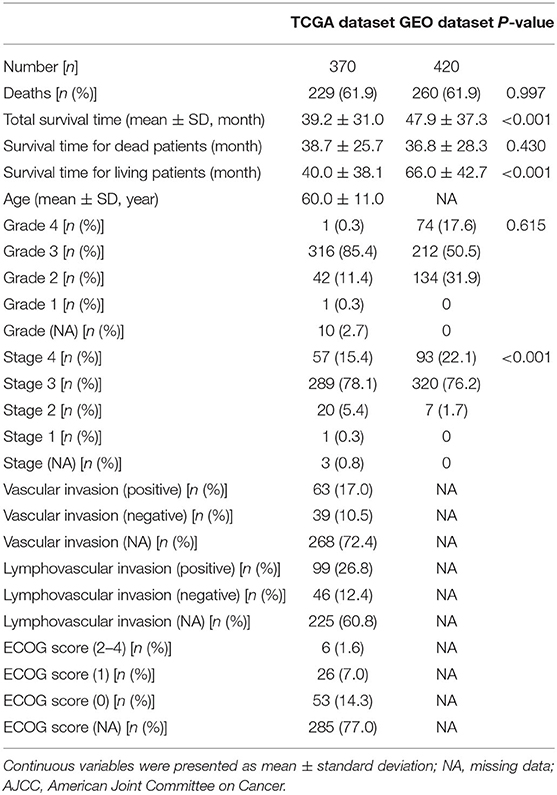
Table 1. Clinical features of included patients.
Volcano plots of 13,216 mRNAs and 3,075 immune genes are shown in Figures 1A,B. With a threshold of log2 |fold change| > 1 and P < 0.05, differential expression analysis identified 779 upregulated and 528 downregulated mRNAs from 13,216 mRNAs (Figure 1A) between 185 tumour samples and 10 normal samples (GSE26712 dataset). Differential expression analysis further identified 194 upregulated and 143 downregulated immune mRNAs from 3,075 immune mRNAs (Figure 1B) between 185 tumour samples and 10 normal samples in the GSE26712 dataset.
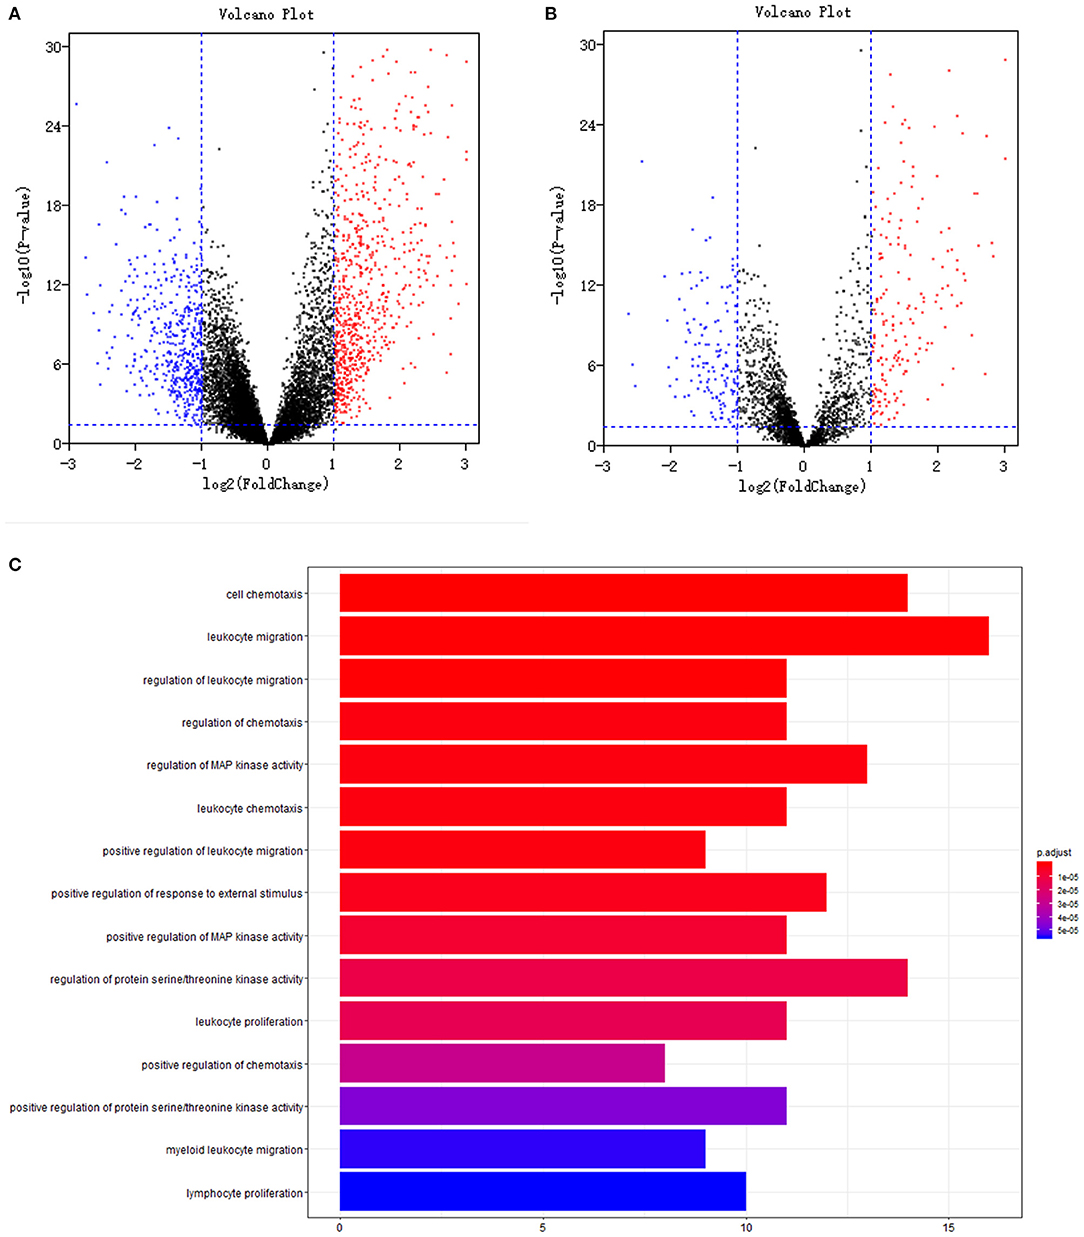
Figure 1. Differentially expression and functional enrichment: (A). Volcano plot of all genes; (B). Volcano plot of immune genes; (C). Barplot chart of immune genes. The depth of the color represents different P-values; The length of the band represents the number of enriched genes.
To explore the gene expression difference of the identified immune biomarkers between the patients who died among the remaining patients with respect to the year of death, we further performed differential expression analysis between 130 tumour samples of patients who died and 10 normal samples of living patients (GSE26712 dataset). Differential expression analysis identified 753 upregulated and 526 downregulated mRNAs from 13,216 mRNAs. Differential expression analysis further identified 190 upregulated and 137 downregulated immune mRNAs from 3,075 immune mRNAs in the GSE26712 dataset.
Further univariate Cox regression identified 84 prognostic immune gene biomarkers for OC patients in the model dataset (GSE32062 dataset and GSE53963 dataset). The bar plot (Figure 1C) and Gene Ontology chord chart (Figure 2) showed that the biological processes of the previous 84 prognostic immune genes were mainly enriched in leukocyte migration, cell chemotaxis, regulation of protein serine/threonine kinase activity, regulation of MAP kinase activity, positive regulation of response to external stimulus, regulation of leukocyte migration, regulation of chemotaxis, leukocyte chemotaxis, positive regulation of MAP kinase activity, and leukocyte proliferation. The results of the bar plot and Gene Ontology chord chart suggested that the above biological processes might play a role in the occurrence, growth, invasion, and prognosis of ovarian cancer, and the underlying mechanism is worthy of further study.
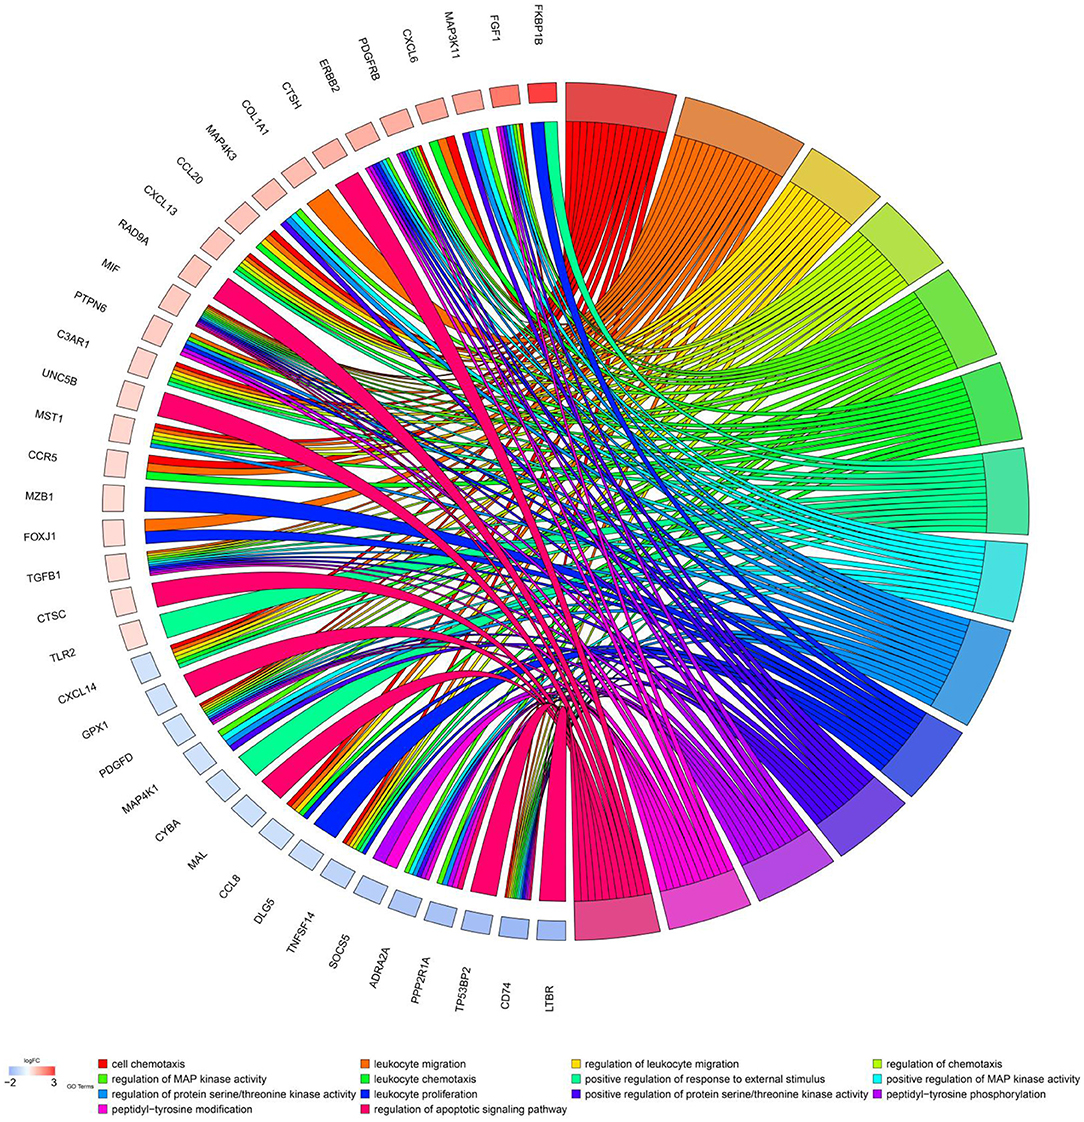
Figure 2. Chord chart of prognostic genes. Biological processes of previous 84 prognostic immune genes were mainly enriched in cell chemotaxis, leukocyte migration, regulation of protein serine/threonine kinase activity, regulation of MAP kinase activity, positive regulation of response to external stimulus, regulation of leukocyte migration, regulation of chemotaxis, leukocyte chemotaxis, positive regulation of MAP kinase activity, and leukocyte proliferation.
Univariate Cox regression identified 84 prognostic immune biomarkers for the OS of OC patients. Transcription factors that were highly correlated with prognostic immune mRNAs were identified with previous correlation analysis thresholds. To explore the potential regulatory relationships among these immune genes, these previous prognostic immune mRNAs and their highly correlated transcription factors were placed in the STRING database with confidence values of 0.90. Thus, a regulatory network involving 63 immune genes and 5 transcription factors was constructed by using Cytoscape v3.6.1 (Figure 3). As shown in Figure 3, IRF4, GATA4, GATA3, CIITA, and MYH11 were involved in the immune regulatory network, indicating that these five transcription factors might play a role in the immune microenvironment of ovarian cancer.
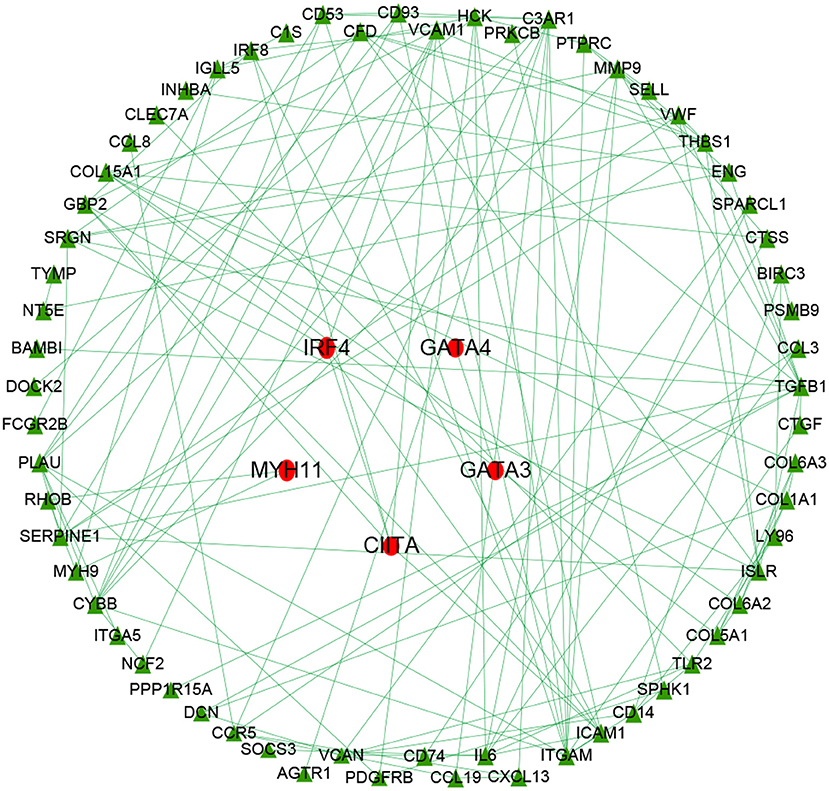
Figure 3. Immune gene regulatory network chart. The immune regulatory network involved 63 immune genes and 5 transcription factors. IRF4, GATA4, GATA3, CIITA, and MYH11 were involved in the immune regulatory network, indicating these transcription factors might play a role in the immune microenvironment of ovarian cancer.
Multivariate Cox regression identified fourteen independent prognostic mRNAs for OS (Table 2 and Figure 4), indicating that these 14 prognostic immune genes might be more closely related to the prognosis of ovarian cancer than the prognostic immune genes that were not included in multivariate Cox regression. The formula of the prognostic model based on multivariate Cox regression was as follows: prognostic score = (-0.472*PSMB9) + (-0.268*FOXJ1) + (0.303*IFT57) + (0.095*MAL) + (0.357*ANXA4) + (-0.339*CTSH) + (0.422*SCRN1) + (-0.301*MIF) + (0.515*LTBR) + (-0.371*CTSD) + (0.503*KIFAP3) + (0.574*PSMB8) + (0.485*HSPA5) + (0.463*LTN1). A prognostic nomogram is shown in Figure 5. For each prognostic gene, different gene expression values were assigned different risk scores. The total points (overall risk score) of one patient were obtained by adding up the risk scores of 14 prognostic genes. Through the vertical line corresponding to the total points, we can obtain the corresponding mortality rate of individual patients at different times.
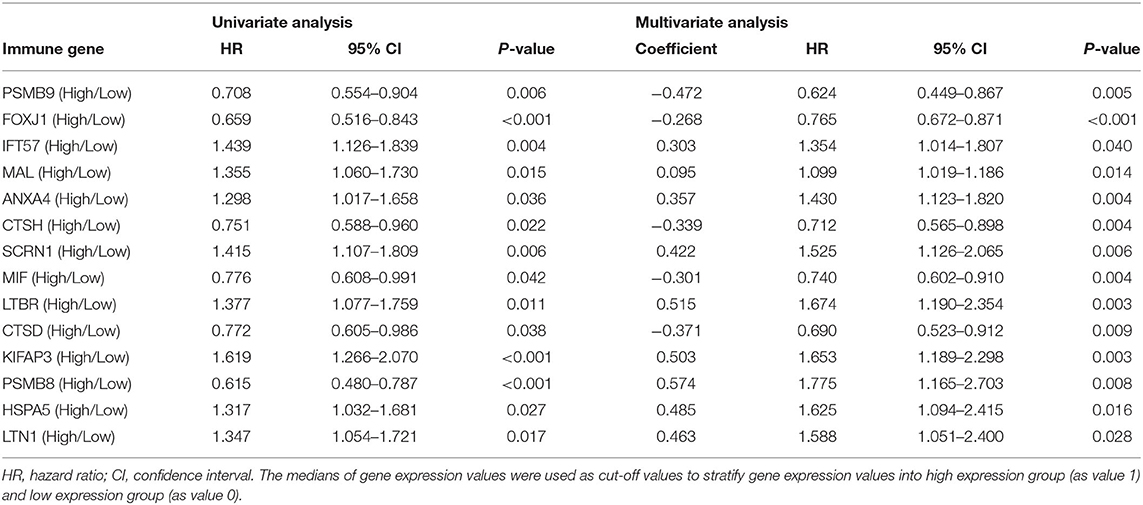
Table 2. Information of prognostic immune genes.
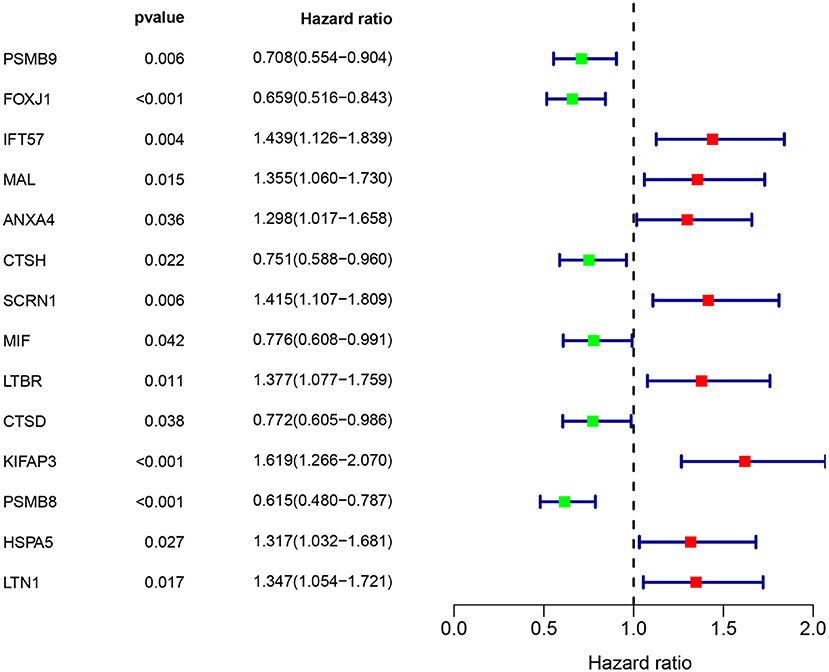
Figure 4. Immune gene survival forest chart. Eight immune factors (IFT57, MAL, ANXA4, SCRN1, LTBR, KIFAP3, HSPA5, and LTN1) were positively correlated with poor prognosis of ovarian cancer, whereas six immune factors (PSMB9, FOXJ1, CTSH, MIF, CTSD, and PSMB8) were negatively correlated with poor prognosis of ovarian cancer.
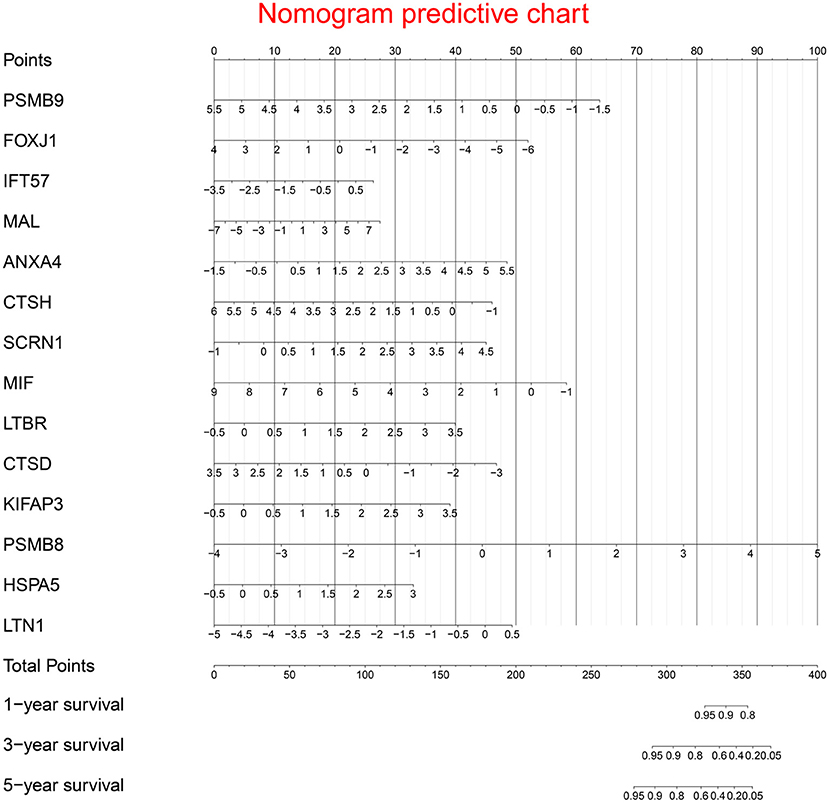
Figure 5. Prognostic nomogram chart. For each prognostic gene, different gene expression values were assigned different risk scores. The total point (overall risk score) of one patient was obtained by adding up the risk scores of 14 prognostic genes. Through the vertical line corresponding to the total point, we can obtain the corresponding mortality rate of individual patient at different times.
Supplementary Figure 2 shows significant differences in survival curves between the high-risk group and the low-risk group. Eight immune factors (IFT57, MAL, ANXA4, SCRN1, LTBR, KIFAP3, HSPA5, and LTN1) were positively correlated with poor prognosis of ovarian cancer, whereas six immune factors (PSMB9, FOXJ1, CTSH, MIF, CTSD, and PSMB8) were negatively correlated with poor prognosis of ovarian cancer. Supplementary Figures 3, 4 show the predictive value distribution chart and the survival status scatter plot.
Survival curves of the two groups are illustrated in Figure 6A, showing that the mortality rate in the high-risk group was significantly higher than that in the low-risk group. Concordance indexes were 0.760, 0.733, and 0.765 for 1-, 3-, and 5-year survival, respectively (Figure 6B), indicating that the prognostic model has good predictive value for the prognosis of OC patients. Supplementary Figure 5 shows the calibration curves of the model cohort, showing that there was good consistency between the predicted mortality rate and the actual mortality rate.

Figure 6. Clinical performance in model cohort: (A). Survival curves for high risk group and low risk group; (B). Time-dependent receiver operating characteristic curves. The mortality rate in the high risk group was significantly higher than that in the low risk group. Concordance indexes were 0.760, 0.733, and 0.765 for 1-, 3-, and 5-year survival, indicating that the prognostic model has a good predictive value for the prognosis of ovarian cancer patients.
Survival curves of the two groups are illustrated in Figure 7A, showing that the mortality rate in the high-risk group was significantly higher than that in the low-risk group. Concordance indexes were 0.860, 0.715, and 0.679 for 1-, 3-, and 5-year survival, respectively (Figure 7B), indicating that the prognostic model has good predictive value for the prognosis of OC patients. Supplementary Figure 6 shows calibration curves of the validation cohort. Supplementary Figure 7 shows decision curves for 1-, 3-, and 5-year survival, showing that there was consistency between the predicted mortality rate and the actual mortality rate.
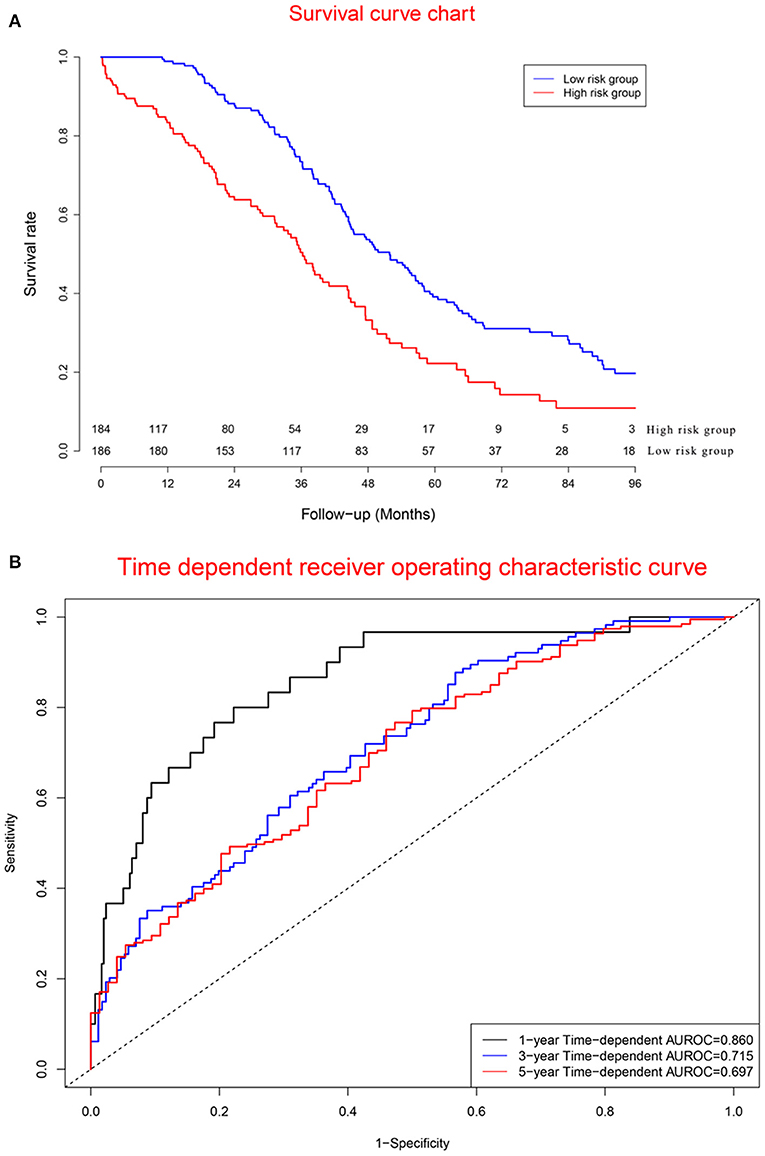
Figure 7. Clinical performance in validation cohort: (A). Survival curves for high risk group and low risk group; (B). Time-dependent receiver operating characteristic curves. The mortality rate in the high risk group was significantly higher than that in the low risk group. Concordance indexes were 0.860, 0.715, and 0.679 for 1-, 3-, and 5-year survival, respectively (B), indicating that the prognostic model has a good predictive value for the prognosis of ovarian cancer patients.
An artificial intelligence survival prediction system was constructed for individual mortality risk prediction for OC patients (Figure 8) and is available at https://zhangzhiqiao8.shinyapps.io/Smart_Cancer_Survival_Predictive_System_17_OC_F1001/. After the user inputs the expression values of the prognostic genes and clicks the “predict” button, the survival curve of one individual patient during the follow-up period will be presented.
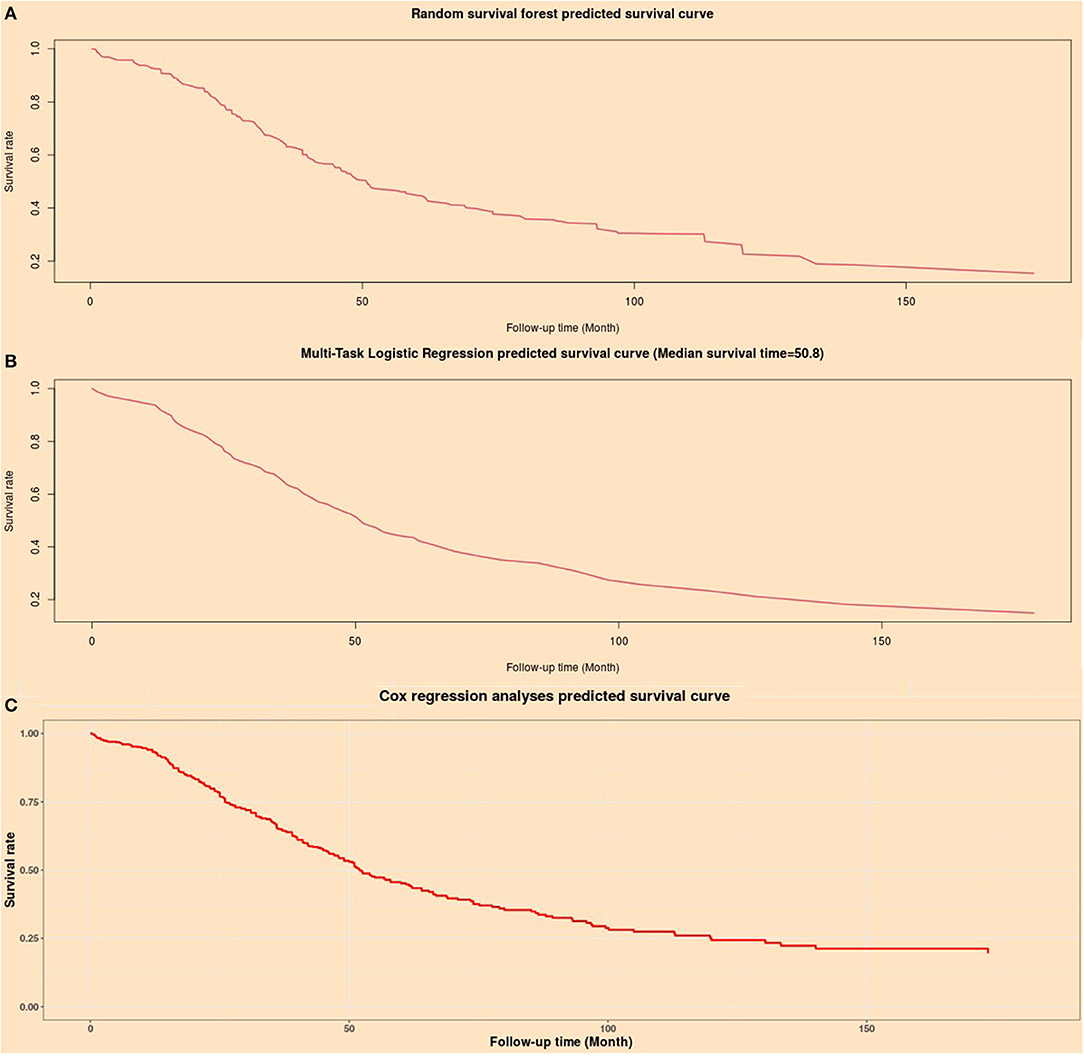
Figure 8. Individual mortality risk predictive curves based on artificial intelligence algorithms. (A) Random survival forest model; (B) Multitask logistic regression model; (C) Cox proportional hazard regression model.
The artificial intelligence survival prediction system provides three individual mortality risk predictive curves based on artificial intelligence algorithms: the RFS model (Figure 8A), MTLR model (Figure 8B), and Cox model (Figure 8C).
A Gene Survival Analysis Screen System was constructed for exploratory research of immune genes (Supplementary Figure 8) and is available at https://zhangzhiqiao8.shinyapps.io/Gene_Survival_Subgroup_Analysis_17_OC_F1001/. After the user inputs the parameters and clicks the “survival curve analysis” button, the survival curves of the high-risk group and low-risk group are presented. Users can obtain hazard ratio values of different clinical parameters after clicking the “Univariate Cox survival analysis table” button in the Gene Survival Analysis Screen System.
We used multivariate Cox regression to explore the independent effect of the prognostic model on the prognosis of OC patients. The prognostic signature was an independent influencing factor for OS in the model cohort (Table 3). In the validation cohort, the prognostic signature was an independent risk factor for OS. The results of multivariate Cox regression showed that the prognostic model had an independent effect on the prognosis of ovarian cancer, which further supported the value of the prognostic model in predicting ovarian cancer prognosis.
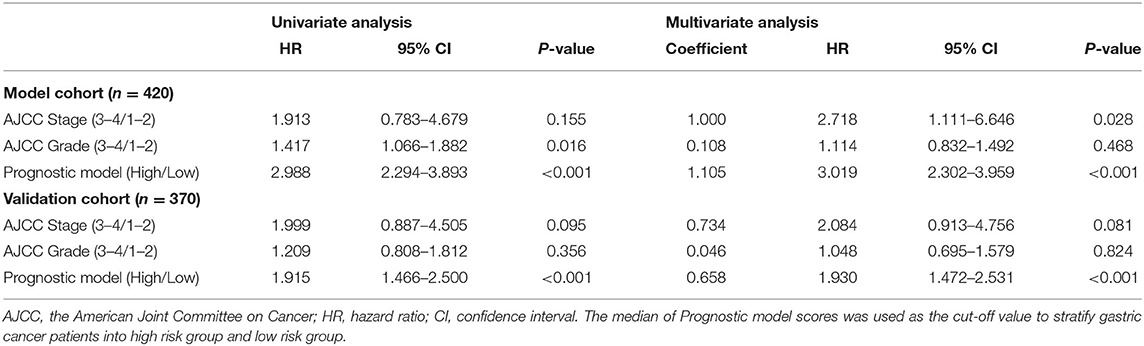
Table 3. Results of Cox regression analyses.
The current study identified 1,307 differentially expressed genes and 337 differentially expressed immune genes between tumour samples and normal samples. Further univariate Cox regression identified 84 prognostic immune gene biomarkers for OC patients in the model dataset (GSE32062 dataset and GSE53963 dataset). An immune regulatory network was depicted involving 63 immune genes and 5 transcription factors. Through bioinformatics research, the current study depicted potential regulatory relationships among immune genes and transcription factors. Fourteen immune genes were identified as independent prognostic factors by multivariate survival analysis. Kaplan-Meier survival curves showed that these 14 prognostic genes were closely related to the prognosis of ovarian cancer patients. These 14 prognostic genes were used to develop a prognostic nomogram for ovarian cancer. Moreover, two artificial intelligence predictive tools were developed for precise individual mortality risk prediction in ovarian cancer. Based on a random survival forest algorithm, a multitask logistic regression algorithm, and a Cox survival regression algorithm, the current artificial intelligence survival predictive system provided three individual mortality risk predictive curves for the evaluation and improvement of individualised medical decisions.
In the current study, 1,308 differentially expressed genes (including 337 differential immune genes) were identified by differential expression analysis. Compared with normal ovarian tissues, these differentially expressed genes showed high expression or low expression in tumour tissues, suggesting that these differentially expressed genes might be related to the biological characteristics and clinical process of OC. Further univariate Cox and multivariate Cox regression analyses identified 84 and 14 prognostic immune genes, respectively, suggesting that these 14 prognostic immune genes might be closely related to the prognosis of OC patients. Functional enrichment analysis showed that the 84 genes were mainly related to the regulation of immune inflammation and were enriched in leukocyte migration, cell chemotaxis, regulation of protein serine/threonine kinase activity, and regulation of MAP kinase activity.
The immune regulatory network further indicated the potential regulatory relationship among 63 immune genes and 5 transcription factors, suggesting that these immune genes and transcription factors might play a potential role in the regulatory mechanism of the tumour immune environment. Previous studies have provided supporting evidence for the potential mechanisms of these five transcription factors regarding tumour growth, progression and prognosis. There is a close relationship between GATA3 and poor prognosis of high-grade serous ovarian carcinoma (25). GATA3 positivity is associated with poor prognosis of pancreatic ductal adenocarcinoma (26). High expression of GATA3 is associated with good prognosis of ER+ breast cancer (27). IRF4 might activate the Notch-Akt signalling pathway in non-small cell lung cancer (28). Higher expression of IRF4+ Tregs was related to poor prognosis for different cancers (29). IRF4 was an independent prognostic factor for node-negative breast cancer (30). MYH11 positively modulated the immune-related gene GLP2R in colon adenocarcinoma (31). MYH11 positively regulated GSTM5, PTGIS, ENPP2, and P4HA3 (32). GATA4 inhibits tumour growth by affecting the assembly of tumour suppressor enhancement modules (33). Overexpression of GATA4 can protect human granulosa cell tumours from apoptosis induced by TRAIL in vitro (34).
Different research teams have established valuable survival prediction models for ovarian cancer based on different research cohorts and modelling methods. Previous prognostic models provided mortality curves for two classes of patients with different clinical characteristics (7, 8) but did not provide mortality curves for individual patients. He et al. constructed a prognostic model based on 10 RNA-binding proteins for ovarian cancer (35). However, the calculation formula of this model is so complex that it is difficult for patients to calculate their personal risk score. Bing et al. constructed a novel model by merging three previous models selected by the integrated P-value method, providing a new idea for the establishment of a prognostic model (36). However, this theoretically feasible method has not been applied in clinical research because it involves the fusion of multiple prognostic models. Tang et al. presented an eight-mRNA prognostic model for ovarian cancer (37), providing a valuable predictive model for clinical practise. If the above models can provide a simple calculation tool, it will be more helpful to provide convenient survival prediction information for patients with ovarian cancer. In fact, every cancer patient cares only for her or his own individual mortality after diagnosis. Due to the considerable clinical heterogeneity of tumours, clinicians observe large differences in clinical prognosis among different cancer patients. Therefore, it is of great significance to predict the individual mortality risk of cancer patients. The emergence of big data and advanced algorithms has laid a solid foundation for artificial intelligence research. Different artificial intelligence algorithms have been used to improve clinical diagnosis and prognostic prediction (11–13). Based on the artificial intelligence algorithms provided in previous studies, the current study developed an artificial intelligence survival prediction system. The current artificial intelligence survival prediction system provides three individual mortality risk predictive curves according to different artificial intelligence algorithms. These artificial intelligence algorithms are not widely used in clinical research because of the complexity of calculation. To the best of our knowledge, our team is the first to introduce various artificial intelligence algorithms for tumour prognosis research. Our study showed that artificial intelligence algorithms have great application value and superiority in predicting the individual mortality risk for cancer patients and are worth further research and application. The tumour immune microenvironment is reportedly related to oncogenesis and prognosis (7, 38). The current study revealed the potential association of tumour-infiltrating immune cells and immune genes with tumour prognosis. Compared with several previous predictive models for the prognosis of OC patients (14, 39), our precision medical predictive tools were more valuable in providing individual mortality risk prediction at different time points.
The TISIDB database was used to explore the biological processes of immune genes. The top biological processes of proteasome subunit beta 9 (PSMB9) were immune response-activating signal transduction, the immune response-regulating signalling pathway, and the immune response-activating cell surface receptor signalling pathway. The top biological processes of Forkhead box J1 (FOXJ1) were adaptive immune responses, leucocyte-mediated immunity, humoural immune response mediated by circulating immunoglobulin, and lymphocyte-mediated immunity. The top biological processes of mal, T-cell differentiation protein (MAL) were the extrinsic apoptotic signalling pathway via death domain receptors, regulation of apoptotic signalling pathway, and the extrinsic apoptotic signalling pathway. The top biological processes of annexin A4 (ANXA4) were interleukin-8 production, regulation of interleukin-8 production, and negative regulation of interleukin-8 production. The top biological processes of cathepsin H (CTSH) were T cell-mediated immunity, lymphocyte-mediated immunity, leucocyte-mediated immunity, and adaptive immune response. The top biological processes of macrophage migration inhibitory factor (MIF) were negative regulation of immune system process, B cell homeostasis, regulation of immune effect or process, and lymphocyte homeostasis. The top biological processes of lymphotoxin beta receptor (LTBR) were myeloid dendritic cell activation, leucocyte differentiation, response to tumour necrosis factor, and response to molecules of bacterial origin. The top biological processes of cathepsin D (CTSD) were autophagy, antigen processing and presentation of exogenous antigen, antigen processing and presentation of exogenous peptide antigen via MHC class II. The top biological processes of kinesin-associated protein 3 (KIFAP3) were antigen processing and presentation, antigen processing and presentation of peptide antigen via MHC class II, and antigen processing and presentation of exogenous antigen. The top biological processes of proteasome subunit beta 8 (PSMB8) were immune response-activating signal transduction, innate immune response-activating signal transduction, and the immune response-regulating cell surface receptor signalling pathway.
PSMB9, FOXJ1, IFT57, MAL, ANXA4, CTSH, SCRN1, MIF, LTBR, CTSD, KIFAP3, PSMB8, HSPA5, and LTN1 were recognised as independent risk factors by multivariate Cox analyses, suggesting that these 14 prognostic immune genes might have potential effects on the occurrence, progression and prognosis of tumours. NANOG controls cell migration and invasion by regulating FOXJ1 expression in ovarian cancer (15). FOXJ1 promoted tumour growth in bladder cancer (16). Highly expressed FOXJ1 promoted the proliferation and invasiveness of laryngeal squamous cell carcinoma cells (17). High expression of MAL was associated with poor survival of advanced ovarian cancer (40). Overexpression of the MAL gene was used to predict chemoresistance and poor prognosis in serous ovarian cancer patients (18). High expression of MAL promoted metastasis in colorectal cancer (24). Ikaros inhibited the proliferation of tumour cells by downregulating the expression of ANXA4 in hepatocellular carcinoma (23). Knockdown of SCRN1 significantly reduced tumour cell growth in colorectal cancer (19). EIF expression was associated with overall survival in patients with ovarian cancer (20). The KIFAP3 gene is highly expressed at the mRNA and protein levels in breast cancer (41). miR-451a inhibited cancer growth and induced apoptosis of papillary thyroid cancer by targeting PSMB8 (41). The CpG mutation of PSMB9 is related to the recurrence or drug resistance of ovarian cancer after chemotherapy (42). High expression of PSMB8 and PSMB9 is related to the five-year survival of ovarian cancer (43). High expression of MIF is correlated with poor overall survival of ovarian cancer (44). HSPA5 inhibits the growth of epithelial ovarian cancer cells through G1 phase arrest (45). High expression of CD5L promoted proliferation and the antiapoptotic response in hepatocellular carcinoma cells by binding to HSPA5 (46).
CD4 T helper cells can inhibit the transformation of immunosuppressive regulatory T cells in ovarian cancer (41). Regulatory T cells were positively correlated with ovarian cancer (20). An increased CD8/regulatory T cell ratio suggests good prognosis for ovarian cancer (47). Dendritic cell immunotherapy could stimulate antitumour T cell immunity and improve the prognosis of cancer patients (21). Interleukin 10 regulates Toll-like receptor-mediated dendritic cell activation in ovarian cancer (22). IL-15 enhanced natural killer cell function in ovarian cancer patients (13). A low lymphocyte-to-monocyte ratio was related to poor survival in ovarian cancer (48). Mast cell infiltration with high mean vessel density indicated favourable prognosis in ovarian cancer (49). Macrophage secretory proteins induce ovarian cancer proliferation through the JAK2/STAT3 pathway (50). M1 macrophages induce ovarian cancer cell metastasis through the activation of NF-κB (51). Small extracellular vesicles could inhibit the T cell response and promote the growth of ovarian cancer cells (51). Artesunate induced apoptosis of ovarian cancer cells by microRNA-142 (52). Mature neutrophils inhibited T cell immunity in ovarian cancer patients (50). Regulatory T cells inhibit CD8 T cell function through the IL-10 pathway (53). ISG15 induced CD8 T cells and inhibited the progression of ovarian cancer (54). TGF-beta 1 induces CD8 Tregs through the p38 MAPK pathway in ovarian cancer (55). CD4 T helper cells inhibit the transformation of immunosuppressive regulatory T cells (56). CD4 T cells induce the host immune response through dendritic cells in patients with MHC class II-negative ovarian cancer (57).
Advantages: First, the current study developed two artificial intelligence predictive tools that provided individual mortality risk prediction at different time points and were valuable for optimising individual treatment decisions. Second, the current artificial intelligence survival predictive system provided three individual mortality risk predictive curves based on three artificial intelligence algorithms. Different artificial intelligence algorithms provided more reliable and valuable prognostic predictions for ovarian cancer than conventional prognostic models.
Shortcomings: First, because study datasets from public databases did not include information on surgical treatment, radiotherapy, biological targeting therapy, etc., the current study failed to assess the impact of these important clinical variables on survival. Second, from the perspective of model validity and extensibility, the sample size of the current research was relatively small for prognosis, which might weaken the validity of the research conclusions. Large, prospective sample studies can provide more convincing clinical evidence for the current study. Third, as non-parametric algorithms, artificial intelligence algorithms are complex to perform, and their calculation processes cannot be expressed by simple equations, restricting artificial intelligence algorithms as the mainstream methods for prognostic studies. Fourth, the current study constructed an immune regulatory network and revealed potential regulatory associations among immune genes and transcription factors. However, the role and mechanism of immune genes and transcription factors in tumorigenesis, growth and prognosis need to be elucidated by further study.
In conclusion, the current study identified 1,307 differentially expressed genes and 337 differentially expressed immune genes in ovarian cancer patients. Multivariate Cox analyses identified fourteen prognostic immune biomarkers for ovarian cancer. The current study constructed an immune regulatory network involving 63 immune genes and 5 transcription factors, revealing potential regulatory associations among immune genes and transcription factors. The current study developed a prognostic model to predict the prognosis of ovarian cancer patients. The current research further developed two artificial intelligence predictive tools for ovarian cancer, which are available at https://zhangzhiqiao8.shinyapps.io/Smart_Cancer_Survival_Predictive_System_17_OC_F1001/ and https://zhangzhiqiao8.shinyapps.io/Gene_Survival_Subgroup_Analysis_17_OC_F1001/. The artificial intelligence survival predictive system can improve individualised treatment decision-making.
The original contributions presented in the study are included in the article/Supplementary Material, further inquiries can be directed to the corresponding author/s.
Ethical review and approval was not required for the study on human participants in accordance with the local legislation and institutional requirements. Written informed consent for participation was not required for this study in accordance with the national legislation and the institutional requirements.
ZZ, TH, PW, JL, and LH: conceptualisation, methodology, resources, investigation, data curation, formal analysis, validation, software, project administration, and supervision. ZZ and PW: writing and visualisation. ZZ: funding acquisition. All authors contributed to the article and approved the submitted version.
The current research was funded by the Medical Science and Technology Foundation of Guangdong Province (A2016450 and B2018237).
The authors declare that the research was conducted in the absence of any commercial or financial relationships that could be construed as a potential conflict of interest.
We would like to thank Dr. Gary S. Collins (University of Oxford), Dr. Manali Rupji (Emory University), and Mrs. Qingmei Liu for help and support in the development of precision medicine tools.
The Supplementary Material for this article can be found online at: https://www.frontiersin.org/articles/10.3389/fmed.2021.587496/full#supplementary-material
OC, ovarian cancer; TCGA, The Cancer Genome Atlas; GEO, Gene Expression Omnibus; ROC, receiver operating characteristic; DFS, disease-free survival; HR, hazard ratio; CI, confidence interval; AJCC, American Joint Committee on Cancer; SD, standard deviation.
1. Bray F, Ferlay J, Soerjomataram I, Siegel RL, Torre LA, Jemal A. Global cancer statistics 2018: GLOBOCAN estimates of incidence and mortality worldwide for 36 cancers in 185 countries. CA Cancer J Clin. (2018) 68:394–424. doi: 10.3322/caac.21492
2. Arnold M, Sierra MS, Laversanne M, Soerjomataram I, Jemal A, Bray F. Global patterns and trends in colorectal cancer incidence and mortality. Gut. (2017) 66:683–91. doi: 10.1136/gutjnl-2015-310912
3. Zeng J, Cai X, Hao X, Huang F, He Z, Sun H, et al. LncRNA FUNDC2P4 down-regulation promotes epithelial-mesenchymal transition by reducing E-cadherin expression in residual hepatocellular carcinoma after insufficient radiofrequency ablation. Int J Hyperthermia. (2018) 34:802–11. doi: 10.1080/02656736.2017.1422030
4. Zhong X, Long Z, Wu S, Xiao M, Hu W. LncRNA-SNHG7 regulates proliferation, apoptosis and invasion of bladder cancer cells assurance guidelines. J BUON. (2018) 23:776–81.
5. Shi X, Zhao Y, He R, Zhou M, Pan S, Yu S, et al. Three-lncRNA signature is a potential prognostic biomarker for pancreatic adenocarcinoma. Oncotarget. (2018) 9:24248–59. doi: 10.18632/oncotarget.24443
6. Huang Y, Xiang B, Liu Y, Wang Y, Kan H. LncRNA CDKN2B-AS1 promotes tumor growth and metastasis of human hepatocellular carcinoma by targeting let-7c-5p/NAP1L1 axis. Cancer Lett. (2018) 437:56–66. doi: 10.1016/j.canlet.2018.08.024
7. Pagès F, Galon J, Dieu-Nosjean MC, Tartour E, Sautès-Fridman C, Fridman WH. Immune infiltration in human tumors: a prognostic factor that should not be ignored. Oncogene. (2010) 29:1093–102. doi: 10.1038/onc.2009.416
8. Domingues P, González-Tablas M, Otero, Pascual D, Miranda D, Ruiz L, et al. Tumor infiltrating immune cells in gliomas and meningiomas. Brain Behav Immun. (2016) 53:1–5. doi: 10.1016/j.bbi.2015.07.019
9. Zhang Z, Li J, He T, Ouyang Y, Huang Y, Liu Q, et al. The competitive endogenous RNA regulatory network reveals potential prognostic biomarkers for overall survival in hepatocellular carcinoma. Cancer Sci. (2019) 110:2905–23. doi: 10.1111/cas.14138
10. Zhang Z, Ouyang Y, Huang Y, Wang P, Li J, He T, et al. Comprehensive bioinformatics analysis reveals potential lncRNA biomarkers for overall survival in pat ients with hepatocellular carcinoma: an on-line individual risk calculator based on TCGA cohort. Cancer Cell Int. (2019) 19:174. doi: 10.1186/s12935-019-0890-2
11. Tran WT, Jerzak K, Lu FI, Klein J, Tabbarah S, Lagree A, et al. Personalized breast cancer treatments using artificial intelligence in radiomics and pathomics. J Med Imaging Radiat Sci. (2019) 50(Suppl. 2):S32–41. doi: 10.1016/j.jmir.2019.07.010
12. Nir G, Karimi D, Goldenberg SL, Fazli L, Skinnider BF, Tavassoli P, et al. Comparison of artificial intelligence techniques to evaluate performance of a classifier for automatic grading of prostate cancer from digitized histopathologic images. JAMA Netw Open. (2019) 2:e190442. doi: 10.1001/jamanetworkopen.2019.0442
13. Enshaei A, Robson CN, Edmondson RJ. Artificial intelligence systems as prognostic and predictive tools in ovarian cancer. Ann Surg Oncol. (2015) 22:3970–75. doi: 10.1245/s10434-015-4475-6
14. Robinson MD, McCarthy DJ, Smyth GK. edgeR: a Bioconductor package for differential expression analysis of digital gene expression data. Bioinformatics. (2010) 26:139–40. doi: 10.1093/bioinformatics/btp616
15. Bhattacharya S, Andorf S, Gomes L, Dunn P, Schaefer H, Pontius J, et al. ImmPort: disseminating data to the public for the future of immunology. Immunol Res. (2014) 58:234–9. doi: 10.1007/s12026-014-8516-1
16. Mei S, Meyer CA, Zheng R, Qin Q, Wu Q, Jiang P, et al. Cistrome cancer: a web resource for integrative gene regulation modeling in cancer. Cancer Res. (2017) 77:e19–22. doi: 10.1158/0008-5472.CAN-17-0327
17. Jia Q, Wu W, Wang Y, Alexander PB, Sun C, Gong Z, et al. Local mutational diversity drives intratumoral immune heterogeneity in non-small cell lung cancer. Nat Commun. (2018) 9:5361. doi: 10.1038/s41467-018-07767-w
18. Charoentong P, Finotello F, Angelova M, Mayer C, Efremova M, Rieder D, et al. Pan-cancer immunogenomic analyses reveal genotype-immunophenotype relationships and predictors of response to checkpoint blockade. Cell Rep. (2017) 18:248–62. doi: 10.1016/j.celrep.2016.12.019
19. Xu H, Gu X, Tadesse MG, Balasubramanian R. A modified random survival forests algorithm for high dimensional predictors and self-reported outcomes. J Comput Graph Stat. (2018) 27:763–72. doi: 10.1080/10618600.2018.1474115
20. Nasejje JB, Mwambi H. Application of random survival forests in understanding the determinants of under-five child mortality in Uganda in the presence of covariates that satisfy the proportional and non-proportional hazards assumption. BMC Res Notes. (2017) 10:459. doi: 10.1186/s13104-017-2775-6
21. Alaeddini A, Hong SH. A multi-way multi-task learning approach for multinomial logistic regression*. An application in joint prediction of appointment miss-opportunities across multiple clinics. Methods Inform Med. (2017) 56:294–307. doi: 10.3414/ME16-01-0112
22. Bisaso KR, Karungi SA, Kiragga A, Mukonzo JK, Castelnuovo B. A comparative study of logistic regression based machine learning techniques for prediction of early virological suppression in antiretroviral initiating HIV patients. BMC Med Inform Decis Mak. (2018) 18:77. doi: 10.1186/s12911-018-0659-x
23. Katzman JL, Shaham U, Cloninger A, Bates J, Jiang T, Kluger Y. DeepSurv: personalized treatment recommender system using a Cox proportional hazards deep neural network. BMC Med Res Methodol. (2018) 18:24. doi: 10.1186/s12874-018-0482-1
24. Fisher LD, Lin DY. Time-dependent covariates in the Cox proportional-hazards regression model. Ann Rev Public Health. (1999) 20:145–57. doi: 10.1146/annurev.publhealth.20.1.145
25. El-Arabey AA, Denizli M, Kanlikilicer P, Bayraktar R, Ivan C, Rashed M, et al. GATA3 as a master regulator for interactions of tumor-associated macrophages with high-grade serous ovarian carcinoma. Cell Signal. (2020) 68:109539. doi: 10.1016/j.cellsig.2020.109539
26. Agostini-Vulaj D, Bratton LE, Dunne RF, Cates JMM, Zhou Z, Findeis-Hosey JJ, et al. Incidence and significance of GATA3 positivity in pancreatic ductal adenocarcinoma and cholangiocarcinoma. Appl Immunohistochem Mol Morphol. (2020) 28:460–63. doi: 10.1097/PAI.0000000000000764
27. Fararjeh AS, Tu SH, Chen LC, Liu YR, Lin YK, Chang HL, et al. The impact of the effectiveness of GATA3 as a prognostic factor in breast cancer. Hum Pathol. (2018) 80:219–30. doi: 10.1016/j.humpath.2018.06.004
28. Qian Y, Du Z, Xing Y, Zhou T, Chen T, Shi M. Interferon regulatory factor 4 (IRF4) is overexpressed in human non-small cell lung cancer (NSCLC) and activates the Notch signaling pathway. Mol Med Rep. (2017) 16:6034–40. doi: 10.3892/mmr.2017.7319
29. Alvisi G, Brummelman J, Puccio S, Mazza EM, Tomada EP, Losurdo A, et al. IRF4 instructs effector Treg differentiation and immune suppression in human cancer. J Clin Investig. (2020) 130:3137–50. doi: 10.1172/JCI130426
30. Heimes AS, Madjar K, Edlund K, Battista MJ, Almstedt K, Gebhard S, et al. Prognostic significance of interferon regulating factor 4 (IRF4) in node-negative breast cancer. J Cancer Res Clin Oncol. (2017) 143:1123–31. doi: 10.1007/s00432-017-2377-7
31. Sun YL, Zhang Y, Guo YC, Yang ZH, Xu YC. A prognostic model based on the immune-related genes in colon adenocarcinoma. Int J Med Sci. (2020) 17:1879–96. doi: 10.7150/ijms.45813
32. Sun YL, Zhang Y, Guo YC, Yang ZH, Xu YC. A prognostic model based on six metabolism-related genes in colorectal cancer. Biomed Res Int. (2020) 2020:5974350. doi: 10.1155/2020/5974350
33. Lu F, Zhou Q, Liu L, Zeng G, Ci W, Liu W, et al. A tumor suppressor enhancing module orchestrated by GATA4 denotes a therapeutic opportunity for GATA4 deficient HCC patients. Theranostics. (2020) 10:484–97. doi: 10.7150/thno.38060
34. Kyrönlahti A, Kauppinen M, Lind E, Unkila-Kallio L, Butzow R, Klefström J, et al. GATA4 protects granulosa cell tumors from TRAIL-induced apoptosis. Endocr Relat Cancer. (2010) 17:709–17. doi: 10.1677/ERC-10-0041
35. He C, Huang F, Zhang K, Wei J, Hu K, Liang M. Establishment and validation of an RNA binding protein-associated prognostic model for ovarian cancer. J Ovarian Res. (2021) 14:27. doi: 10.1186/s13048-021-00777-1
36. Bing Z, Yao Y, Xiong J, Tian J, Guo X, Li X, et al. Novel model for comprehensive assessment of robust prognostic gene signature in ovarian cancer across different independent datasets. Front Genet. (2019) 10:931. doi: 10.3389/fgene.2019.00931
37. Tang W, Li J, Chang X, Jia L, Tang Q, Wang Y, et al. Construction of a novel prognostic-predicting model correlated to ovarian cancer. Biosci Rep. (2020) 40:BSR20201261. doi: 10.1042/BSR20201261
38. Gough MJ, Crittenden MR. Immune system plays an important role in the success and failure of conventional cancer therapy. Immunotherapy. (2012) 4:125–8. doi: 10.2217/imt.11.157
39. Cheng C, Wang Q, Zhu M, Liu K, Zhang Z. Integrated analysis reveals potential long non-coding RNA biomarkers and their potential biological functions for disease free survival in gastric cancer patients. Cancer Cell Int. (2019) 19:123. doi: 10.1186/s12935-019-0846-6
40. Berchuck A, Iversen ES, Luo J, Clarke JP, Horne H, Levine DA, et al. Microarray analysis of early stage serous ovarian cancers shows profiles predictive of favorable outcome. Clin Cancer Res. (2009) 15:2448–55. doi: 10.1158/1078-0432.CCR-08-2430
41. Hsich E, Gorodeski EZ, Blackstone EH, Ishwaran H, Lauer MS. Identifying important risk factors for survival in patient with systolic heart failure using random survival forests. Circ Cardiovasc Qual Outcomes. (2011) 4:39–45. doi: 10.1161/CIRCOUTCOMES.110.939371
42. Zeller C, Dai W, Steele NL, Siddiq A, Walley AJ, Wilhelm-Benartzi CS, et al. Candidate DNA methylation drivers of acquired cisplatin resistance in ovarian cancer identified by methylome and expression profiling. Oncogene. (2012) 31:4567–76. doi: 10.1038/onc.2011.611
43. Fejzo MS, Chen HW, Anderson L, McDermott MS, Karlan B, Konecny GE, et al. Analysis in epithelial ovarian cancer identifies KANSL1 as a biomarker and target gene for immune response and HDAC inhibition. Gynecol Oncol. (2021) 160:539–46. doi: 10.1016/j.ygyno.2020.11.008
44. Tas F, Karabulut S, Serilmez M, Ciftci R, Duranyildiz D. Serum levels of macrophage migration-inhibitory factor (MIF) have diagnostic, predictive and prognostic roles in epithelial ovarian cancer patients. Tumour Biol. (2014) 35:3327–31. doi: 10.1007/s13277-013-1438-z
45. Sethi G, Pathak HB, Zhang H, Zhou Y, Einarson MB, Vathipadiekal V, et al. An RNA interference lethality screen of the human druggable genome to identify molecular vulnerabilities in epithelial ovarian cancer. PloS ONE. (2012) 7:e47086. doi: 10.1371/journal.pone.0047086
46. Ruyssinck J, van der Herten J, Houthooft R, Ongenae F, Couckuyt I, Gadeyne B, et al. Random survival forests for predicting the bed occupancy in the intensive care unit. Comput Math Methods Med. (2016) 2016:7087053. doi: 10.1155/2016/7087053
47. Hamidi O, Poorolajal J, Farhadian M, Tapak L. Identifying important risk factors for survival in kidney graft failure patients using random survival forests. Iran J Public Health. (2016) 45:27–33.
48. Shi M, Xu G. Development and validation of GMI signature based random survival forest prognosis model to predict clinical outcome in acute myeloid leukemia. BMC Med Genomics. (2019) 12:90. doi: 10.1186/s12920-019-0540-5
49. Wang H, Liu D, Yang J. Prognostic risk model construction and molecular marker identification in glioblastoma multiforme based on mRNA/microRNA/long non-coding RNA analysis using random survival forest method. Neoplasma. (2019) 66:459–69. doi: 10.4149/neo_2018_181008N746
50. Adham D, Abbasgholizadeh N, Abazari M. Prognostic factors for survival in patients with gastric cancer using a random survival forest. Asian Pacific J Cancer Prev. (2017) 18:129–34. doi: 10.22034/APJCP.2017.18.1.129
51. Wang H, Li G. A selective review on random survival forests for high dimensional data. Quant Biosci. (2017) 36:85–96. doi: 10.22283/qbs.2017.36.2.85
52. Wang H, Shen L, Geng J, Wu Y, Xiao H, Zhang F, et al. Prognostic value of cancer antigen−125 for lung adenocarcinoma patients with brain metastasis: a random survival forest prognostic model. Sci Rep. (2018) 8:5670. doi: 10.1038/s41598-018-23946-7
53. Liang C, Zhang Y, Zhang Y, Li R, Wang Z, Wei Z, et al. The prognostic value of LINC01296 in pan-cancers and the molecular regulatory mechanism in hepatocellular carcinoma: a comprehensive study based on data mining, bioinformatics, and in vitro validation. Oncotargets Ther. (2019) 12:5861–85. doi: 10.2147/OTT.S205853
54. Kontos CK, Papadopoulos IN, Scorilas A. Quantitative expression analysis and prognostic significance of the novel apoptosis-related gene BCL2L12 in colon cancer. Biol Chem. (2008) 389:1467–75. doi: 10.1515/BC.2008.173
55. Malietzis G, Lee GH, Bernardo D, Blakemore AI, Knight SC, Moorghen M, et al. The prognostic significance and relationship with body composition of CCR7-positive cells in colorectal cancer. J Surg Oncol. (2015) 112:86–92. doi: 10.1002/jso.23959
56. Tampakis A, Tampaki EC, Nonni A, Tsourouflis G, Posabella A, Patsouris E, et al. L1CAM expression in colorectal cancer identifies a high-risk group of patients with dismal prognosis already in early-stage disease. Acta Oncol. (2019) 59:55–9. doi: 10.1080/0284186X.2019.1667022
Keywords: ovarian cancer, overall survival, immune gene, transcription factor, prognostic signature
Citation: He T, Huang L, Li J, Wang P and Zhang Z (2021) Potential Prognostic Immune Biomarkers of Overall Survival in Ovarian Cancer Through Comprehensive Bioinformatics Analysis: A Novel Artificial Intelligence Survival Prediction System. Front. Med. 8:587496. doi: 10.3389/fmed.2021.587496
Received: 27 August 2020; Accepted: 19 April 2021;
Published: 24 May 2021.
Edited by:
George Priya Doss C, VIT University, IndiaReviewed by:
Pavan Gollapalli, Nitte University, IndiaCopyright © 2021 He, Huang, Li, Wang and Zhang. This is an open-access article distributed under the terms of the Creative Commons Attribution License (CC BY). The use, distribution or reproduction in other forums is permitted, provided the original author(s) and the copyright owner(s) are credited and that the original publication in this journal is cited, in accordance with accepted academic practice. No use, distribution or reproduction is permitted which does not comply with these terms.
*Correspondence: Zhiqiao Zhang, c2RncnhqYmtAMTYzLmNvbQ==
†These authors share first authorship
Disclaimer: All claims expressed in this article are solely those of the authors and do not necessarily represent those of their affiliated organizations, or those of the publisher, the editors and the reviewers. Any product that may be evaluated in this article or claim that may be made by its manufacturer is not guaranteed or endorsed by the publisher.
Research integrity at Frontiers
Learn more about the work of our research integrity team to safeguard the quality of each article we publish.