 Ling Wei
 Yunxiao Song5
 Bo Ma
Bo Ma Yi Lu
Yi Lu Xiangjia Zhu
95% of researchers rate our articles as excellent or good
Learn more about the work of our research integrity team to safeguard the quality of each article we publish.
Find out more
ORIGINAL RESEARCH article
Front. Med. , 23 December 2020
Sec. Ophthalmology
Volume 7 - 2020 | https://doi.org/10.3389/fmed.2020.592663
This article is part of the Research Topic Advances in Management and Treatment of High Myopia and Its Complications View all 17 articles
Purpose: To develop a machine learning-based calculator to improve the accuracy of IOL power predictions for highly myopic eyes.
Methods: Data of 1,450 highly myopic eyes from 1,450 patients who had cataract surgeries at our hospital were used as internal dataset (train and validate). Another 114 highly myopic eyes from other hospitals were used as external test dataset. A new calculator was developed using XGBoost regression model based on features including demographics, biometrics, IOL powers, A constants, and the predicted refractions by Barrett Universal II (BUII) formula. The accuracies were compared between our calculator and BUII formula, and axial length (AL) subgroup analysis (26.0–28.0, 28.0–30.0, or ≥30.0 mm) was further conducted.
Results: The median absolute errors (MedAEs) and median squared errors (MedSEs) were lower with the XGBoost calculator (internal: 0.25 D and 0.06 D2; external: 0.29 D and 0.09 D2) vs. the BUII formula (all P ≤ 0.001). The mean absolute errors and were 0.33 ± 0.28 vs. 0.45 ± 0.31 (internal), and 0.35 ± 0.24 vs. 0.43 ± 0.29 D (external). The mean squared errors were 0.19 ± 0.32 vs. 0.30 ± 0.36 (internal), and 0.18 ± 0.21 vs. 0.27 ± 0.29 D2 (external). The percentages of eyes within ±0.25 D of the prediction errors were significantly greater with the XGBoost calculator (internal: 49.66 vs. 29.66%; external: 78.28 vs. 60.34%; both P < 0.05). The same trend was in MedAEs and MedSEs in all subgroups (internal) and in AL ≥30.0 mm subgroup (external) (all P < 0.001).
Conclusions: The new XGBoost calculator showed promising accuracy for highly or extremely myopic eyes.
High myopia has become a worldwide epidemic, with a predicted prevalence of 10% of the world population by the year 2050 (1). It often leads to significant visual impairment or even blindness (2). Patients with high myopia also have a higher risk of developing cataracts and undergo cataract surgeries at an earlier age (3–5). Therefore, the accurate IOL power calculation for these eyes is an important issue.
However, highly myopic eyes often experience hyperopic refractive surprise after cataract surgery (6, 7), despite the use of partial coherence interferometry, which could eliminate biometric errors (8, 9). Therefore, choosing appropriate formulas to reduce refractive errors becomes crucial in these eyes.
Fourth-generation formulas, such as the Barrett Universal II (BUII) (10), Olsen, and Hill-Radial Basis Function (RBF) formulas, offered promising outcomes for highly myopic eyes (11, 12). In particular, the BUII formula may show the greatest accuracy for myopic eyes (13–15). For eyes with ALs > 24.5 mm, the BUII formula presented the highest percentage of eyes within ±0.50 D of the prediction error (PE) (82.1% on average) (16). However, the accuracy of the BUII formula decreased sharply when we included more eyes with extreme myopia (AL > 28.0 mm), as the percentage of eyes within ±0.50 D of the PE decreased to 70%, and the percentage within ±0.25 D of the PE was only 25% (17). Therefore, accurate prediction of IOL power for eyes with high or extreme myopia remains challenging.
The purpose of this study was to develop a new calculator using the XGBoost machine learning regression technique that incorporates several clinical features, including the BUII formula results, to improve the accuracy of IOL power prediction for highly or extremely myopic eyes.
The Institutional Review Board of the Eye and Ear, Nose, and Throat (ENT) Hospital of Fudan University (Shanghai, China) approved this study. The study adhered to the tenets of the Declaration of Helsinki and was registered at www.clinicaltrials.gov (accession number NCT02182921). Signed informed consents for the use of their clinical data were obtained from all participants before cataract surgery.
Data of 1,450 highly myopic eyes from 1,450 patients who had uneventful cataract surgery at our hospital were collected to develop and validate the models (internal dataset). Data from the Shanghai Aier Eye Hospital and the Ninth People's Hospital of Shanghai Jiaotong University were collected as an external test dataset, including another 114 highly myopic eyes from 114 patients.
The inclusion criteria were: (1) axial length (AL) >26.0 mm; (2) preoperative biometry obtained using IOLMaster 700 (version 1.80) or IOLMaster 500 (version 7.7, Carl Zeiss Meditec AG, Jena, Germany); (3) uneventful cataract surgery with credible postoperative (≥1 month) manifest refraction outcomes; and (4) best corrected distance visual acuity (BCVA) taken by a Snellen chart at 2.5 m more than 1 month after surgery. The exclusion criteria were: (1) severe corneal opacity; (2) severe maculopathy, which was defined the fundus photograph (Optos-200Tx Ultra-Widefield Retinal Imaging System, Optos, Dunfermline, United Kingdom) results reaching category 4 according to the international photographic grading system for myopic maculopathy proposed by Ohno-Matsui et al. (18), or the OCT exam (Spectralis OCT; Heidelberg Engineering, Heidelberg, Germany) revealed severe lesions such as the macular hole, choroidal neovascularization, atrophy, etc.; and (4) eyes with ocular trauma or other diseases that may influence the accuracy of manifest refraction.
The IOL models in the internal dataset included MCX 11 ASP, Rayner, 409MP, HOYA, ZCB00, SN60WF, and ZMB00, while the external dataset included MCX 11 ASP, SN60WF, and ErgomaX.
The A constants were obtained from the User Group for Laser Interference Biometry website (ocusoft.de/ulib/index.htm) for SRK/T formula, after which the constants were input into the website of BUII formula and lens factors were automatically generated.
The project included three main parts: dataset preparation, model design, and training and evaluation.
Data from our hospital were set as the internal dataset, while 20% of the eyes were split randomly into a test dataset, and the remainders were used as the train and validation datasets. Data from the other hospitals were set as an external test dataset.
Actual postoperative refraction measured more than 1 month after cataract surgery was set as the training target, with others listed below set as features of machine learning. The four types of features were: (1) demographic information, which was the patient age; (2) biometric data, which included AL, corneal curvature (flattest and steepest K value, namely K1 and K2), steepest and flattest meridian, and anterior chamber depth (ACD, measured from epithelium to lens). We also included two additional parameters: and , by feature transformation during preprocessing; (3) the power of the implanted IOL model and its A constant; and (4) the predicted refraction of the implanted IOL back-calculated using the BUII formula.
XGBoost is an algorithm in which new models are created that predict the residuals of prior models and are then added together to make the final prediction (19). Using an internal dataset, the XGBoost model was compared with another two regression models, including Random Forests (RF) (20), and linear support vector machine (SVM) regressor (21), and the one with best prediction outcomes was adopted for further analysis.
The clinical features in the training dataset were input into the three machine learning models to predict the postoperative refractions. Random search with 3-fold cross-validation was used to determine the hyperparameters of the models, which were randomly selected within a range. Through 500 repetitions, the optimal hyperparameters with the highest validation scores were chosen for our model. The hyperparameters used in our study for XGBoost were learning_rate (0,0.1], n_estimator (300, 700), max_depth (2,3), gamma (1), subsample [0.7, 0.9], and colsample_bytree [0.7, 0.9]; for RF were n_estimators [1,200], min_samples_leaf [1,1000], and max_features (1, 12); for linear SVM were epsilon [0,1] and C [0,10].
To evaluate the precision of the model, the trained and tuned prediction model was used to predict postoperative refraction using the internal and external test datasets. The PE was defined as the actual postoperative refraction (spherical equivalent) minus the predicted postoperative refraction (back-calculated with the actually implanted IOL power). The median absolute errors (MedAEs) (22), median squared errors (MedSEs), mean absolute errors (MAEs), mean squared errors (MSEs), and the percentages of eyes within ±0.25, ±0.50, ±0.75, and ±1.00 D of the PE were calculated and compared between the new calculator and the BUII formula. Furthermore, a comparison between the new calculator and the RBF 2.0 formula was further conducted with part of the data from the internal and external test datasets, while only cases with −2.5 to 1 D refractive targets or AL <35 mm can be calculated with the RBF 2.0 calculator according to its user guide (23).
The flow diagram of our model was demonstrated in Figure 1. To validate the stability and generalizability of the model, the training dataset and internal test dataset were randomly split with a fixed proportion (80:20%) with 100 repetitions. In each repetition, a new model was established based on the training dataset and was evaluated using the same metrics and a separate test dataset.
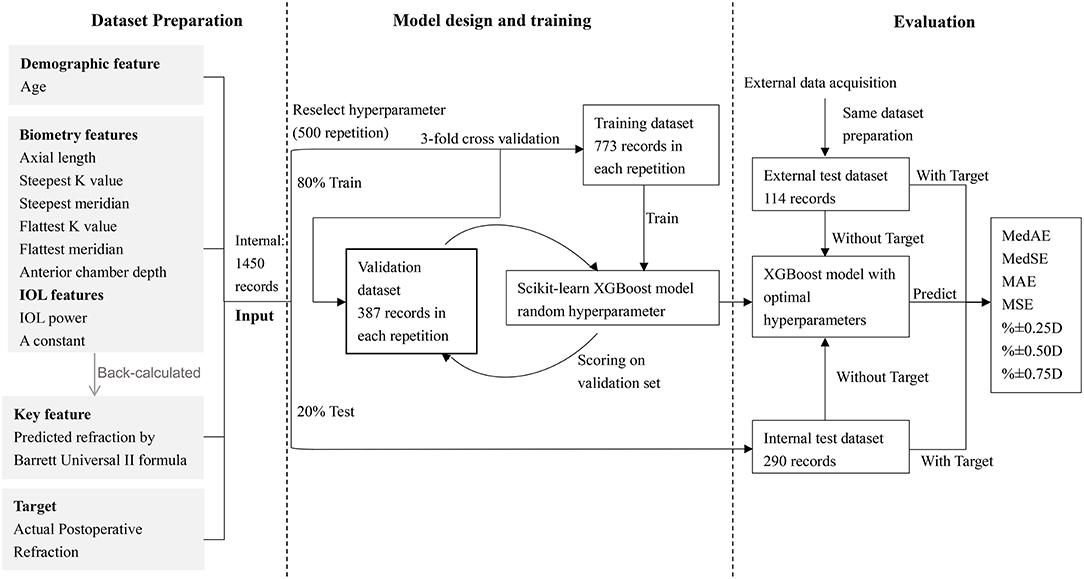
Figure 1. The flow diagram of the XGBoost model.
We also conducted subgroup analysis stratified by ALs (26.0–28.0, 28.0–30.0, and ≥30.0 mm) with both test datasets. Eyes with AL ≥28.0 mm were defined as extremely myopic eyes. The accuracies of our calculator and the BUII formula were compared in each subgroup using the evaluation metrics described above.
A free website for our XGBoost calculator was developed for online calculations (zhuformula.com, with user guide provided).
Statistical analyses were performed with SPSS software (version 11.0, SPSS, Inc.). Continuous variables were described as the mean ± standard deviation. The student's t-test was used to compare the continuous variables and the χ2 test was used to compare categorical variables. Outcome measurements with abnormal distributions were compared with the Wilcoxon signed-rank test (two groups) or the Kruskal-Wallis test (more than two groups). Linear-by-linear associations (two groups) and Kaplan-Merier test (more than two groups) were used to compare the distributions of the PE. A P-value of <0.05 was considered statistically significant.
The demographic data for the eyes in the internal and external datasets are shown in Table 1. There were no statistically significant between-group differences in age, sex, and laterality. However, the external dataset had longer AL, larger K1, and K2, and lower implanted IOL power. Extremely myopic eyes comprised 62.07% (180/290) of all eyes in the internal test dataset and 79.82% (91/114) in the external test dataset.
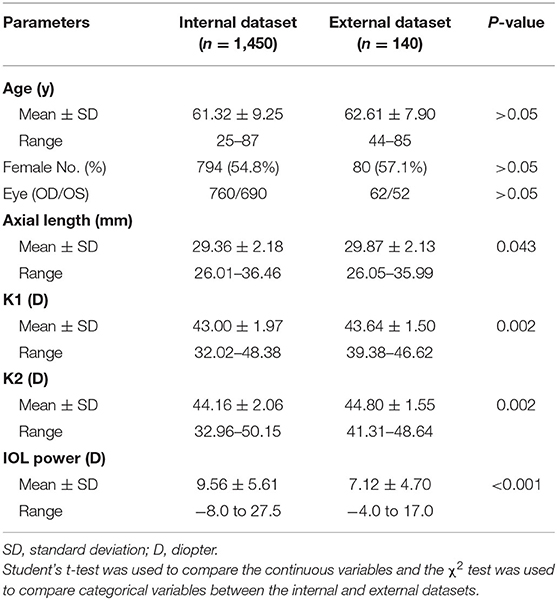
Table 1. Demographics of the internal and external datasets.
Comparisons of three regression models demonstrated that the XGBoost outperformed RF and linear SVM (P < 0.01, Table 2). We then developed our XGBoost calculator and compared its prediction results with the BUII formula in both test datasets. The Bland-Altman plots with actual postoperative refraction against the XGBoost or the BUII outputs were demonstrated in Figure 2, and most points were within the agreement limits. The summary of accuracy outcomes was demonstrated in Table 3. The mean predicted refractions in the internal test dataset were −3.09 D (range −6.88 to 0.37 D) by the XGBoost calculator, and −3.06 D (range −8.29 to 0.58 D) by the BUII; while in the external test dataset were −2.41 D (range −4.32 to 0.20 D) by the XGBoost calculator, and −2.66 D (range −4.65 to −0.15 D) by the BUII. The MedAEs and MedSEs were significantly lower with the XGBoost calculator in two test datasets (internal: MedAE: 0.25 vs. 0.42 D and MedSE: 0.06 vs. 0.17 D; external: MedAE: 0.29 vs. 0.42 D and MedSE: 0.09 vs. 0.18 D; all P ≤ 0.001). The MAEs with our XGBoost calculator vs. the BUII were 0.33 ± 0.28 vs. 0.45 ± 0.31 D in internal test dataset, and 0.35 ± 0.24 vs. 0.43 ± 0.29 D in external test dataset. The MSEs were 0.19 ± 0.32 vs. 0.30 ± 0.36 D2 in internal test dataset, and 0.18 ± 0.21 vs. 0.27 ± 0.29 D2 in external test dataset. As for the 100 times random cross-validation analyses, the MAEs of our XGBoost formula were consistently lower in all rounds of modeling and calculation (Supplementary Figure 1).
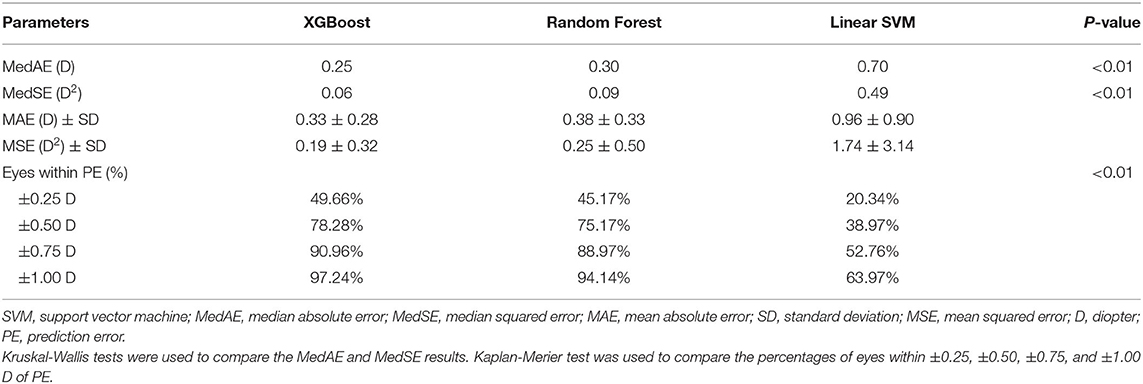
Table 2. Comparison regression models including the XGBoost, Linear Support Vector Machine, and Random Forest using the internal test dataset.
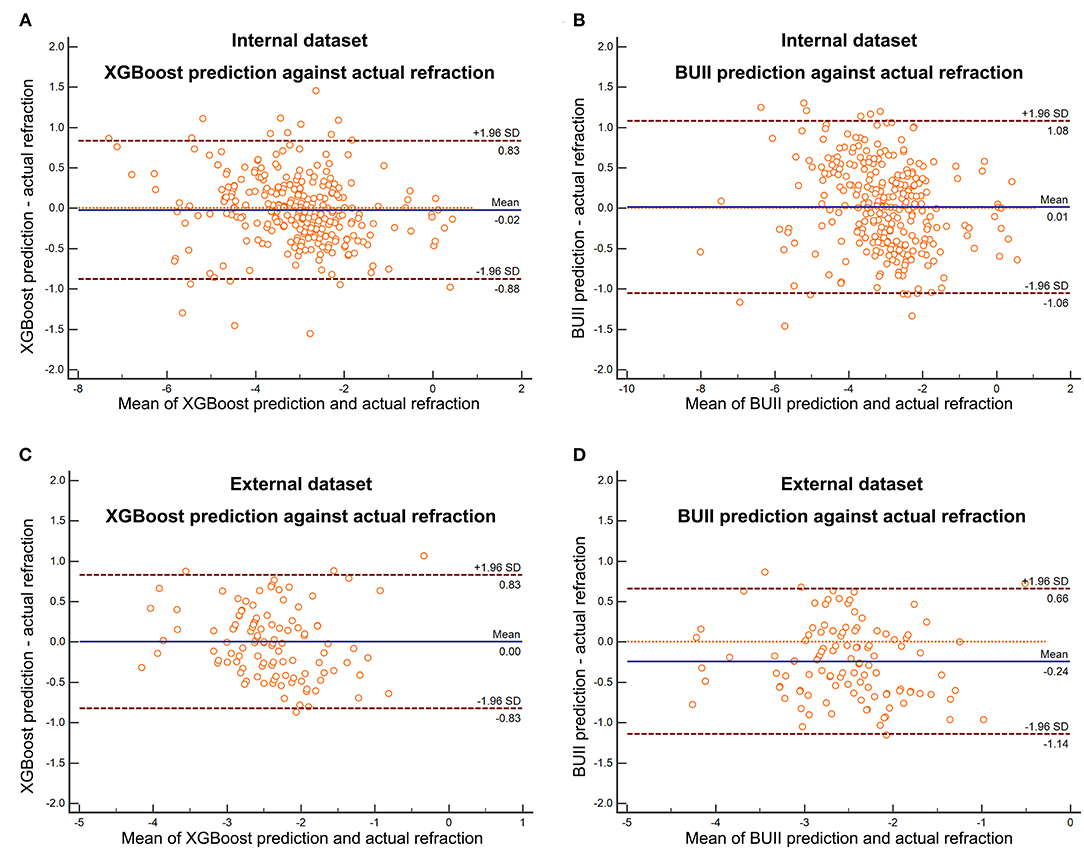
Figure 2. The Bland-Altman plots with actual postoperative refraction against the XGBoost prediction in the internal (A) and external (C) test dataset or Barrett Universal II formula (BUII) prediction in the internal (B) and external (D) test dataset.
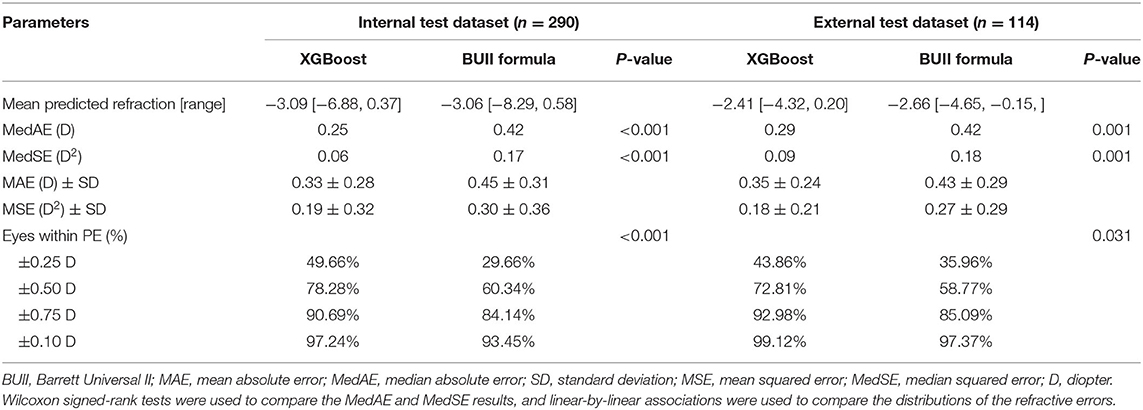
Table 3. Summary of outcomes for the XGBoost calculator and the Barrett Universal II formula for the internal and external test datasets.
The percentages of eyes within ±0.25, ±0.50, ±0.75, and ±1.00 D of the PE were greater with the XGBoost calculator in the internal (±0.25 D: 49.66 vs. 29.66%; ±0.50 D: 78.28 vs. 60.34%; ±0.75 D: 90.69 vs. 84.14%; ±1.00 D: 97.24 vs. 93.45%; P <0.001) and external dataset (±0.25 D: 43.86 vs. 35.96%; ±0.50 D: 72.81 vs. 58.77%; ±0.75 D: 92.98 vs. 85.09%; ±1.00 D: 99.12 vs. 97.37%; both P < 0.05) (Table 3 and Figure 3). Furthermore, the new XGBoost calculator also outperformed the RBF 2.0 calculator in the internal and external test datasets (Supplementary Table 1).
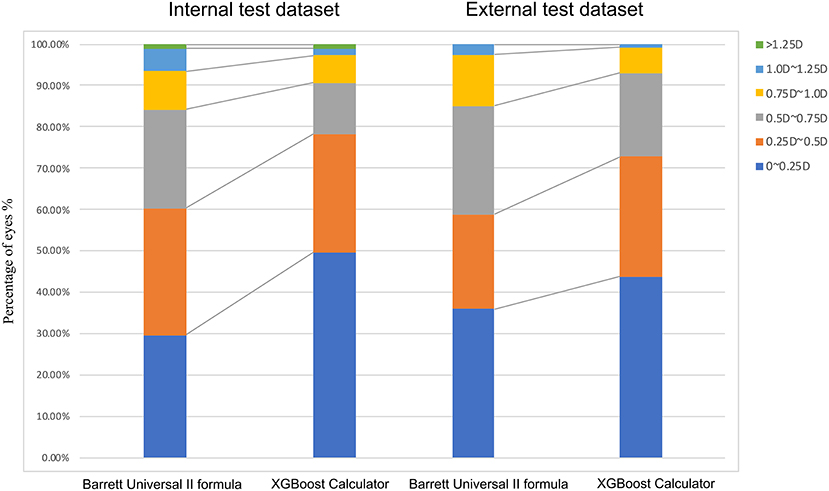
Figure 3. Distribution of eyes within ±0.25 D, ±0.50 D, ±0.75 D, ±1.00 D, or ±1.25 D of the prediction errors in the internal test dataset.
Table 4 shows the results of the AL subgroup analysis. The MedAEs and MedSEs were significantly lower with the XGBoost calculator than the BUII formula in all subgroups in the internal dataset (all P < 0.001) and in the AL ≥30.0 mm subgroup in the external dataset (P < 0.001). The mean absolute errors (MAEs) with our XGBoost calculator vs. the BUII in three AL subgroups in internal test dataset were 0.29 ± 0.24, 0.35 ± 0.30, and 0.36 ± 0.30 D, respectively, vs. 0.42 ± 0.29, 0.48 ± 0.35, and 0.46 ± 0.29 D, respectively; while in the AL subgroups of the external test dataset were 0.35 ± 0.26, 0.35 ± 0.24, and 0.34 ± 0.24 D, respectively, vs. 0.35 ± 0.24, 0.38 ± 0.27, and 0.51 ± 0.30 D, respectively. The mean squared errors (MSEs) in the AL subgroups of the internal test dataset were 0.14 ± 0.21, 0.21 ± 0.40, and 0.22 ± 0.35 D2, respectively, vs. 0.26 ± 0.32, 0.35 ± 0.45, and 0.30 ± 0.33 D2, respectively; while in the AL subgroups of the external test dataset were 0.18 ± 0.25, 0.18 ± 0.21, and 0.17 ± 0.20 D2, respectively, vs. 0.18 ± 0.22, 0.21 ± 0.22, and 0.35 ± 0.33 D2, respectively.
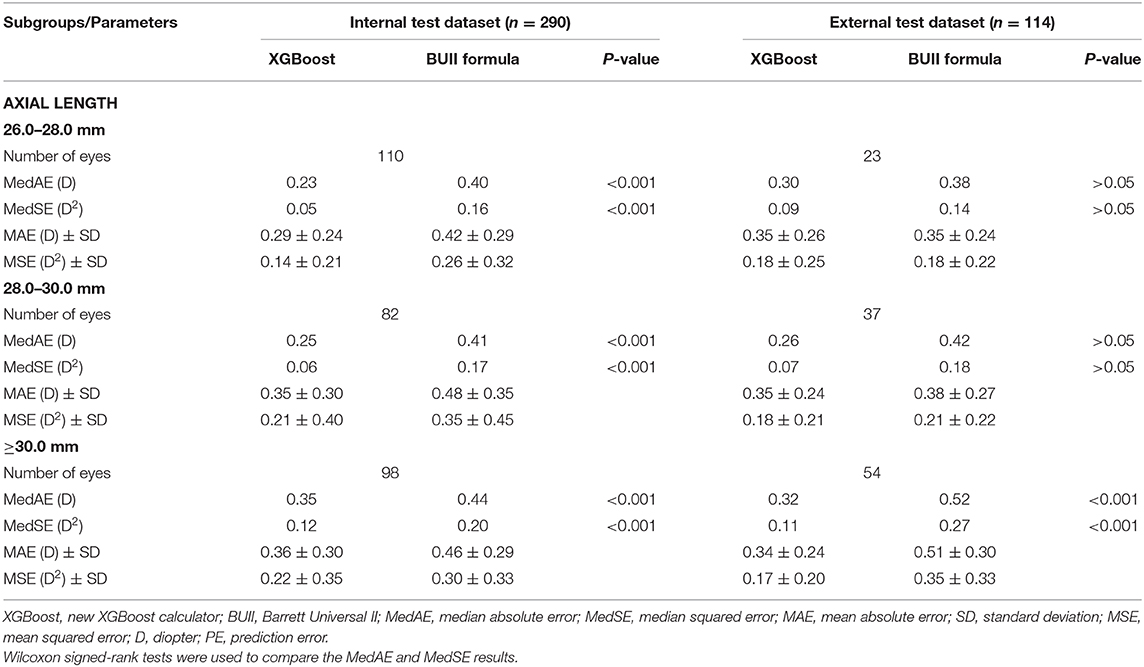
Table 4. Summary of outcomes from axial length subgroup analyses comparing the XGBoost calculator and the Barrett Universal II formula in the internal and external test datasets.
Accurately predicting the IOL power for highly myopic eyes is quite difficult, especially for extremely myopic eyes. Although the BUII formula appears to be the most accurate formula currently available for highly myopic eyes (8, 12, 24), its accuracy decreases when it is applied to extremely myopic eyes (17). Moreover, despite the promising outcomes of the BUII formula in terms of the percentage of eyes within ±0.50 D of the PE (11, 12, 14, 24), the percentage of eyes within ±0.25 D of the PE remains unsatisfied (25.0–38.3%) (14, 15, 17). Therefore, there is still room for improving the BUII formula for extremely myopic eyes. In this study, we developed a new XGBoost IOL calculator that showed improved accuracy in highly myopic eyes. It performed well in a dataset in which more than two-thirds of eyes were extremely myopic, and it greatly improved the percentage of eyes within ±0.25 D of the PE relative to the BUII formula using the internal (49.66 vs. 29.66%) and external (43.86 vs. 35.96%) test datasets.
In long eyes, the PE is generally attributable to two factors, the ocular biometry and the calculation formula itself. In terms of biometry, longer AL, greater ACD, the occurrence of staphyloma (25, 26), and poor fixation stability can influence the measurement of highly myopic eyes (27). However, the use of noncontact partial coherence interferometry can eliminate measurement errors, thus errors from the selected formula itself are of more concern (11, 28). Optimizing the constants of the existing formulas is one solution (29–31), while improving formulas that consider more characteristic variables for highly myopic eyes might be another.
In recent years, several new formulas that incorporate additional factors into the calculation have been developed, and efforts have been made to determine the most accurate formulas in eyes with ALs >26.0 mm (8, 11, 12, 14, 15, 17). The BUII formula seemed to show the best performance, and when used, the percentage of eyes within ±0.50 D of the PE varies from 62.7 to 89.5% (11, 12, 14, 15, 17). However, its refractive errors inevitably increase as AL increases (6). When we included more eyes with extreme myopia in our previous study, only 70% of eyes were within ±0.50 D of the PE using the BUII formula, with a corresponding value of 60.34% in the current study (17). Apart from that, the percentage of eyes within ±0.25 D of BUII formula was still unsatisfied in highly myopic eyes [25.0% (4), 34.7% (15), or 38.3% (14)]. Therefore, the BUII formula can still be improved for highly or especially extremely myopic eyes. On these grounds, we used machine learning to develop a new calculator to improve the BUII formula for long eyes.
Machine learning and data-driven approaches are becoming more important in ophthalmology (32). The RBF formula is another widely-used formula based on artificial intelligence. Although 86.6% of highly myopic eyes were within ±0.50 D of the PE using the latest version (24), their average AL of the included eyes was 27.72 mm (maximum: 32.36 mm) (24), indicating the validation of the RBF formula in extremely long eyes was still inadequate. In our study, the average AL was >29.00 mm (maximum: 36.46 mm), and more promising accuracy of the XGBoost calculator was also found over the RBF 2.0 formula. Therefore, our XGBoost calculator may be more reliable for extremely long eyes. Moreover, the RBF 2.0 formula is only used in cases where the postoperative target outcome is within −2.5 to 1 D (23). Its implementation is refined when < -2.5 D myopic refractive targets were scheduled for extremely long eyes. Compared with the RBF formula, our calculator might be more useful for IOL power prediction in highly or extremely myopic eyes.
In the present study, it is noteworthy that similar outcomes were also found using the external test dataset, which contained a greater proportion of extremely myopic eyes (79.82%), indicating the generalizability potential of our calculator. Furthermore, when the training and internal test datasets were subjected to 100 rounds of random splitting, our calculator showed high stability with more promising accuracy than the BUII formula. Using our website, surgeons need only enter the IOL power and the predicted refractions calculated with the BUII formula, together with the other clinical feature data required, to yield more accurate predictions of IOL power, and thereby assist surgeons with surgical planning for highly or extremely myopic eyes. Moreover, using the same algorithm, we are willing to further include more data of low or moderate myopic eyes to train the model, and thus further expand the scope of application for our calculator in the future.
In conclusion, we developed a new XGBoost machine learning-based calculator, which demonstrated good accuracy for IOL power prediction in highly and extremely myopic eyes.
The raw data supporting the conclusions of this article will be made available by the authors, without undue reservation.
The studies involving human participants were reviewed and approved by the Institutional Review Board of the Eye and Ear, Nose, and Throat (ENT) Hospital of Fudan University (Shanghai, China). The patients/participants provided their written informed consent to participate in this study.
LW: collected data, performed analyses, and wrote the manuscript. YS: programmed model and performed analyses. WH: collected data and performed analyses. XC and BM: collected data. YL: gained the fund and supervised the process. XZ: revised the manuscript, gained the fund, and supervised the process. All authors contributed to the article and approved the submitted version.
This article was supported by research grants from the National Natural Science Foundation of the People's Republic of China (Grant Nos. 81870642, 81970780, 81470613, and 81670835), the Shanghai Shenkang Hospital Development Center Municipal Hospital Clinical Research and Cultivation Project (Grant No. SHDC120219X08), National Key R&D Program of China (Grant No. 2018YFC0116800), the Excellent Clinician-Excellent Clinical Scientist Program of the Eye and ENT Hospital of Fudan University, and Specialized Research Program for Shanghai Wise Information Technology of Medicine (Grant No. 2018ZHYL0220).
The authors declare that the research was conducted in the absence of any commercial or financial relationships that could be construed as a potential conflict of interest.
The Supplementary Material for this article can be found online at: https://www.frontiersin.org/articles/10.3389/fmed.2020.592663/full#supplementary-material
1. Holden BA, Fricke TR, Wilson DA, Jong M, Naidoo KS, Sankaridurg P, et al. Global prevalence of myopia and high myopia and temporal trends from 2000 through 2050. Ophthalmology. (2016) 123:1036–42. doi: 10.1016/j.ophtha.2016.01.006
2. Holden B, Sankaridurg P, Smith E, Aller T, Jong M, He M. Myopia, an underrated global challenge to vision: where the current data takes us on myopia control. Eye. (2014) 28:142–6. doi: 10.1038/eye.2013.256
3. Hoffer KJ. Biometry of 7,500 cataractous eyes. Am J Ophthalmol. (1980) 90:360–8. doi: 10.1016/S0002-9394(14)74917-7
4. Zhu X, Li D, Du Y, He W, Lu Y. DNA hypermethylation-mediated downregulation of antioxidant genes contributes to the early onset of cataracts in highly myopic eyes. Redox Biol. (2018) 19:179–89. doi: 10.1016/j.redox.2018.08.012
5. Kanthan GL, Mitchell P, Rochtchina E, Cumming RG, Wang JJ. Myopia and the long-term incidence of cataract and cataract surgery: the Blue Mountains Eye Study. Clin Exp Ophthalmol. (2014) 42:347–53. doi: 10.1111/ceo.12206
6. Melles RB, Holladay JT, Chang WJ. Accuracy of intraocular lens calculation formulas. Ophthalmology. (2018) 125:169–78. doi: 10.1016/j.ophtha.2017.08.027
7. Wang L, Shirayama M, Ma XJ, Kohnen T, Koch DD. Optimizing intraocular lens power calculations in eyes with axial lengths above 25.0 mm. J Cataract Refract Surg. (2011) 37:2018–27. doi: 10.1016/j.jcrs.2011.05.042
8. Bang S, Edell E, Yu Q, Pratzer K, Stark W. Accuracy of intraocular lens calculations using the IOLMaster in eyes with long axial length and a comparison of various formulas. Ophthalmology. (2011) 118:503–6. doi: 10.1016/j.ophtha.2010.07.008
9. Wang JK, Hu CY, Chang SW. Intraocular lens power calculation using the IOLMaster and various formulas in eyes with long axial length. J Cataract Refract Surg. (2008) 34:262–7. doi: 10.1016/j.jcrs.2007.10.017
10. Barrett GD. An improved universal theoretical formula for intraocular lens power prediction. J Cataract Refract Surg. (1993) 19:713–20. doi: 10.1016/S0886-3350(13)80339-2
11. Cooke DL, Cooke TL. Comparison of 9 intraocular lens power calculation formulas. J Cataract Refract Surg. (2016) 42:1157–64. doi: 10.1016/j.jcrs.2016.06.029
12. Abulafia A, Barrett GD, Rotenberg M, Kleinmann G, Levy A, Reitblat O, et al. Intraocular lens power calculation for eyes with an axial length greater than 26.0 mm: comparison of formulas and methods. J Cataract Refract Surg. (2015) 41:548–56. doi: 10.1016/j.jcrs.2014.06.033
13. Roberts TV, Hodge C, Sutton G, Lawless M. Comparison of Hill-radial basis function, Barrett Universal and current third generation formulas for the calculation of intraocular lens power during cataract surgery. Clin Exp Ophthalmol. (2018) 46:240–6. doi: 10.1111/ceo.13034
14. Kane JX, Van Heerden A, Atik A, Petsoglou C. Accuracy of 3 new methods for intraocular lens power selection. J Cataract Refract Surg. (2017) 43:333–9. doi: 10.1016/j.jcrs.2016.12.021
15. Kane JX, Van Heerden A, Atik A, Petsoglou C. Intraocular lens power formula accuracy: comparison of 7 formulas. J Cataract Refract Surg. (2016) 42:1490–500. doi: 10.1016/j.jcrs.2016.07.021
16. Wang Q, Jiang W, Lin T, Zhu Y, Chen C, Lin H, et al. Accuracy of intraocular lens power calculation formulas in long eyes: a systematic review and meta-analysis. Clin Exp Ophthalmol. (2018) 46:738–49. doi: 10.1111/ceo.13184
17. Rong X, He W, Zhu Q, Qian D, Lu Y, Zhu X. Intraocular lens power calculation in eyes with extreme myopia: comparison of Barrett Universal II, Haigis, and Olsen formulas. J Cataract Refract Surg. (2019) 45:732–7. doi: 10.1016/j.jcrs.2018.12.025
18. Sugar A, Sadri E, Dawson DG, Musch DC. Refractive stabilization after temporal phacoemulsification with foldable acrylic intraocular lens implantation. J Cataract Refract Surg. (2001) 27:1741–5. doi: 10.1016/S0886-3350(01)00894-X
19. Chen TQ, Guestrin C, Association for Computing Machinery. XGBoost: a scalable tree boosting system. In: Kdd'16: Proceedings of the 22nd Acm Sigkdd International Conference on Knowledge Discovery and Data Mining. New York, NY: Association for Computing Machinery (2016).
21. Mark S, Alex G, Vladimir V, Vladimir V, Chris W, Jason W. Support vector regression with ANOVA decomposition kernels. In: Scholkopf B, Burghes CJC, Smola AJ, editors. Advances in Kernel Methods: Support Vector Learning. Cambridge, MA: MIT Press (1999). p. 285–91.
22. Hoffer KJ, Aramberri J, Haigis W, Olsen T, Savini G, Shammas HJ, et al. Protocols for studies of intraocular lens formula accuracy. Am J Ophthalmol. (2015) 160:403–5 e401. doi: 10.1016/j.ajo.2015.05.029
23. Hill-RBF Calculator Instruction for Use. Version V2.0 (2018). Available online at: https://rbfcalculator.com/docs/Hill-RBF-Calculator-Instructions.pdf (accessed October 21, 2020).
24. Wan KH, Lam TCH, Yu MCY, Chan TCY. Accuracy and precision of intraocular lens calculations using the New Hill-RBF Version 2.0 in eyes with high axial myopia. Am J Ophthalmol. (2019) 205:66–73. doi: 10.1016/j.ajo.2019.04.019
25. Norrby S. Sources of error in intraocular lens power calculation. J Cataract Refract Surg. (2008) 34:368–76. doi: 10.1016/j.jcrs.2007.10.031
26. Olsen T. Sources of error in intraocular lens power calculation. J Cataract Refract Surg. (1992) 18:125–9. doi: 10.1016/S0886-3350(13)80917-0
27. Zhu X, He W, Sun X, Dai J, Lu Y. Fixation stability and refractive error after cataract surgery in highly myopic eyes. Am J Ophthalmol. (2016) 169:89–94. doi: 10.1016/j.ajo.2016.06.022
28. Shen P, Zheng Y, Ding X, Liu B, Congdon N, Morgan I, et al. Biometric measurements in highly myopic eyes. J Cataract Refract Surg. (2013) 39:180–7. doi: 10.1016/j.jcrs.2012.08.064
29. Lee TH, Sung MS, Cui L, Li Y, Yoon KC. Factors affecting the accuracy of intraocular lens power calculation with lenstar. Chonnam Med J. (2015) 51:91–6. doi: 10.4068/cmj.2015.51.2.91
30. Aristodemou P, Knox Cartwright NE, Sparrow JM, Johnston RL. Intraocular lens formula constant optimization and partial coherence interferometry biometry: refractive outcomes in 8108 eyes after cataract surgery. J Cataract Refract Surg. (2011) 37:50–62. doi: 10.1016/j.jcrs.2010.07.037
31. Petermeier K, Gekeler F, Messias A, Spitzer MS, Haigis W, Szurman P. Intraocular lens power calculation and optimized constants for highly myopic eyes. J Cataract Refract Surg. (2009) 35:1575–81. doi: 10.1016/j.jcrs.2009.04.028
Keywords: machine learning, refractive error, myopia, intraocular lens, IOL power calculation
Citation: Wei L, Song Y, He W, Chen X, Ma B, Lu Y and Zhu X (2020) Accuracy Improvement of IOL Power Prediction for Highly Myopic Eyes With an XGBoost Machine Learning-Based Calculator. Front. Med. 7:592663. doi: 10.3389/fmed.2020.592663
Received: 07 August 2020; Accepted: 04 December 2020;
Published: 23 December 2020.
Edited by:
Daniel Ting, Singapore National Eye Center, SingaporeReviewed by:
Christopher Kai-Shun Leung, The Chinese University of Hong Kong, ChinaCopyright © 2020 Wei, Song, He, Chen, Ma, Lu and Zhu. This is an open-access article distributed under the terms of the Creative Commons Attribution License (CC BY). The use, distribution or reproduction in other forums is permitted, provided the original author(s) and the copyright owner(s) are credited and that the original publication in this journal is cited, in accordance with accepted academic practice. No use, distribution or reproduction is permitted which does not comply with these terms.
*Correspondence: Xiangjia Zhu, emh1eGlhbmdqaWExOTgyQDEyNi5jb20=
Disclaimer: All claims expressed in this article are solely those of the authors and do not necessarily represent those of their affiliated organizations, or those of the publisher, the editors and the reviewers. Any product that may be evaluated in this article or claim that may be made by its manufacturer is not guaranteed or endorsed by the publisher.
Research integrity at Frontiers
Learn more about the work of our research integrity team to safeguard the quality of each article we publish.