
94% of researchers rate our articles as excellent or good
Learn more about the work of our research integrity team to safeguard the quality of each article we publish.
Find out more
ORIGINAL RESEARCH article
Front. Med., 23 December 2020
Sec. Infectious Diseases – Surveillance, Prevention and Treatment
Volume 7 - 2020 | https://doi.org/10.3389/fmed.2020.590460
This article is part of the Research TopicInfectious Disease Surveillance: Applying Cooperative Research to Recent Outbreaks including COVID-19View all 50 articles
 Bin Zhang1†Qin Liu2†
 Xiao Zhang3†Shuyi Liu1†Weiqi Chen4†Jingjing You1Qiuying Chen1Minmin Li1Zhuozhi Chen1Luyan Chen1Lv Chen1Yuhao Dong5
 Qingsi Zeng2*
 Shuixing Zhang1*
Aim: Early detection of coronavirus disease 2019 (COVID-19) patients who are likely to develop worse outcomes is of great importance, which may help select patients at risk of rapid deterioration who should require high-level monitoring and more aggressive treatment. We aimed to develop and validate a nomogram for predicting 30-days poor outcome of patients with COVID-19.
Methods: The prediction model was developed in a primary cohort consisting of 233 patients with laboratory-confirmed COVID-19, and data were collected from January 3 to March 20, 2020. We identified and integrated significant prognostic factors for 30-days poor outcome to construct a nomogram. The model was subjected to internal validation and to external validation with two separate cohorts of 110 and 118 cases, respectively. The performance of the nomogram was assessed with respect to its predictive accuracy, discriminative ability, and clinical usefulness.
Results: In the primary cohort, the mean age of patients was 55.4 years and 129 (55.4%) were male. Prognostic factors contained in the clinical nomogram were age, lactic dehydrogenase, aspartate aminotransferase, prothrombin time, serum creatinine, serum sodium, fasting blood glucose, and D-dimer. The model was externally validated in two cohorts achieving an AUC of 0.946 and 0.878, sensitivity of 100 and 79%, and specificity of 76.5 and 83.8%, respectively. Although adding CT score to the clinical nomogram (clinical-CT nomogram) did not yield better predictive performance, decision curve analysis showed that the clinical-CT nomogram provided better clinical utility than the clinical nomogram.
Conclusions: We established and validated a nomogram that can provide an individual prediction of 30-days poor outcome for COVID-19 patients. This practical prognostic model may help clinicians in decision making and reduce mortality.
The rapid spread of coronavirus disease 2019 (COVID-19) caused by severe acute respiratory syndrome coronavirus 2 (SARS-CoV-2) as a potentially fatal disease is a major and urgent threat to global health (1). As of July 9, 2020, there are more than 12.14 million confirmed cases by the World Health Organization (WHO) with 551,044 deaths (2). The clinical spectrum of COVID-19 ranges from mild to critically ill. Most COVID-19 patients had mild acute respiratory infection symptoms, such as fever, dry cough, and fatigue, but some could rapidly develop fatal complications, including respiratory failure, multiple organ dysfunction, shock, or even death (3). To date, no specific treatments were recommended for COVID-19 except for meticulous supportive care (4); therefore, early identification of patients with poor prognosis may facilitate the provision of proper supportive treatment in advance and reduce mortality.
The profusion of data requires machine learning to improve and accelerate COVID-19 diagnosis, treatment, and prognosis (5). Machine learning uses patterns in data to improve performance or make accurate predictions (6). It provides a powerful set of tools to unravel the relationship between the variables and outcomes, particularly when data are non-linear and complex (7). At present, some early warning models using machine learning for predicting COVID-19 patients at risk of developing a severe or critical condition have been reported (8–14). Such models are usually assessed with statistical measures for discrimination and calibration. Theoretically, a model with better discrimination and calibration indicates a better guide to clinical management, whereas statistical measures fall short when we want to determine whether the risk model improves clinical decision-making (15). Such measures cannot inform us whether it is beneficial to apply a model to make clinical decisions or which of two models lead to better decisions, especially if they have similar discrimination and calibration. As compared to traditional performance metrics, decision curve analysis (DCA) can assess the clinical utility of models for decision-making (16). DCA plots net benefit at a range of clinically reasonable risk thresholds (16). It identifies risk models that can help us make better clinical decisions.
Therefore, the purpose of this study was to develop and validate a prognostic machine-learning model based on clinical, laboratory, and radiological features of COVID-19 patients at hospital admission for 30-days poor outcome assessment during hospitalization. We also used the DCA and clinical impact curve (CIC) analysis to evaluate the clinical utility and net benefit of the predictive model in supporting clinical decisions. This model may serve as a tool for early identification of COVID-19 patients at high risk for poor outcomes during hospitalization.
This study was approved by the institutional review board and the need for written informed consent was waived. A total of 233 confirmed COVID-19 from two designated hospitals of Wuhan, Hubei province of China were consecutively and retrospectively included between January 3 to March 20, 2020. The inclusion criteria were as follows: (1) patients with a laboratory-confirmed COVID-19, which was achieved by real-time reverse transcription-polymerase chain reaction (RT-PCR) assay of throat swab samples (at least two samples were taken, at least 24 h apart) for COVID-19 according to the protocol established by the WHO; and (2) patients received treatment at hospitals. The exclusion criteria were as follows: (1) patients with critical diseases at presentation. This exclusion allows unbiased analysis, for predicting deterioration in patients during their hospitalization; (2) time interval more than 2 days from admission to examinations because delayed testing may skew the inclusion set to a more critical status; and (3) unavailable clinical and laboratory data. The primary cohort was randomly divided into two datasets, 80% for training, and the remaining 20% for internal validation using 5-fold cross-validation. Two externally validation cohorts were under the same inclusion and exclusion criteria. The external validation cohorts included patients hospitalized for COVID-19 between January 3 and May 21, 2020. Finally, 110 and 118 COVID-19 patients were enrolled in the external validation cohort 1 (Tianmen, Hubei province) and cohort 2 (Dongguan, outside Hubei province), respectively.
After consultation with physicians in charge of COVID-19 patients and review of the recent literature regarding the prognosis of COVID-19 on the dataset of PubMed using the terms “COVID,” “SARS-CoV-2,” “prognosis,” “poor outcome,” “severe,” and “critically ill,” a set of clinical, laboratory, and radiological characteristics were identified and the data were collected from the electronic medical records. The clinical characteristics included demographics, comorbidities, and symptoms. Laboratory parameters were recorded, including complete blood count, D-dimer, C-reactive protein (CRP), cardiac enzymes, procalcitonin, liver function test, kidney function test, fasting blood glucose (FBG), and electrolyte. The data in source documents were confirmed independently by at least two researchers. We also calculated the neutrophil–lymphocyte count ratio as it is an important risk factor of disease severity. Imputation for missing variables was considered if missing values were <15%. We used mean value to impute numeric features.
A semiquantitative CT scoring system was designed to assess the involvement degree or area of pneumonia for every single lobe (total five lung lobes): 0 for 0% involvement; 1 for 1–25% involvement; 2 for 26–50% involvement; 3 for 51–75% involvement; 4 for 76–100% involvement. The final CT score (range, 0–20) was assigned by summarizing the total scores of five lobes (17). CT images were reviewed independently by two radiologists with more than 10 years of experience, who were blinded to clinical and laboratory results. Any discrepancy was resolved by a consensus viewing. The detailed CT acquisition and reconstruction parameters are presented in the Supplementary Document.
Clinical variable selection and risk score development were only performed on the primary cohort as an independent process and ultimately evaluated by the external validation cohort 1 and 2. Pearson correction (PCC) analysis was first used to assess the correlation between variable pairs; a PCC of 0.9 was usually used to eliminate the redundancy in previous studies (18–20). However, most of the variables remained relatively independent in our work (PCC <0.9), with only one pair of variables' (serum creatinine and procalcitonin) coefficients exceeding 0.86. Considering the significance of PCC analysis for variable selection and modeling, we set the cutoff value to 0.86. If the PCC value of the variable pair was larger than 0.86, we calculated the correlation between these two variables and the label and removed one of the slightly unrelated variables. After this process, the dimension of the variable space was reduced, and each variable was independent of each other. Then, the least absolute shrinkage and selection operator (LASSO) logistic regression algorithm was used for further variable selection and development of the clinical score for the 30-days poor outcome prediction. The complexity and performance of the LASSO algorithm relies crucially on the choice of the tuning parameter λ, and the larger λ penalizes the linear model more, resulting in a model with fewer variables. The predictors with non-zero LASSO coefficients based on the 1 standard error rule and penalty parameter tuning were identified using 5-fold cross-validation and the minimum criteria of the area under the receiver-operator characteristic (ROC) curve (AUC). Afterward, the selected clinical variables were combined linearly to construct a clinical score.
For the superior clinical variables, we conducted the clinical nomogram to visualize the relationship between the variables and predicted probabilities. In addition, a multivariable logistic regression analysis was applied to integrate the predictive clinical variables with the CT score to construct a clinical-CT nomogram. By applying 5-fold cross-validation on the primary cohort, the performance of two constructed nomograms was first internally validated using the AUC metric and then externally validated by the external validation cohort 1 and 2. The clinical score and clinical-CT score for each patient were computed, and the association between the score and COVID-19 30-days poor outcome was assessed with the Mann–Whitney U-test. Subsequently, the calibration properties reflecting goodness of fit of the nomograms generated were assessed by plotting the predicted probabilities against the observed event proportions, subjected to bootstrapping validation (1,000 bootstrap resamples) and the Hosmer–Lemeshow test. The degree of overlap between the calibration curve and the diagonal reflects the predictive accuracy of the proposed nomograms.
DCA can be used to estimate the net benefit of a model based on the difference between the number of true-positive and false-positive results, weighted by the odds of the selected threshold probability of risk (21). To assess the clinical usefulness of the predictive models, the decision curves for each model were then compared with those for the two default strategies where patients are managed without the use of a model: “treating all” or “treating none” (22). The “treat all” strategy assumes that doctors will treat all patients regardless of their risk estimates. The “treat none” assumes that all patients are at low risk that none of them is treated. The net benefit is dependent on the threshold probability that defines “high risk” of critical illness. A predictive model has clinical utility if its net benefit curve is above that of “treat all” or “treat none” for a range of reasonable risk thresholds. The model with higher net benefit for a certain risk or probability has more clinical utility. The clinicians could refer to this to determine whether clinical decision-making based on the models will do better than harm. On this basis, we further plotted the CIC of the models. The CIC shows the estimated number who would be declared high risk for each risk threshold and visually showed the proportion of those who were cases (true positives).
We defined the severity of COVID-19 according to the newest COVID-19 guidelines released by the National Health Commission of China (23) and the guidelines of the American Thoracic Society for community-acquired pneumonia (24). Thirty-day poor outcome is defined as meeting at least one of the following criteria within 30 days after admission to hospital: respiratory failure requiring mechanical ventilation, shock, intensive care unit (ICU) admission, multiple organ dysfunction, or death.
Categorical variables were expressed as counts and percentages, while continuous variables are shown as median and interquartile range. Continuous variables were compared using the Mann–Whitney U-test, and categorical variables were compared using the chi-square test. PCC analysis, variable selection, clinical score development, and nomogram construction were conducted with R statistical software version 3.5.1 (http://www.R-project.org). The values difference of each selected superior variable within COVID-19 risk groups was compared by the Mann–Whitney U-test. Similarly, the test was applied to the comparison of clinical score and clinical-CT score between low-risk and high-risk groups. The performance of the CT score and nomograms were evaluated by AUC, sensitivity, specificity, accuracy, positive predictive value (PPV), as well as negative predictive value (NPV). ROC curves of the two nomograms were compared by the method of DeLong et al. using the MedCalc version 15.2.2 (MedCalc Inc., Mariakerke, Belgium). Note that a two-tailed p < 0.05 indicated statistical significance. All the cutoff values of ROC curves were determined by the principle of the maximum Youden index within the primary cohort. Patients were stratified into low-risk or high-risk group according to the cutoff value. We reported our findings in accordance with the Guidelines for Standards for Reporting Diagnostic accuracy studies, Developing and Reporting Machine Learning Predictive Models in Biomedical Research, and Transparent Reporting of a Multivariable Prediction Model for Individual Prognosis or Diagnosis.
Of 233 patients hospitalized for COVID-19 in the primary cohort, the mean age was 55.4 years ± 16.9 (interquartile range, 42–67 years), and 129 (55.4%) were male. Of 228 patients hospitalized for COVID-19 in two cohorts at test datasets, the mean age was 46.2 years ± 17.7 (interquartile range, 35–58 years) and 135 (59.2%) were male. The incidence of 30-days poor outcome in the primary cohort, external validation cohorts 1 and 2 was 20.2, 10.9, and 16.1%, respectively. Clinical characteristics and CT scores of the primary cohort and external validation cohorts 1 and 2 are summarized in Table 1 and Supplementary Table 1, respectively.
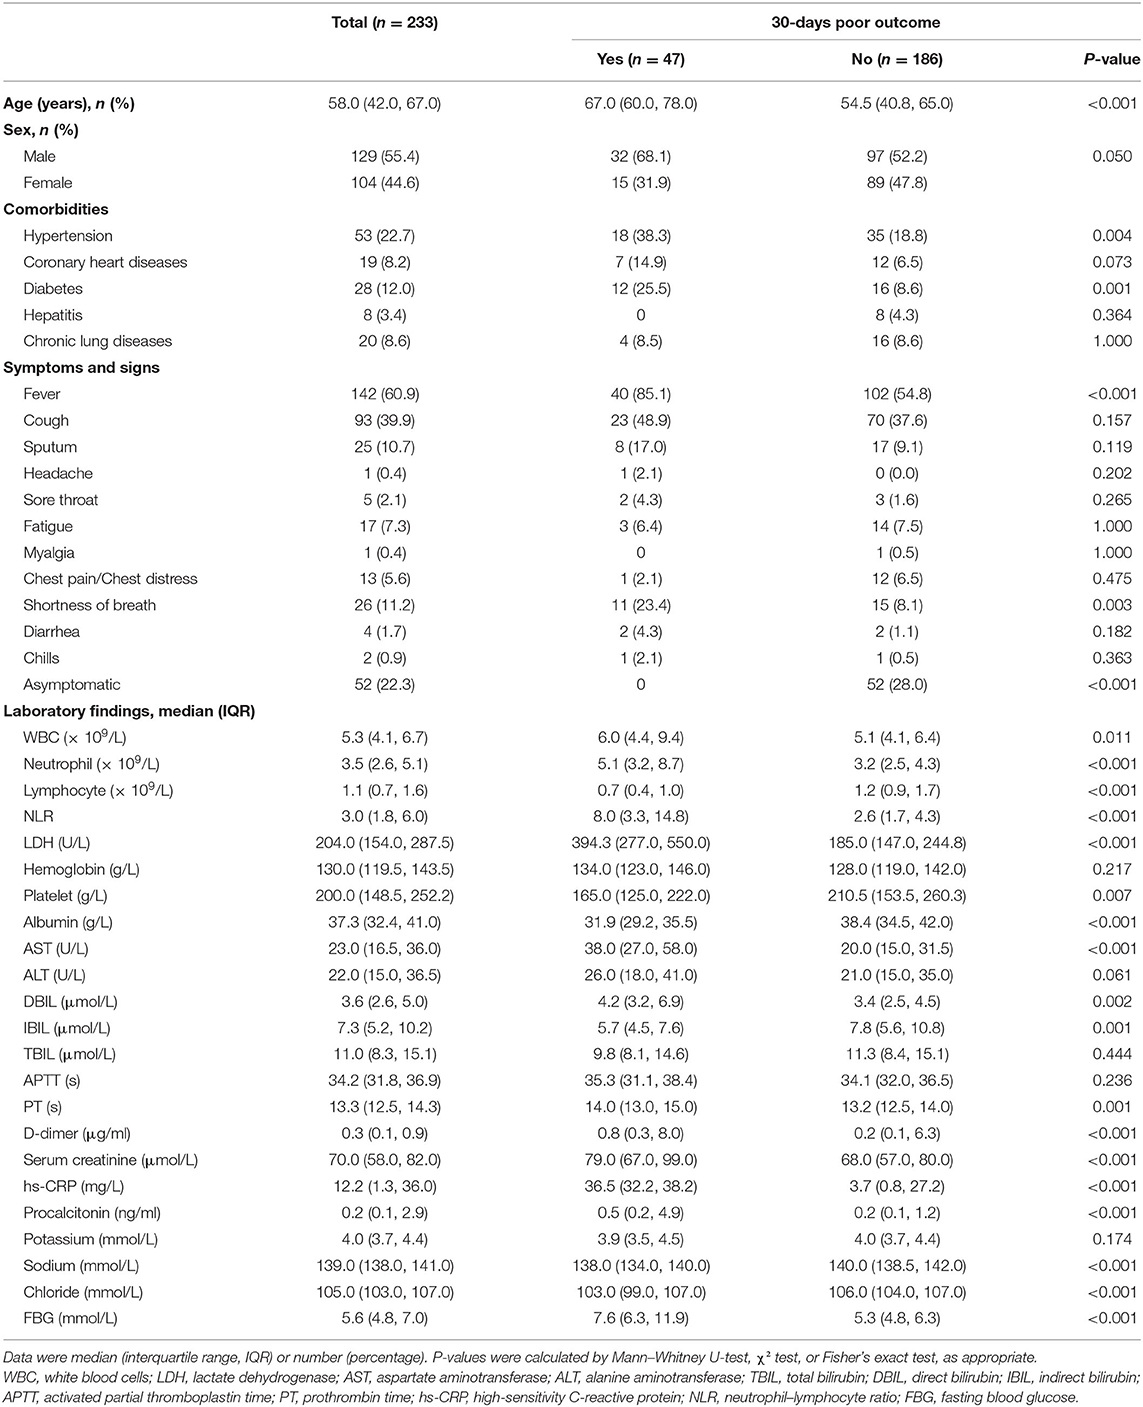
Table 1. Clinical and laboratory characteristics among patients in the primary cohort with or without poor outcome.
Three laboratory parameters uric acid, creatine kinase, and creatine kinase MB with missing value >15% were excluded for the variable selection. Most of the variables remained relatively independent in this study (PCC <0.9), with only one pair of variable coefficients exceeding 0.86 (serum creatinine and procalcitonin). Thus, procalcitonin with low correlation with 30-days poor outcome in hospitalized patients with COVID-19 was removed after PCC analysis, and the remaining 31 variables were initially selected. Then, eight superior variables with non-zero coefficients were identified across 5-fold cross-validation using the LASSO regression, with the optimization tuning parameter of 0.051 (Figure 1). Supplementary Figure 1 depicts the value distribution of the identified eight superior clinical variables in patients with good or poor 30-days outcome across all the cohorts. In Figure 2, the clinical score constructed by linearly integrating the eight clinical variables achieved an AUC of 0.943 (95% CI: 0.927–0.957), sensitivity of 96.8%, specificity of 82.4%, accuracy of 85.2%, PPV of 58.0%, and NPV of 99.0% in the training cohort and an AUC of 0.934 (95% CI: 0.894–0.963), sensitivity of 93.6%, specificity of 80.7%, accuracy of 83.3%, PPV of 55.0%, and NPV of 98.0% in the internal validation cohort. When tested, the clinical score yielded excellent performance in the external validation cohort 1 (AUC, 0.946, 95% CI: 0.886–0.980; sensitivity, 100%; specificity, 76.5%; accuracy, 79.1%; PPV, 34.3%; and NPV, 100%), and external validation cohort 2 (AUC, 0.878, 95% CI: 0.805–0.931; sensitivity, 79.0%; specificity, 83.8%; accuracy, 82.2%; PPV, 46.9%; and NPV, 95.3%). The patients could be stratified into low-risk or high-risk group according to the optimal cutoff value of 0.190.
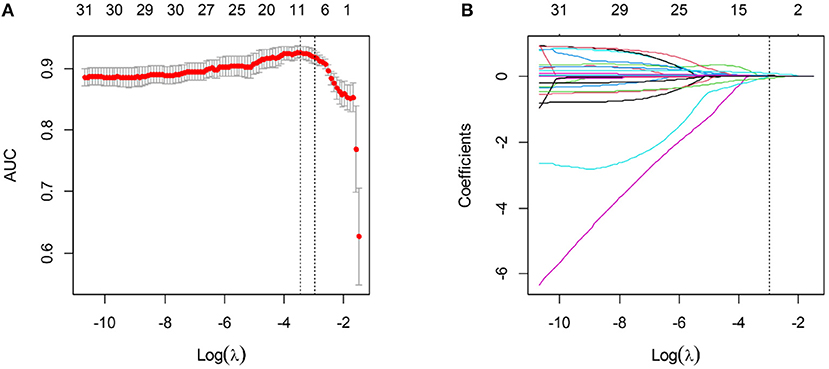
Figure 1. Variable selection using the LASSO algorithm. (A) The optimal tuning parameter λ was selected based on the minimum criteria of AUC using 5-fold cross-validation. λ adjusts the regularization penalty to control the complexity of the clinical score, and the optimal value was 0.051. (B) LASSO coefficient profiles of the variables. The vertical line was drawn at the selected log (λ), where eight clinical variables with non-zero coefficients were selected.
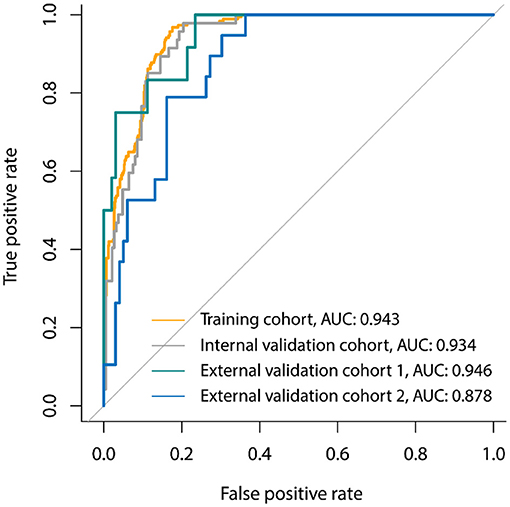
Figure 2. Receiver-operator characteristic (ROC) curves of the clinical signature for 30-days poor outcome prediction in the primary cohort, internal validation cohort, and two external validation cohorts.
A clinical nomogram was provided for the convenience of clinical score calculation (Figure 3A). Figure 3B shows the clinical-CT nomogram integrating the eight valuable clinical variables with the CT score. Akaike information criterion (AIC) of the two nomograms were −506.61 and −505.45, respectively. The clinical-CT nomogram yielded an AUC of 0.936 (95% CI: 0.917–0.951), sensitivity of 94.6%, specificity of 78.8%, accuracy of 81.8%, PPV of 52.0%, and NPV of 98.4% in the training cohort and AUC of 0.877 (95% CI: 0.825–0.918), sensitivity of 85.7%, specificity of 72.7%, accuracy of 75.2%, PPV of 43.4%, and NPV of 95.4% in the internal validation cohort. The clinical-CT nomogram achieved good performance in the external validation cohort 1 (AUC, 0.943, 95% CI: 0.882–0.979; sensitivity, 75.0%; specificity, 89.7%; accuracy, 88.1%; PPV, 47.4%; and NPV, 96.7%) and the external validation cohort 2 (AUC, 0.872, 95% CI: 0.796–0.928; sensitivity, 50.0%; specificity, 90.6%; accuracy, 83.9%; PPV, 43.8%; and NPV, 90.6%). However, AUCs of the clinical score and clinical-CT score were not significantly different in two external validation cohorts (p = 0.807 and 0.486) (Supplementary Figure 2). The cutoff value of clinical-CT score was 0.204, which could stratify patients into a low-risk or high-risk group. Figure 4 shows the comparison of clinical score and clinical-CT score between the patients with good and poor outcome, with significant differences in all the cohorts (all p < 0.0001). Supplementary Figure 3 shows the calibration curves of the clinical nomogram and clinical-CT nomogram.
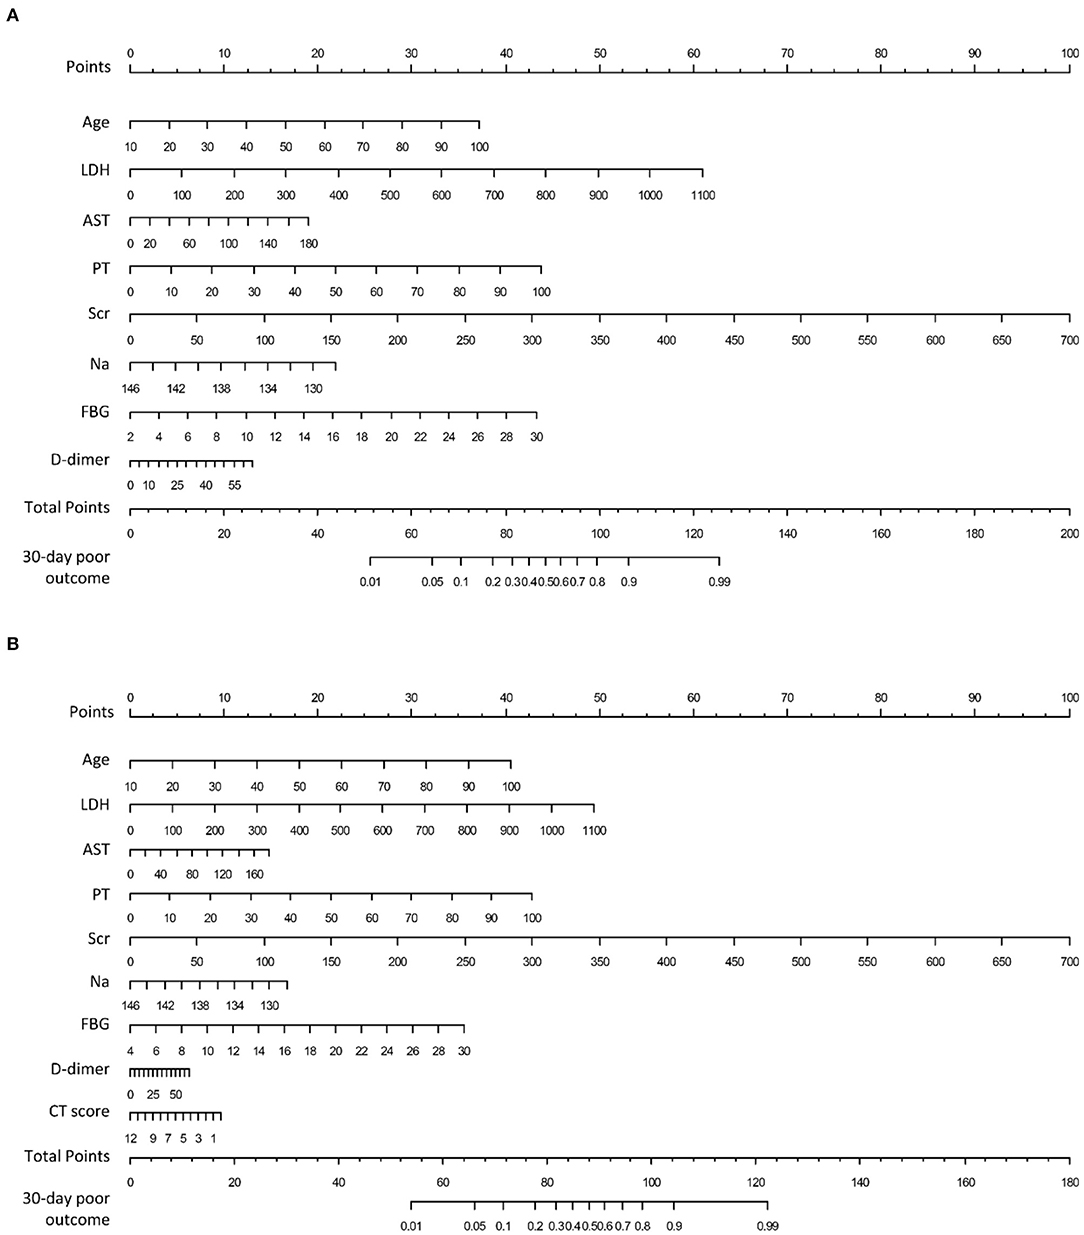
Figure 3. Nomograms to predict 30-days poor outcome in patients hospitalized for COVID-19. (A) Clinical nomogram constructed by linearly integrating the eight clinical variables; (B) clinical-CT nomogram constructed by linearly integrating the eight clinical variables and CT score. LDH, lactic dehydrogenase; AST, aspartate aminotransferase, PT, prothrombin time; Scr, serum creatinine; Na, serum sodium; FBG, fasting blood glucose.
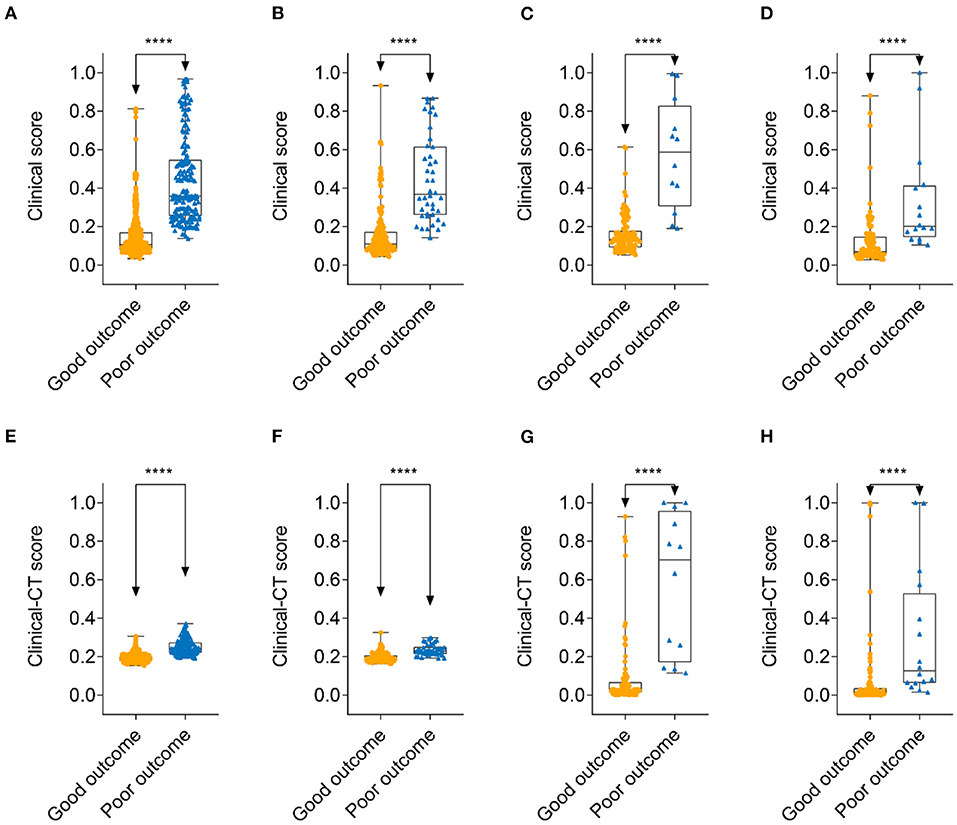
Figure 4. Comparison of clinical score and clinical-CT score between patients with 30-days good outcome and poor outcome. Clinical score: (A) training cohort; (B) internal validation cohort; (C) external validation cohort 1; and (D) external validation cohort 2. Clinical-CT score: (E) training cohort; (F) internal validation cohort; (G) external validation cohort 1; and (H) external validation cohort 2. ****denotes p < 0.0001.
The area under the decision curves shows the clinical utility of corresponding strategies. The clinical-CT nomogram (blue) showed more net benefit than that of clinical nomogram (green) or CT score (yellow), which were better than the “treat all” (gray) or “treat none” (black) strategies, indicating better clinical application of the clinical-CT nomogram. The decision curve (Figure 5A) and CIC (Figure 5B) showed that the clinical-CT nomogram had superior standardized net benefit and impact on the outcome of COVID-19 patients.
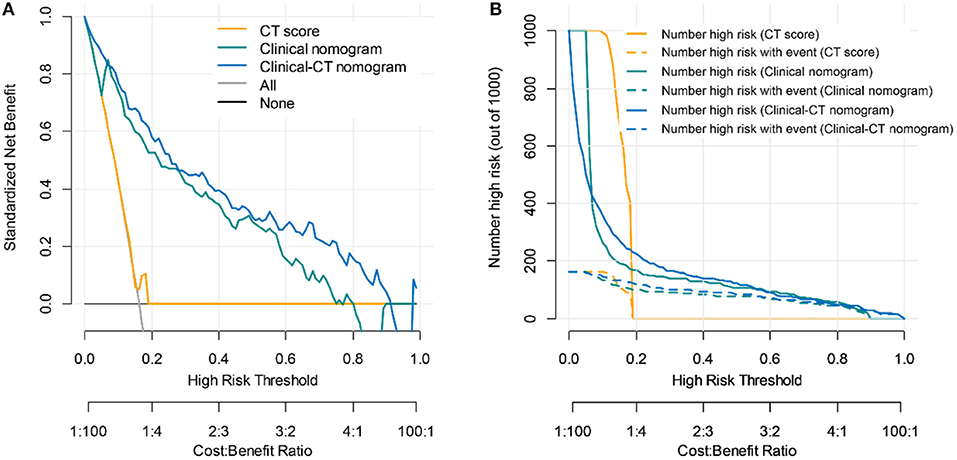
Figure 5. Clinical utility evaluation of the clinical score, CT nomogram, and clinical-CT nomogram for 30-days poor outcome prediction. (A) Decision curve analysis. Net benefit curves are plotted across risk or probability thresholds for an event (critical illness) for five options: “treat all” as if they are critically ill, “treat none” considering none is critically ill, treat according to critical illness by CT score, clinical nomogram, and clinical-CT nomogram. (B) Clinical impact curve of the CT score, clinical nomogram, and clinical-CT nomogram plotted the number of COVID-19 patients classified as high risk, and the number of cases classified high risk with severe COVID-19 at each high-risk threshold. The dotted yellow, green, and blue curves (number of high-risk individuals with outcome) denote the number of true positives at each threshold probability. The solid yellow, green, and blue lines (number of high-risk individuals) indicate the number of people who are classified as positive (high risk) by the CT score, clinical nomogram, and clinical-CT nomogram at each threshold probability.
Due to the challenges that arise during the ongoing COVID-19 pandemic, we call for robust tools to aid in making complex clinical decisions. Clinical management of COVID-19 requires frequent monitoring and re-assessment of patients who may suffer from deterioration. Our models provide a reliable and accurate tool for risk quantification for 30-days poor outcome among COVID-19 patients during hospitalization. Our models exhibited relatively good discriminatory power, and external verification was also satisfactory. Of note, our models were applicable for guiding clinical decision-making.
Several elements of the clinical nomogram have been either established as prognostic markers or identified as risk factors for severe illness or death in patients with COVID-19. Elderly people are at higher risks for chronic diseases and more susceptible to COVID-19 infection (4). Older age is identified as a well-known risk factor for worse outcomes (e.g., respiratory failure and ICU admission) among patients with COVID-19 partially because age-related immune dysfunctions result from low-grade chronic inflammation (14). In addition, elderly patients were more likely to have underlying comorbidities, such as hypertension, diabetes, chronic lung disease, and cardiovascular disease, which complicated the treatment of COVID-19 and deteriorated the severity of disease.
Although the lung is the most affected organ by COVID-19, other organ dysfunction, including liver, kidney cardiac, and coagulation dysfunction, indicates poor survival outcomes (25). Although LDH is not a marker of a specific organ, the rise in LDH level indicates an increase in the activity and extent of lung injury, especially in critically ill patients with COVID-19 (26). AST elevation was common and may be due to cholangiocyte dysfunction and other causes, such as drug-induced and systemic inflammatory response-induced liver injuries (27). Liver injury was independently associated with the need for ICU admission, mechanical ventilation, and/or death in COVID-19 patients (27). Previous studies suggested a 3–11% incidence of acute kidney injury (AKI) in patients with COVID-19 (28). Around 9.6 and 13.7% of patients had elevated serum creatinine and blood urea nitrogen, respectively (28). The etiology of AKI in COVID-19 is thought to be multifactorial, and the mechanism of kidney involvement may include direct cellular injury due to the virus or sepsis leading to cytokine storm syndrome (29). AKI is closely associated with the severity and prognosis of COVID-19 patients (30). Coagulation dysfunction is more common in patients with severe and critically ill COVID-19. Elevation of PT and D-dimer indicated a hypercoagulable state in patients at the early stage, which was an independent predictor of requiring critical care support or in-hospital mortality (31, 32). The coagulation indicators such as D-dimer and PT should be monitored as early as possible in order to detect thrombotic complications. We strongly suggest that special care of multiple organ dysfunction should be included in the treatment of patients with COVID-19 during hospitalization.
While serum sodium has not yet been related to COVID-19, it has been independently and consistently associated with adverse outcomes in other populations (33) and disease states (34, 35). Previous studies showed that admission FBG was an independent predictor for poor prognosis of COVID-19 patients (36, 37). Hyperglycemia is mainly caused by pre-existing diabetes and stress-induced hyperglycemia. Diabetes has been identified as an important risk factor for mortality and progression in COVID-19 patients (38). In addition to pre-existing diabetes, elevation of FBG level at admission could also be due to stress hyperglycemia. Stress hyperglycemia is common in patients without diabetes, which is more concerning in clinical practice. Stress hyperglycemia may be induced by a decrease of both insulin secretion and the worsening of insulin resistance; it may produce organ damage by inducing endothelial dysfunction and thrombosis through the glycation process and oxidative stress generation (39). Glucose control helps prevent and control infections and their complications (40). Accordingly, well-controlled blood glucose may lead to improved outcomes of patients with COVID-19.
Chest CT plays an indispensable role in the detection, diagnosis, and follow-up of COVID-19 pneumonia. Visual CT score is a semi-quantitative marker that can assess the disease severity of COVID-19 according to lung involvement in the clinical setting (41). The index is simple, reproducible, and readily available in daily practice without image post-processing. However, it is usually visually calculated by radiologists, which is somewhat subjective with variability that unable to quantitatively assess the disease severity and is also time-consuming (42). Despite these limitations, some previous studies suggested that CT score was highly correlated with laboratory findings and disease severity, which could serve as a biomarker of predicting the outcome of COVID-19 patients (41, 43–51). However, our study might suggest that admission CT score is not a significant predictor for longer-term prognosis. Interestingly, although adding CT score to the clinical nomogram could not improve the predictive performance, the combination of both had more net benefit than clinical nomogram alone.
Based on the identified predictors, clinical nomogram was developed for doctors to quickly assess the risk with sample clinical and laboratory features and facilitated early decision making of COVID-19. Nomogram as the visualization of these models could serve as a simple tool for physicians and patients to calculate individual risk. Our model is able to stratify COVID-19 patients into low- and high-risk groups for developing 30-days poor outcome. The clinical usefulness of our models was tested, and the results showed that although the clinical nomogram and clinical-CT nomogram shared similar discrimination power, the latter had a better clinical application. Several previous studies also showed the clinical usefulness of prognostic models in the management of COVID-19 patients (52–60).
This study also has some potential limitations. First, we included the retrospective nature of the sample that may introduce potential risks of bias in the data particularly if this involved convenience sampling or potentially crucial predictors were not available. Second, the training and validation of the model are restricted to several populations in China; further validation using external populations would improve the generalizability of the model. Third, CT score is somewhat subjective with large intra- and inter-observer variability obtained from the initial CT examination; CT-based radiomics or deep learning and follow-up CT scan may provide more prognostic information. Fourth, indicators of cardiac injury such as creatine kinase and creatine kinase MB were not analyzed due to insufficient data. This may limit the model fit and introduce bias if the data were not missing at random. Fifth, the potential duration of infection prior to presentation need not be indicated, which may be useful to assess rate of progression of infection in patients independently of biomarkers used in this study. Sixth, this model was not applicable for patients with critical illness at admission, which may result in inclusion bias. Seventh, COVID-19 triaging might lead to less severe cases having delayed testing, thereby skewing the inclusion set to a more critical status; thus, the performance of model may be overestimated. Eighth, self-medication of patients before admission may affect the clinical and laboratory results, but it should have no major effect on the models as long as these medications were random. Finally, the identification of predictors depends on available features, feature selection method used, and sample size of studies.
This study developed and externally validated a simple predictive model of 30-days poor outcome for hospitalized patients with COVID-19 based on objective data that are routinely used in clinical setting. Clinical nomogram integrated eight optimal predictors of 30-days poor outcome, including age, lactic dehydrogenase, aspartate aminotransferase, prothrombin time, D-dimer, serum creatinine, serum sodium, and fasting blood glucose. We found that older age, multiple organ dysfunction, hyponatremia, and hyperglycemia were key prognostic factors of COVID-19 patients. Although the addition of CT score to the clinical nomogram could not enhance its predictive performance, the combination of eight clinical predictors and CT score might be more clinically useful than clinical nomogram alone. Early detection of patients who are likely to develop poor outcome is of great importance, which may help select patients at risk of rapid deterioration who should require high-level monitoring and more aggressive treatment.
The original contributions presented in the study are included in the article/Supplementary Materials, further inquiries can be directed to the corresponding author/s.
The studies involving human participants were reviewed and approved by The First Affiliated Hospital of Jinan University. The ethics committee waived the requirement of written informed consent for participation.
SZ, QZ, BZ, and QL designed the study. XZ, SL, and WC analyzed and interpreted the data. ML, ZC, LvC, and YD collected the data. JY, QC, and LuC supervised the data. BZ and QL wrote the original draft of the manuscript. All authors contributed to the final editing.
This work was supported by a grant of the National Natural Science Foundation of China (grant number: 81571664, 81871323, and 81801665), the National Natural Science Foundation of Guangdong Province (grant number: 2018B030311024), the Scientific Research General Project of Guangzhou Science Technology and Innovation Commission (grant number: 201707010328), and the China Postdoctoral Science Foundation (grant number: 2016M600145).
The authors declare that the research was conducted in the absence of any commercial or financial relationships that could be construed as a potential conflict of interest.
The Supplementary Material for this article can be found online at: https://www.frontiersin.org/articles/10.3389/fmed.2020.590460/full#supplementary-material
1. Wiersinga WJ, Rhodes A, Cheng AC, Peacock SJ, Prescott HC. Pathophysiology, transmission, diagnosis, and treatment of coronavirus disease 2019 (COVID-19): a review. JAMA. (2020) 324:782–93. doi: 10.1001/jama.2020.12839
2. World Health Organization. Coronavirus disease (2019). (COVID-19) Situation Report −171. Available online at: https://www.who.int/emergencies/diseases/novel-coronavirus-2019/situation-reports (accessed July 12, 2020).
3. Wu Z, McGoogan JM. Characteristics of and important lessons from the coronavirus disease 2019 (COVID-19) outbreak in China: summary of a report of 72 314 cases from the Chinese center for disease control and prevention. JAMA. (2020) 323:1239–42. doi: 10.1001/jama.2020.2648
4. Chen N, Zhou M, Dong X, Qu J, Gong F, Han Y, et al. Epidemiological and clinical characteristics of 99 cases of 2019 novel coronavirus pneumonia in Wuhan, China: a descriptive study. Lancet. (2020) 395:507–13. doi: 10.1016/S0140-6736(20)30211-7
5. Alimadadi A, Aryal S, Manandhar I, Munroe PB, Joe B, Cheng X. Artificial intelligence and machine learning to fight COVID-19. Physiol Genomics. (2020) 52:200–2. doi: 10.1152/physiolgenomics.00029.2020
6. Bzdok D, Altman N, Krzywinski M. Statistics versus machine learning. Nat Methods. (2018) 15:233–4. doi: 10.1038/nmeth.4642
7. Sun Y, Todorovic S, Goodison S. Local-learning-based feature selection for high-dimensional data analysis. IEEE Trans Pattern Anal Mach Intell. (2010) 32:1610–26. doi: 10.1109/TPAMI.2009.190
8. Wu G, Yang P, Xie Y, Woodruff HC, Rao X, Guiot J, et al. Development of a clinical decision support system for severity risk prediction and triage of COVID-19 patients at hospital admission: an international multicenter study. Eur Respir J. (2020) 56:2001104. doi: 10.1183/13993003.01104-2020
9. Ji D, Zhang D, Xu J, Chen Z, Yang T, Zhao P, et al. Prediction for progression risk in patients with COVID-19 pneumonia: the CALL score. Clin Infect Dis. (2020) 71:1393–9. doi: 10.1093/cid/ciaa414
10. Liang W, Liang H, Ou L, Chen B, Chen A, Li C, et al. Development and validation of a clinical risk score to predict the occurrence of critical illness in hospitalized patients with COVID-19. JAMA Intern Med. (2020) 180:1081–9. doi: 10.1001/jamainternmed.2020.2033
11. Dong YM, Sun J, Li YX, Chen Q, Liu QQ, Sun Z, et al. Development and validation of a nomogram for assessing survival in patients with COVID-19 pneumonia. Clin Infect Dis. (2020) 10:ciaa963. doi: 10.1093/cid/ciaa963
12. Dong Y, Zhou H, Li M, Zhang Z, Guo W, Yu T, et al. A novel simple scoring model for predicting severity of patients with SARS-CoV-2 infection. Transbound Emerg Dis. (2020) 67:2823–9. doi: 10.1111/tbed.13651
13. Yan L, Zhang H, Goncalves J, Yang X, Maolin W, Yuqi G, et al. An interpretable mortality prediction model for COVID-19 patients. Nat Mach Intell. (2020) 2:283–8. doi: 10.1038/s42256-020-0180-7
14. Wang K, Zuo P, Liu Y, Zhang M, Zhao X, Xie S, et al. Clinical and laboratory predictors of in-hospital mortality in patients with COVID-19: a cohort study in Wuhan, China. Clin Infect Dis. (2020) 71:2079–88 doi: 10.1093/cid/ciaa538
15. Van Calster B, Wynants L, Verbeek JFM, Verbakel JY, Christodoulou E, Vickers AJ, et al. Reporting and interpreting decision curve analysis: a guide for investigators. Eur Urol. (2018) 74:796–804. doi: 10.1016/j.eururo.2018.08.038
16. Fitzgerald M, Saville BR, Lewis RJ. Decision curve analysis. JAMA. (2015) 313:409–10. doi: 10.1001/jama.2015.37
17. Chung M, Bernheim A, Mei X, Zhang N, Huang M, Zeng X, et al. CT imaging features of 2019 novel coronavirus (2019-nCoV). Radiology. (2020) 295:202–7. doi: 10.1148/radiol.2020200230
18. Wu S, Shen G, Mao J, Gao B. CT radiomics in predicting EGFR mutation in non-small cell lung cancer: a single institutional study. Front Oncol. (2020) 10:542957. doi: 10.3389/fonc.2020.542957
19. Liu H, Zhang C, Wang L, Luo R, Li J, Zheng H, et al. MRI radiomics analysis for predicting preoperative synchronous distant metastasis in patients with rectal cancer. Eur Radiol. (2019) 29:4418–26. doi: 10.1007/s00330-018-5802-7
20. Cui Y, Liu H, Ren J, Du X, Xin L, Li D, et al. Development and validation of a MRI-based radiomics signature for prediction of KRAS mutation in rectal cancer. Eur Radiol. (2020) 30:1948–58. doi: 10.1007/s00330-019-06572-3
21. Hegendörfer E, Vaes B, Van Pottelbergh G, Matheï C, Verbakel J, Degryse JM. Predictive accuracy of frailty tools for adverse outcomes in a cohort of adults 80 years and older: a decision curve analysis. J Am Med Dir Assoc. (2020) 21:440.e1–e8. doi: 10.1016/j.jamda.2019.08.029
22. Ho-Le TP, Tran HTT, Center JR, Eisman JA, Nguyen HT, Nguyen TV. Assessing the clinical utility of genetic profiling in fracture risk prediction: a decision curve analysis. Osteoporos Int. (2020). doi: 10.1007/s00198-020-05403-2
23. National Health Commission of the People's Republic of China. Guidelines for the Diagnosis and Treatment of Novel Coronavirus (2019-nCoV) Infection (Trial Version 7). National Health Commission of the People's Republic of China (2020).
24. Metlay JP, Waterer GW, Long AC, Anzueto A, Brozek J, Crothers K, et al. Diagnosis and treatment of adults with community-acquired pneumonia. An official clinical practice guideline of the American thoracic society and infectious diseases society of America. Am J Respir Crit Care Med. (2019) 200:e45–67. doi: 10.1164/rccm.201908-1581ST
25. Feng Y, Ling Y, Bai T, Xie Y, Huang J, Li J, et al. COVID-19 with different severities: a multicenter study of clinical features. Am J Respir Crit Care Med. (2020) 201:1380–8. doi: 10.1164/rccm.202002-0445OC
26. Kishaba T, Tamaki H, Shimaoka Y, Fukuyama H, Yamashiro S. Staging of acute exacerbation in patients with idiopathic pulmonary fibrosis. Lung. (2014) 192:141–9. doi: 10.1007/s00408-013-9530-0
27. Yip TC, Lui GC, Wong VW, Chow VC, Ho TH, Li TC, et al. Liver injury is independently associated with adverse clinical outcomes in patients with COVID-19. Gut. (2020). doi: 10.1136/gutjnl-2020-321726
28. Yang X, Jin Y, Li R, Zhang Z, Sun R, Chen D. Prevalence and impact of acute renal impairment on COVID-19: a systematic review and meta-analysis. Crit Care. (2020) 24:356. doi: 10.1186/s13054-020-03065-4
29. Brienza N, Puntillo F, Romagnoli S, Tritapepe L. Acute kidney injury in coronavirus disease 2019 infected patients: a meta-analytic study. Blood Purif. (2020). doi: 10.1159/000509274
30. Hirsch JS, Ng JH, Ross DW, Sharma P, Shah HH, Barnett RL, et al. Acute kidney injury in patients hospitalized with COVID-19. Kidney Int. (2020) 98:209–18. doi: 10.1016/j.kint.2020.05.006
31. Long H, Nie L, Xiang X, Li H, Zhang X, Fu X, et al. D-dimer and prothrombin time are the significant indicators of severe COVID-19 and poor prognosis. Biomed Res Int. (2020) 2020:6159720. doi: 10.1155/2020/6159720
32. Tang N, Li D, Wang X, Sun Z. Abnormal coagulation parameters are associated with poor prognosis in patients with novel coronavirus pneumonia. J Thromb Haemost. (2020) 18:844–7. doi: 10.1111/jth.14768
33. Zhang X, Li XY. Prevalence of hyponatremia among older inpatients in a general hospital. Eur Geriatr Med. (2020) 11:685–92. doi: 10.1007/s41999-020-00320-3
34. Ruf AE, Kremers WK, Chavez LL, Descalzi VI, Podesta LG, Villamil FG. Addition of serum sodium into the MELD score predicts waiting list mortality better than MELD alone. Liver Transpl. (2005) 11:336–43. doi: 10.1002/lt.20329
35. Kim EJ, Jeong MH, Kim JH, Ahn TH, Seung KB, Oh DJ, et al. Clinical impact of admission hyperglycemia on in-hospital mortality in acute myocardial infarction patients. Int J Cardiol. (2017) 236:9–15. doi: 10.1016/j.ijcard.2017.01.095
36. Wang S, Ma P, Zhang S, Song S, Wang Z, Ma Y, et al. Fasting blood glucose at admission is an independent predictor for 28-day mortality in patients with COVID-19 without previous diagnosis of diabetes: a multi-centre retrospective study. Diabetologia. (2020) 63:2102–11. doi: 10.1007/s00125-020-05209-1
37. Zhang B, Liu S, Zhang L, Dong Y, Zhang S. Admission fasting blood glucose predicts 30-day poor outcome in patients hospitalized for COVID-19 pneumonia. Diabetes Obes Metab. (2020) 6:14132. doi: 10.1111/dom.14132
38. Wu J, Zhang J, Sun X, Wang L, Xu Y, Zhang Y, et al. Influence of diabetes mellitus on the severity and fatality of SARS-CoV-2 (COVID-19) infection. Diabetes Obes Metab. (2020) 22:1907–14. doi: 10.1111/dom.14105
39. Ceriello A, De Nigris V, Prattichizzo F. Why is hyperglycaemia worsening COVID-19 and its prognosis? Diabetes Obes Metab. (2020) 22:1951–2. doi: 10.1111/dom.14098
40. Zhu L, She ZG, Cheng X, Qin JJ, Zhang XJ, Cai J, et al. Association of blood glucose control and outcomes in patients with COVID-19 and pre-existing type 2 diabetes. Cell Metab. (2020) 31:1068–77.e3. doi: 10.1016/j.cmet.2020.04.021
41. Francone M, Iafrate F, Masci GM, Coco S, Cilia F, Manganaro L, et al. Chest CT score in COVID-19 patients: correlation with disease severity and short-term prognosis. Eur Radiol. (2020) 30:6808–17. doi: 10.1007/s00330-020-07033-y
42. Yin X, Min X, Nan Y, Feng Z, Li B, Cai W, et al. Assessment of the severity of coronavirus disease: quantitative computed tomography parameters versus semiquantitative visual score. Korean J Radiol. (2020) 21:998–1006. doi: 10.3348/kjr.2020.0423
43. Mahdjoub E, Mohammad W, Lefevre T, Debray MP, Khalil A, Study Group. Admission chest CT score predicts 5-day outcome in patients with COVID-19. Intensive Care Med. (2020) 46:1648–50. doi: 10.1007/s00134-020-06118-y
44. Zhang J, Meng G, Li W, Shi B, Dong H, Su Z, et al. Relationship of chest CT score with clinical characteristics of 108 patients hospitalized with COVID-19 in Wuhan, China. Respir Res. (2020) 21:180. doi: 10.1186/s12931-020-01440-x
45. Yuan M, Yin W, Tao Z, Tan W, Hu Y. Association of radiologic findings with mortality of patients infected with 2019 novel coronavirus in Wuhan, China. PLoS ONE. (2020) 15:e0230548. doi: 10.1371/journal.pone.0230548
46. Xie H, Zhao J, Lian N, Lin S, Xie Q, Zhuo H. Clinical characteristics of non-ICU hospitalized patients with coronavirus disease 2019 and liver injury: a retrospective study. Liver Int. (2020) 40:1321–6. doi: 10.1111/liv.14449
47. Sabri A, Davarpanah AH, Mahdavi A, Abrishami A, Khazaei M, Heydari S, et al. Novel coronavirus disease 2019: predicting prognosis with a computed tomography-based disease severity score and clinical laboratory data. Pol Arch Intern Med. (2020) 130:629–34. doi: 10.20452/pamw.15422
48. Dai M, Liu X, Zhu X, Liu T, Xu C, Ye F, et al. Temporal changes of CT findings between non-severe and severe cases of COVID-19 pneumonia: a multi-center, retrospective, longitudinal Study. Int J Med Sci. (2020) 17:2653–62. doi: 10.7150/ijms.51159
49. Wang W, Zhao Z, Liu X, Liu G, Xie D, Xu Z, et al. Clinical features and potential risk factors for discerning the critical cases and predicting the outcome of patients with COVID-19. J Clin Lab Anal. (2020) 34:e23547. doi: 10.1002/jcla.23547
50. Wang X, Hu X, Tan W, Mazzone P, Mireles-Cabodevila E, Han XZ, et al. Multi-center study of temporal changes and prognostic value of a CT visual severity score in hospitalized patients with COVID-19. AJR Am J Roentgenol. (2020). doi: 10.2214/AJR.20.24044
51. Davarpanah AH, Asgari R, Moharamzad Y, Mahdavi A, Abrishami A, Nekooghadam S, et al. Risk factors for poor outcome in patients with severe viral pneumonia on chest CT during the COVID-19 outbreak: a perspective from Iran. SN Compr Clin Med. (2020) 19:1–11. doi: 10.1007/s42399-020-00445-3
52. Pan D, Cheng D, Cao Y, Hu C, Zou F, Yu W, et al. A predicting nomogram for mortality in patients with COVID-19. Front Public Health. (2020) 8:461. doi: 10.3389/fpubh.2020.00461
53. Schalekamp S, Huisman M, van Dijk RA, Boomsma MF, Freire Jorge PJ, de Boer WS, et al. Model-based prediction of critical illness in hospitalized patients with COVID-19. Radiology. (2020). doi: 10.1148/radiol.2020202723
54. Zeng F, Deng G, Cui Y, Zhang Y, Dai M, Chen L, et al. A predictive model for the severity of COVID-19 in elderly patients. Aging. (2020) 12:20982–96. doi: 10.18632/aging.103980
55. Zhou Y, He Y, Yang H, Yu H, Wang T, Chen Z, et al. Development and validation a nomogram for predicting the risk of severe COVID-19: a multi-center study in Sichuan, China. PLoS ONE. (2020) 15:e0233328. doi: 10.1371/journal.pone.0233328
56. Chen Y, Wang Y, Zhang Y, Zhang N, Zhao S, Zeng H, et al. A quantitative and radiomics approach to monitoring ARDS in COVID-19 patients based on chest CT: a retrospective cohort study. Int J Med Sci. (2020) 17:1773–82. doi: 10.7150/ijms.48432
57. Zhou Y, He Y, Yang H, Yu H, Wang T, Chen Z, et al. Exploiting an early warning nomogram for predicting the risk of ICU admission in patients with COVID-19: a multi-center study in China. Scand J Trauma Resusc Emerg Med. (2020) 28:106. doi: 10.1186/s13049-020-00795-w
58. Chen X, Tang Y, Mo Y, Li S, Lin D, Yang Z, et al. A diagnostic model for coronavirus disease 2019 (COVID-19) based on radiological semantic and clinical features: a multi-center study. Eur Radiol. (2020) 30:4893–902. doi: 10.1007/s00330-020-06829-2
59. Song C, Dong Z, Gong H, Liu XP, Dong X, Wang A, et al. An online tool for predicting the prognosis of cancer patients with SARS-CoV-2 infection: a multi-center study. J Cancer Res Clin Oncol. (2020). doi: 10.1007/s00432-020-03420-6
Keywords: nomogram, poor outcome, COVID-19, CT score, clinical usefulness
Citation: Zhang B, Liu Q, Zhang X, Liu S, Chen W, You J, Chen Q, Li M, Chen Z, Chen L, Chen L, Dong Y, Zeng Q and Zhang S (2020) Clinical Utility of a Nomogram for Predicting 30-Days Poor Outcome in Hospitalized Patients With COVID-19: Multicenter External Validation and Decision Curve Analysis. Front. Med. 7:590460. doi: 10.3389/fmed.2020.590460
Received: 01 August 2020; Accepted: 18 November 2020;
Published: 23 December 2020.
Edited by:
Marc Jean Struelens, Université Libre de Bruxelles, BelgiumReviewed by:
Hamish McManus, Kirby Institute, AustraliaCopyright © 2020 Zhang, Liu, Zhang, Liu, Chen, You, Chen, Li, Chen, Chen, Chen, Dong, Zeng and Zhang. This is an open-access article distributed under the terms of the Creative Commons Attribution License (CC BY). The use, distribution or reproduction in other forums is permitted, provided the original author(s) and the copyright owner(s) are credited and that the original publication in this journal is cited, in accordance with accepted academic practice. No use, distribution or reproduction is permitted which does not comply with these terms.
*Correspondence: Qingsi Zeng, emVuZ3FpbmdzaUBnemhtdS5lZHUuY24=; Shuixing Zhang, c2h1aTc1MTVAMTI2LmNvbQ==
†These authors have contributed equally to this work
Disclaimer: All claims expressed in this article are solely those of the authors and do not necessarily represent those of their affiliated organizations, or those of the publisher, the editors and the reviewers. Any product that may be evaluated in this article or claim that may be made by its manufacturer is not guaranteed or endorsed by the publisher.
Research integrity at Frontiers
Learn more about the work of our research integrity team to safeguard the quality of each article we publish.