 Kaiyu Pan
 Xiaocong Yao2
 Zhongxin Zhu
94% of researchers rate our articles as excellent or good
Learn more about the work of our research integrity team to safeguard the quality of each article we publish.
Find out more
ORIGINAL RESEARCH article
Front. Med., 09 June 2020
Sec. Nephrology
Volume 7 - 2020 | https://doi.org/10.3389/fmed.2020.00255
Aims: Evidence linking serum uric acid (sUA) and bone mineral density (BMD) in adolescents is very limited. To the best of our knowledge, only one report has focused on the relationship between sUA and BMD in adolescents. Thus, this study aimed to determine the association between sUA and total BMD in adolescents aged 12–19 years.
Methods: A cross-sectional study was conducted on a sample composed of non-institutionalized US population from the National Health and Nutrition Examination Survey. Weighted multivariate linear regression models were used to evaluate the association between sUA and total BMD. Subgroup analyses were further performed.
Results: sUA positively correlated with total BMD in the multiple regression model after adjusting for potential confounders. However, in the subgroup analyses stratified by sex, age, or race/ethnicity, the association between sUA and total BMD followed an inverted U-shaped curve in female adolescents, adolescents aged 16–19 years, and other race/ethnicity.
Conclusions: Our results suggested that the correlation between sUA level and total BMD differed by sex. The increased sUA level would be beneficial to bone health in adolescents with low sUA levels, but for female adolescents, a higher sUA level (turning point, 3.9 mg/dL) may have an adverse effect on bone health.
During adolescence, bone accumulates and grows at a rapid rate. Bone mineral density (BMD) acquisition during this period is critical for bone mass accrual and skeletal formation to acquire a greater peak bone mass and therefore prevent osteoporosis at older age (1, 2). Therefore, osteoporosis is also recognized as a pediatric disease.
Clinical evaluation of osteoporosis-associated risk factors contributes to early diagnosis, prevention, and management of osteoporosis. Consequently, on-going studies are assessing the correlation of bone health with some less studied or novel biomarkers, such as serum uric acid (sUA).
Convincing experimental studies reported that antioxidants could contribute to the reduction of osteoclast activity and the activation of osteoblasts (3, 4). Conversely, reactive oxygen species could reduce the bone formation activity of osteoblasts and simultaneously stimulate the resorption activity of osteoclasts (5, 6). sUA is the most abundant non-enzymatic endogen antioxidant present in the systemic circulation and had long been recognized as a biologically inert waste product of purine metabolism; however, diagnosis of hyperuricemia is a concern because it causes gout and chronic inflammatory arthritis (7). Moreover, increasing evidence supported that higher sUA level might be beneficial for bone metabolism owing to its antioxidant properties (8).
Recent epidemiological studies reported a positive association between sUA and BMD in middle-aged and older individuals (9–15). Until now, evidence linking sUA and BMD in adolescents is very limited. To the best of our knowledge, only one report has focused on the relationship between sUA and BMD in adolescents, and the result of that cross-sectional study from Iran (221 girls and 192 boys) demonstrated a higher bone density in those who had higher UA levels (16). The prevalence of hyperuricemia in children and adolescents varies among countries, and largely depends on age, sex, ethnicity, and region (17). In addition, concentration of UA is strongly influenced by age, sex, body mass index (BMI), body composition, and other factors that also influence BMD (10, 18, 19). Therefore, based on the national population, we performed a cross-sectional study with a much larger sample to determine the association of sUA with BMD in adolescents.
In this study, data analyzed were obtained from the National Health and Nutrition Examination Survey (NHANES) (1999–2006), a complex, stratified, multistage probability sample of the non-institutionalized US population. These cross-sectional surveys are conducted by the National Center for Health Statistics (NCHS). Methodological details about the NHANES are available at www.cdc.gov/nchs/nhanes/.
The study population was limited to participants aged 12–19 years (n = 9,493) with complete data on sUA and total BMD. After exclusion of 2,173 subjects with missing sUA (n = 1,184) or total BMD (n = 989) data, 7,320 subjects aged 12–19 years remained for the final analysis.
The NCHS Ethics Review Board granted approval for the conduct of NHANES, and written informed consents were obtained from all participants (20). For participants aged <18 years, their parents/guardians provided informed consent, and participants aged ≥18 years provided informed consent on their own.
The principal variables of this study were sUA (independent variable) and total BMD (dependent variable). SUA levels were measured using a Hitachi Model 917 multichannel analyser (Roche Diagnostics, Indianapolis, IN) from 1999 to 2001 and a Beckman Synchron LX20 (Beckman Coulter, Inc., Brea, CA) in 2002. Distributions of UA results from the two laboratories were compared at the time of transition, and no significant differences were observed. Total BMD was measured by dual-energy X-ray absorptiometry.
In addition, the following covariates were included: age, sex, race/ethnicity, BMI, income-poverty ratio, physical activity, blood urea nitrogen, total protein, total cholesterol, serum phosphorus, and serum calcium. Details of sUA and total BMD measurement process and other covariate acquisition process are available at www.cdc.gov/nchs/nhanes/.
All estimates were calculated accounting for NHANES sample weights. Following adjustment for potential confounders, weighted multiple regression analyses were applied to estimate the independent relationship between sUA and total BMD. Weighted generalized additive models and smooth curve fittings were employed to address the non-linearity of sUA and total BMD in the subgroup analyses. After adjusting for the same covariates in the linear regression models, two-piecewise linear regression models were further applied to examine the threshold effect of sUA on total BMD.
Categorical variables were expressed as frequency or percentage. Continuous variables were expressed as means ± standard deviation. Weighted linear regression models (continuous variables) and weighted chi-square tests (categorical variables) were performed to calculate differences between different groups. P < 0.05 was considered statistically significant. All analyses were performed with Empower software (www.empowerstats.com; X&Y solutions, Inc., Boston MA) and R version 3.4.3 (http://www.R-project.org, The R Foundation).
Table 1 shows the description of weighted sociodemographic and medical characteristics of the participants. A total of 7,320 participants were included in this study. Of these participants, 56.91% were male, 62.22% were Whites, 14.33% were Blacks, and 11.03% were Mexican Americans. Among different groups of sUA (quartiles, Q1–Q4), age, sex, race/ethnicity, BMI, income–poverty ratio, physical activity, blood urea nitrogen, total protein, total cholesterol, serum phosphorus, serum calcium, and total BMD are all significantly different.
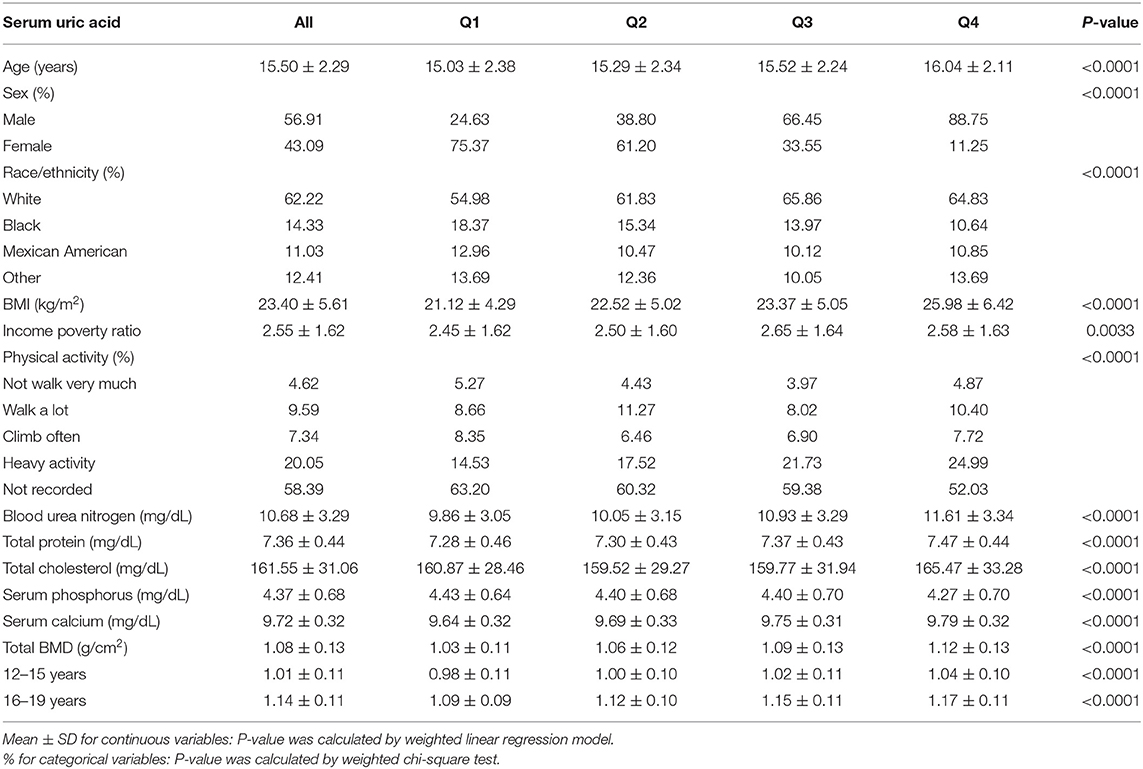
Table 1. Description of 7,320 participants included in the present study.
Three weighted univariate and multivariate linear regression models were constructed: model 1, not adjusted; model 2, age, sex, race/ethnicity were adjusted; model 3, the covariates presented in Table 1 were adjusted. In the fully-adjusted model, we observed a positive association between sUA and total BMD [0.0076 (0.0056, 0.0097)] (Table 2, Figure 1). However, when stratifying by age, sex, or race/ethnicity, this association was not significant in female adolescents [0.0014 (−0.0020, 0.0047)], adolescents aged 16–19 years [−0.0002 (−0.0032, 0.0028)], and other race/ethnicity [0.0038 (−0.0030, 0.0106)].
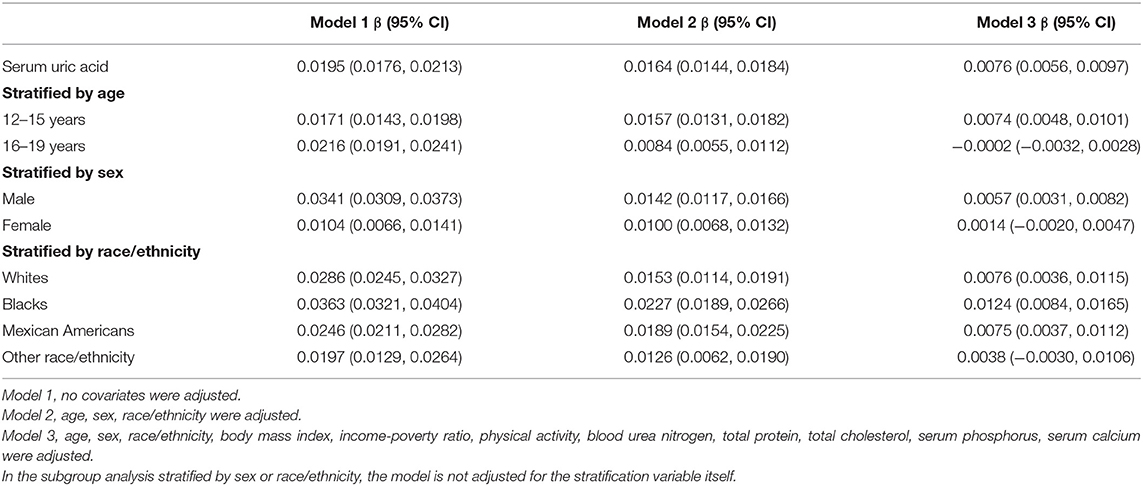
Table 2. Association of serum uric acid with total bone mineral density.
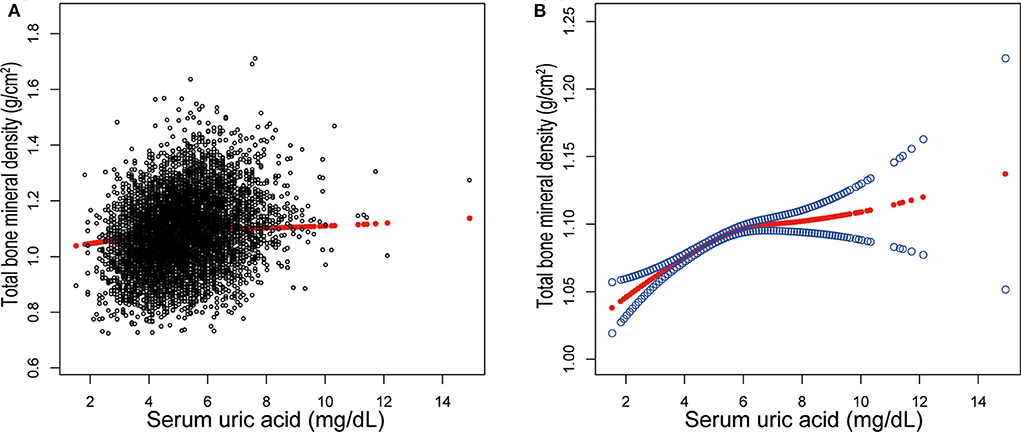
Figure 1. Correlation between serum uric acid and total bone mineral density. (A) Each black point represents a sample. (B) The area between two blue dotted lined is expressed as a 95% CI. Each point shows the magnitude of the serum uric acid and is connected to form a continuous line. Age, sex, race/ethnicity, body mass index, income poverty ratio, physical activity, blood urea nitrogen, total protein, total cholesterol, serum phosphorus, serum calcium were adjusted.
In the subgroup analysis (Table 3), sUA level was significantly associated with higher total BMD in all groups of adolescents aged 12–15 years (P for trend <0.001 for each). While in adolescents aged 16–19 years, this association did not reach statistical significance in other groups except in Black subjects (P for trend = 0.039). The strongest association was observed in 12 to 15-year-old White subjects and 12 to 15-year-old Black subjects, in whom each quartile of sUA was increased.
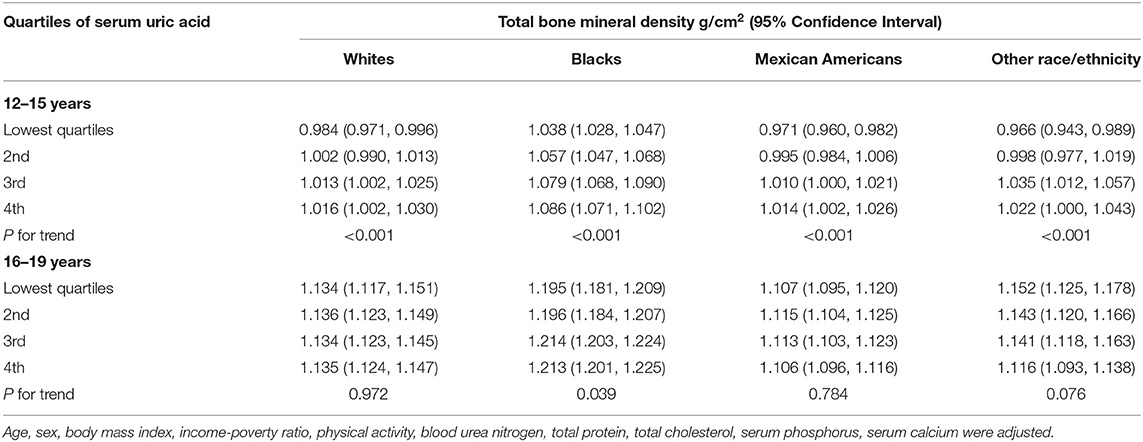
Table 3. Total bone mineral density by quartiles of serum uric acid, stratified by race/ethnicity and age.
Additionally, adjusted smoothed plots suggested non-linear relationships between sUA and total BMD, stratified by age, sex, and race/ethnicity. Total BMD increased with sUA up to the turning point in adolescents aged 16–19 years (turning point: sUA 6.3 mg/dL) (Table 4, Figure 2). Likewise, there are turning points in female adolescents (turning point: sUA 3.9 mg/dL) (Table 4, Figure 3), and in other race/ethnicity (turning point: sUA 5.4 mg/dL) (Table 4, Figure 4). Taken together, the association between sUA and total BMD in female adolescents, adolescents aged 16–19 years, and other race/ethnicity followed an inverted U-shaped curve.

Table 4. Threshold effect analysis of serum uric acid on total bone mineral density using two-piecewise linear regression.
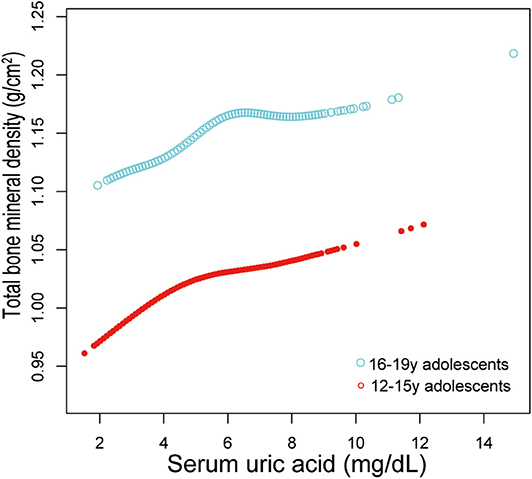
Figure 2. Serum uric acid and total bone mineral density dose–response relationship, stratified by age. Sex, race/ethnicity, body mass index, income poverty ratio, physical activity, blood urea nitrogen, total protein, total cholesterol, serum phosphorus, serum calcium were adjusted.
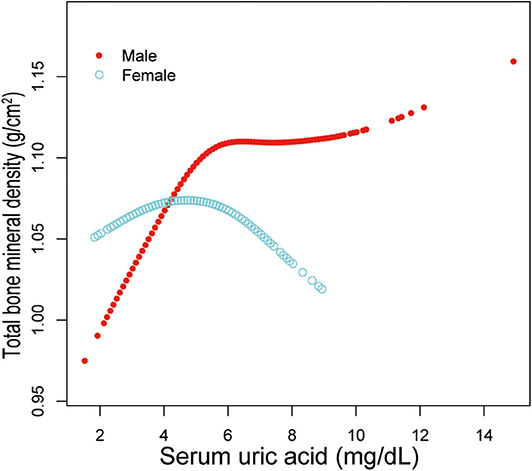
Figure 3. Serum uric acid and total bone mineral density dose–response relationship, stratified by sex. Age, race/ethnicity, body mass index, income poverty ratio, physical activity, blood urea nitrogen, total protein, total cholesterol, serum phosphorus, serum calcium were adjusted.
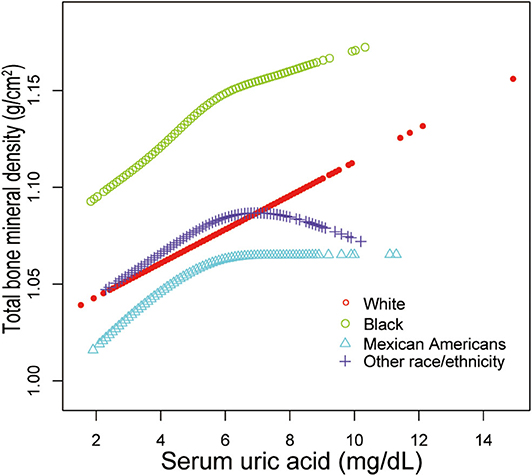
Figure 4. Serum uric acid and total bone mineral density dose–response relationship, stratified by race/ethnicity. Age, sex, body mass index, income poverty ratio, physical activity, blood urea nitrogen, total protein, total cholesterol, serum phosphorus, serum calcium were adjusted.
The main objective of this study was to investigate whether sUA is independently associated with total BMD. In this study, we used a large and nationally representative sample of US adolescents. Our results suggested that sUA was positively associated with total BMD in male adolescents, adolescents aged 12–15 years, and White, Black and Mexican American adolescents, but not significant in female adolescents, adolescents aged 16–19 years, and other race/ethnicity.
The prevalence of hyperuricemia in general populations is relatively high and has been increasing over the past few decades (21, 22). Hyperuricemia also occurs at a younger age because of a combination of several factors, such as rapid urbanization, lifestyle changes, and obesity (23). Hyperuricemia is a key causal factor of gout, and all patients with gout are expected to experience at least some periods of hyperuricemia (24). However, gout is extremely rare in adolescents, and most patients with gout have an underlying disease. Recently, several epidemiological and laboratory studies discovered that UA is potentially involved in multiple biological processes and associated with a wide range of conditions, such as obesity, hypertension, and chronic kidney disease (25, 26). Hyperuricemia in adolescents is also a target of treatment. Our results supported that increased sUA level would be beneficial to bone health in adolescents with low sUA levels. Therefore, there is a need to understand the potential effects of sUA on bone health and balance potential risks against potential benefits. Thus, overcorrection of sUA level should be reconsidered.
Previous studies have examined the relationship between sUA and bone health. Their favorable association was reported in middle-aged or older Chinese population (9, 13–15) and other Asian population (10–12, 27, 28), but not in some Western population (29–31). An NHANES study conducted by Zhang et al. (32) reported no significant association between sUA level and BMD in participants aged >30 years. Their data also showed no difference in BMD between hyperuricemic rats and controls. Moreover, a Mendelian randomization study did not support a causal association between sUA and BMD (33). These conflicting conclusions may be attributed to the variations among these studies, in terms of demographic characteristics, study designs, study size, controlled confounders, etc.
Evidence linking sUA and BMD in adolescents is very limited. In a recent cross-sectional study of 413 Iranian adolescents aged 9–19 years, Karimi et al. (16) found a significant association between sUA and BMD by multiple regression analyses. Their results showed that those adolescents with greater BMD had higher sUA levels. The findings of our analysis would be consistent with this literature if we did not perform the subgroup analyses. Following the STROBE guideline (34), we performed subgroup analyses to make better use of the data. As a result, we found that this association was not significant in female adolescents, adolescents aged 16–19 years, and other race/ethnicity in our subgroup analyses. We also observed significant turning points in these groups. Their total BMD decreased when the sUA level was beyond those turning points. However, further large-sample prospective studies are needed to confirm this conclusion.
The exact mechanism of this association between sUA and bone metabolism remains unclear. A possible explanation to support the potentially beneficial effect of sUA on bone health might be related to its antioxidant capacity. Protective effect of UA on bone mass is supposed to be mediated through the free radical scavenging capacity during metabolic stress (35). Therefore, sUA may be involved in the pathogenesis of abnormal bone metabolism. UA was reported to decrease osteoclastogenesis in a dose-dependent manner and reduce the production of reactive oxygen species in osteoclast precursors (28). Another study showed that UA promoted proliferation of human bone mesenchymal stem cells and differentiation into osteoblasts and inhibited their adipogenic differentiation (36). There are other possible explanation for the association between sUA and bone health. Beneficial UA-BMD association might be partly mediated by muscle mass, similar to mechanical loading and muscle-derived cytokines (19). Despite these possibilities, further research is needed to explore the molecular mechanism toward the correlation between sUA and BMD, given the extreme importance of evidence to determine whether sUA concentration is an eligible diagnostic indicator for related diseases.
In this study, we analyzed representative samples of multiracial populations for better generalizability of the US population. Furthermore, this large sample size allowed us to perform further subgroup analyses. This is the main strength of this study. However, the limitations are worth noting. First, because this study has a cross-sectional design, it is difficult to determine whether there was a causal relationship between sUA and total BMD. Second, other confounding factors that were not included in this study may have an effect on the results. For example, sUA levels in adolescent boys are physiologically higher than those in girls. Studies have shown that this physiological difference was partially caused by the action of sex hormones on the renal excretion of UA (37). Thus, differences in sex hormones during pubertal development in adolescents aged 12–15 and 16–19 years might be a potential confounder to consider. Therefore, the role of UA in bone metabolism requires further clarification, and a longitudinal follow-up study with a large sample size will be needed.
In conclusion, this study demonstrated the correlation between sUA level and total BMD differed by sex. The increased sUA level would be beneficial to bone health in adolescents with low sUA levels, but for female adolescents, a higher sUA level (turning point, 3.9 mg/dL) may have an adverse effect on bone health. Further basic studies are needed to explore the effect of UA on bone health and the threshold sUA dose that is beneficial for bone health without deleterious effects.
The datasets for this study can be found at www.cdc.gov/nchs/nhanes/.
The NCHS Ethics Review Board granted approval for the conduct of NHANES and written informed consents were obtained from all participants.
KP: writing—original draft preparation. XY and ML: validation. ZZ: writing—review and editing.
The authors declare that the research was conducted in the absence of any commercial or financial relationships that could be construed as a potential conflict of interest.
1. Sioen I, Lust E, de Henauw S, Moreno LA, Jimenez-Pavon D. Associations between body composition and bone health in children and adolescents: a systematic review. Calcif Tissue Int. (2016) 99:557–77. doi: 10.1007/s00223-016-0183-x
2. Golden NH, Abrams SA. Optimizing bone health in children and adolescents. Pediatrics. (2014) 134:e1229–43. doi: 10.1542/peds.2014-2173
3. Domazetovic V, Marcucci G, Iantomasi T, Brandi ML, Vincenzini MT. Oxidative stress in bone remodeling: role of antioxidants. Clin Cases Miner Bone Metab. (2017) 14:209–16. doi: 10.11138/ccmbm/2017.14.1.209
4. Lee YJ, Hong JY, Kim SC, Joo JK, Na YJ, Lee KS. The association between oxidative stress and bone mineral density according to menopausal status of Korean women. Obstet Gynecol Sci. (2015) 58:46–52. doi: 10.5468/ogs.2015.58.1.46
5. Callaway DA, Jiang JX. Reactive oxygen species and oxidative stress in osteoclastogenesis, skeletal aging and bone diseases. J Bone Miner Metabol. (2015) 33:359–70. doi: 10.1007/s00774-015-0656-4
6. Lean JM, Davies JT, Fuller K, Jagger CJ, Kirstein B, Partington GA, et al. A crucial role for thiol antioxidants in estrogen-deficiency bone loss. J Clin Invest. (2003) 112:915–23. doi: 10.1172/JCI200318859
7. El Ridi R, Tallima H. Physiological functions and pathogenic potential of uric acid: a review. J Adv Res. (2017) 8:487–93. doi: 10.1016/j.jare.2017.03.003
8. Kaushal N, Vohora D, Jalali RK, Jha S. Review of the literature examining the association of serum uric acid with osteoporosis and mechanistic insights into Its effect on bone metabolism. Endocr Metab Immun Disord Drug Targets. (2019) 19:259–73. doi: 10.2174/1871530318666181102115106
9. Chen F, Wang Y, Guo Y, Wang J, Yang A, Lv Q, et al. Specific higher levels of serum uric acid might have a protective effect on bone mineral density within a Chinese population over 60 years old: a cross-sectional study from northeast China. Clin Interventions Aging. (2019) 14:1065–73. doi: 10.2147/CIA.S186500
10. Babaei M, Shamsi R, Heidari B, Bijani A, Hosseini SR. Serum uric acid status and its association with bone mineral density in the elderly people aged 60 years and more. Int J. Endocr Metab. (2019) 17:e80780. doi: 10.5812/ijem.80780
11. Kaushal N, Vohora D, Jalali RK, Jha S. Raised serum uric acid is associated with higher bone mineral density in a cross-sectional study of a healthy Indian population. Ther Clin Risk Manage. (2018) 14:75–82. doi: 10.2147/TCRM.S147696
12. Hwang J, Hwang JH, Ryu S, Ahn JK. Higher serum uric acid is associated with higher lumbar spine bone mineral density in male health-screening examinees: a cross-sectional study. J bone Miner Metabol. (2019) 37:142–51. doi: 10.1007/s00774-018-0905-4
13. Han W, Bai X, Wang N, Han L, Sun X, Chen X. Association between lumbar bone mineral density and serum uric acid in postmenopausal women: a cross-sectional study of healthy Chinese population. Arch Osteoporosis. (2017) 12:50. doi: 10.1007/s11657-017-0345-0
14. Xiao J, Chen W, Feng X, Liu W, Zhang Z, He L, et al. Serum uric acid is associated with lumbar spine bone mineral density in healthy Chinese males older than 50 years. Clin Interventions Aging. (2017) 12:445–52. doi: 10.2147/CIA.S130690
15. Yan DD, Wang J, Hou XH, Bao YQ, Zhang ZL, Hu C, et al. Association of serum uric acid levels with osteoporosis and bone turnover markers in a Chinese population. Acta pharmacologica Sinica. (2018) 39:626–32. doi: 10.1038/aps.2017.165
16. Karimi F, Dabbaghmanesh MH, Omrani GR. Association between serum uric acid and bone health in adolescents. Osteoporosis Int. (2019) 30:2057–64. doi: 10.1007/s00198-019-05072-w
17. Lee JH. Prevalence of hyperuricemia and its association with metabolic syndrome and cardiometabolic risk factors in Korean children and adolescents: analysis based on the 2016-2017 Korea National health and nutrition examination survey. Korean J Pediatr. (2019) 62:317–23. doi: 10.3345/kjp.2019.00444
18. Xu M, Su J, Hao J, Zhong N, Zhang Z, Cui R, et al. Positive association between serum uric acid and bone mineral density in Chinese type 2 diabetes mellitus stratified by gender and BMI. J Bone Miner Metab. (2018) 36:609–19. doi: 10.1007/s00774-017-0877-9
19. Dong XW, Tian HY, He J, Wang C, Qiu R, Chen YM. Elevated serum uric acid is associated with greater bone mineral density and skeletal muscle mass in middle-aged and older adults. PLoS ONE. (2016) 11:e0154692. doi: 10.1371/journal.pone.0154692
20. Zipf G, Chiappa M, Porter KS, Ostchega Y, Lewis BG, Dostal J. National health and nutrition examination survey: plan and operations, 1999-2010. Vital Health Stat. 1. (2013) 1:1–37.
21. Zhu Y, Pandya BJ, Choi HK. Prevalence of gout and hyperuricemia in the US general population: the national health and nutrition examination survey 2007-2008. Arthritis Rheum. (2011) 63:3136–41. doi: 10.1002/art.30520
22. Liu R, Han C, Wu D, Xia X, Gu J, Guan H, et al. Prevalence of hyperuricemia and gout in mainland China from 2000 to 2014: a systematic review and meta-analysis. Biomed Res Int. (2015) 2015:762820. doi: 10.1155/2015/762820
23. Li N, Zhang S, Li W, Wang L, Liu H, Li W, et al. Prevalence of hyperuricemia and its related risk factors among preschool children from China. Sci Rep. (2017) 7:9448. doi: 10.1038/s41598-017-10120-8
24. Shiozawa A, Szabo SM, Bolzani A, Cheung A, Choi HK. Serum uric acid and the risk of incident and recurrent gout: a systematic review. J Rheumatol. (2017) 44:388–96. doi: 10.3899/jrheum.160452
25. Li X, Meng X, Timofeeva M, Tzoulaki I, Tsilidis KK, Ioannidis JP, et al. Serum uric acid levels and multiple health outcomes: umbrella review of evidence from observational studies, randomised controlled trials, and Mendelian randomisation studies. BMJ. (2017) 357:j2376. doi: 10.1136/bmj.j2376
26. Kubota M. Hyperuricemia in children and adolescents: present knowledge and future directions. J Nutr Metab. (2019) 2019:3480718. doi: 10.1155/2019/3480718
27. Ishii S, Miyao M, Mizuno Y, Tanaka-Ishikawa M, Akishita M, Ouchi Y. Association between serum uric acid and lumbar spine bone mineral density in peri- and postmenopausal Japanese women. Osteoporosis Int. (2014) 25:1099–105. doi: 10.1007/s00198-013-2571-7
28. Ahn SH, Lee SH, Kim BJ, Lim KH, Bae SJ, Kim EH, et al. Higher serum uric acid is associated with higher bone mass, lower bone turnover, and lower prevalence of vertebral fracture in healthy postmenopausal women. Osteoporosis Int. (2013) 24:2961–70. doi: 10.1007/s00198-013-2377-7
29. Veronese N, Bolzetta F, De Rui M, Maggi S, Noale M, Zambon S, et al. Serum uric acid and incident osteoporotic fractures in old people: the PRO.V.A study. Bone. (2015) 79:183–9. doi: 10.1016/j.bone.2015.06.005
30. Kim SC, Paik JM, Liu J, Curhan GC, Solomon DH. Gout and the risk of non-vertebral fracture. J Bone Miner Res. (2017) 32:230–6. doi: 10.1002/jbmr.2978
31. Mehta T, Buzkova P, Sarnak MJ, Chonchol M, Cauley JA, Wallace E, et al. Serum urate levels and the risk of hip fractures: data from the Cardiovascular Health Study. Metabolism. (2015) 64:438–46. doi: 10.1016/j.metabol.2014.11.006
32. Zhang D, Bobulescu IA, Maalouf NM, Adams-Huet B, Poindexter J, Park S, et al. Relationship between serum uric acid and bone mineral density in the general population and in rats with experimental hyperuricemia. J Bone Miner Res. (2015) 30:992–9. doi: 10.1002/jbmr.2430
33. Lee YH, Song GG. Uric acid level, gout and bone mineral density: a Mendelian randomization study. Eur J Clin Invest. (2019) 49:e13156. doi: 10.1111/eci.13156
34. von Elm E, Altman DG, Egger M, Pocock SJ, Gotzsche PC, Vandenbroucke JP. The strengthening the reporting of observational studies in epidemiology (STROBE) statement: guidelines for reporting observational studies. Lancet. (2007) 370:1453–7. doi: 10.1016/S0140-6736(07)61602-X
35. Makovey J, Macara M, Chen JS, Hayward CS, March L, Seibel MJ, et al. Serum uric acid plays a protective role for bone loss in peri- and postmenopausal women: a longitudinal study. Bone. (2013) 52:400–6. doi: 10.1016/j.bone.2012.10.025
36. Li HZ, Chen Z, Hou CL, Tang YX, Wang F, Fu QG. Uric acid promotes osteogenic differentiation and inhibits adipogenic differentiation of human bone mesenchymal stem cells. J Biochem Mol Toxicol. (2015) 29:382–7. doi: 10.1002/jbt.21707
Keywords: uric acid, bone mineral density, adolescent, NHANES, cross-sectional study
Citation: Pan K, Yao X, Liu M and Zhu Z (2020) Association of Serum Uric Acid Status With Bone Mineral Density in Adolescents Aged 12–19 Years. Front. Med. 7:255. doi: 10.3389/fmed.2020.00255
Received: 14 January 2020; Accepted: 12 May 2020;
Published: 09 June 2020.
Edited by:
Jianbo Wan, University of Macau, ChinaReviewed by:
Yuelin Song, Beijing University of Chinese Medicine, ChinaCopyright © 2020 Pan, Yao, Liu and Zhu. This is an open-access article distributed under the terms of the Creative Commons Attribution License (CC BY). The use, distribution or reproduction in other forums is permitted, provided the original author(s) and the copyright owner(s) are credited and that the original publication in this journal is cited, in accordance with accepted academic practice. No use, distribution or reproduction is permitted which does not comply with these terms.
*Correspondence: Zhongxin Zhu, b3J0aG96enhAMTYzLmNvbQ==
Disclaimer: All claims expressed in this article are solely those of the authors and do not necessarily represent those of their affiliated organizations, or those of the publisher, the editors and the reviewers. Any product that may be evaluated in this article or claim that may be made by its manufacturer is not guaranteed or endorsed by the publisher.
Research integrity at Frontiers
Learn more about the work of our research integrity team to safeguard the quality of each article we publish.