- 1Department of Nephrology, Institute of Nephrology of Chongqing and Kidney Center of PLA, Xinqiao Hospital, Army Medical University (Third Medical University), Chongqing, China
- 2Department of Cardiology, Institute of Cardiovascular Diseases of PLA, Xinqiao Hospital, Army Medical University (Third Military Medical University), Chongqing, China
Aims: The aim of this study was to identify the predictive role of baseline anti-erythropoietin (anti-EPO) antibody levels in follow-up EPO demand in maintenance dialysis patients with end-stage renal disease (ESRD).
Methods: Baseline routine blood parameters, clinical data, dialysis-related parameters, EPO, anti-EPO antibody, and anti-EPO-receptor antibody were also measured. Differences in the abovementioned variables were compared among four intervals of the EPO demand index (EDI). Further univariate and adjusted logistic regression analyses were performed to identify the independent predictors for higher EPO demand.
Results: The predialysis potassium ion concentration was significantly higher in the fourth quartile (Q4) population than in the other three populations (p < 0.05). Furthermore, the anti-EPO antibody level showed significant differences among the four intervals (p = 0.006). The baseline anti-EPO antibody level was correlated with the follow-up EDI (r2 = 0.0377, p = 0.030). Furthermore, the follow-up EDI was significantly higher in the anti-EPO antibody-positive group (p = 0.02). Age (OR = 1.071, p = 0.005), ferritin (OR = 1.001, p = 0.038), potassium ion concentration before dialysis (OR = 2.781, p = 0.012), dialysis duration (OR = 1.025, p = 0.030), and anti-EPO antibody level (OR = 7.694, p = 0.004) were potential predictors for higher EPO demand. After adjustment, age (OR = 1.072, p = 0.026), potassium ion concentration before dialysis (OR = 3.425, p = 0.013), and EPO level (OR = 5.27, p = 0.007) were independent predictors for higher EDI demand.
Conclusion: The baseline anti-EPO antibody level combined with an older age and a higher predialysis potassium ion concentration are independent predictors for a higher follow-up EPO demand in maintenance dialysis patients with ESRD.
Introduction
Anemia is considered the most frequent complication in patients with end-stage renal disease (ESRD), especially in the subpopulation on maintenance dialysis (1). It has also been identified as an independent risk factor/predictor for major cardiovascular events, including heart failure and atherosclerosis (2). Anemia in ESRD patients has also been demonstrated to be caused mainly by insufficient synthesis of erythropoietin (EPO) combined with erythropoietin resistance as well as a higher erythropoietin demand (3).
It has been demonstrated that up to 10% of patients in the erythropoietin-stimulating agent (ESA)-treated population have a lower erythropoietin response (1, 4, 5). Furthermore, an imbalance between the production of EPO and the demand for EPO is another pivotal reason for anemia in patients treated with ESA.
Erythropoietin demand reflects the need for erythropoietin (including endogenous and exogenous EPO) in ESRD patients in order to produce sufficient Hb to eliminate anemia (6, 7). Previous studies have shown that maintenance of dialysis patients with ESRD may be characterized by a greater erythropoietin demand or require a larger amount of ESA (1, 6). The erythropoietin demand index (EDI) is an indicator of the requirement for EPO, which is calculated as plasma erythropoietin units divided by the hemoglobin value (1).
The erythropoietin demand is a critical risk factor for cardiovascular disease; thus, it is urgent to identify the main causes for erythropoietin demand and epidemiology of increased EPO demand in maintenance dialysis patients with ESRD and its risk predictors/factors (2, 4). However, the risk factors and predictors for increased erythropoietin demand have been comprehensively investigated.
In recent decades, the anti-EPO antibody and anti-EPO receptor (anti-EPOR) antibody have been reported to be associated with EPO resistance (8–10). In addition, they may play an important role in anemia among maintenance dialysis patients combined with insufficient EPO production (6, 11). Furthermore, the roles of anti-EPO and anti-EPOR antibodies in EPO demand have not been identified. Thus, we performed the current prospective cohort study to identify the predictive role of anti-EPO and anti-EPOR antibodies in EPO demand in maintenance dialysis patients.
Methods
Study Design and Population
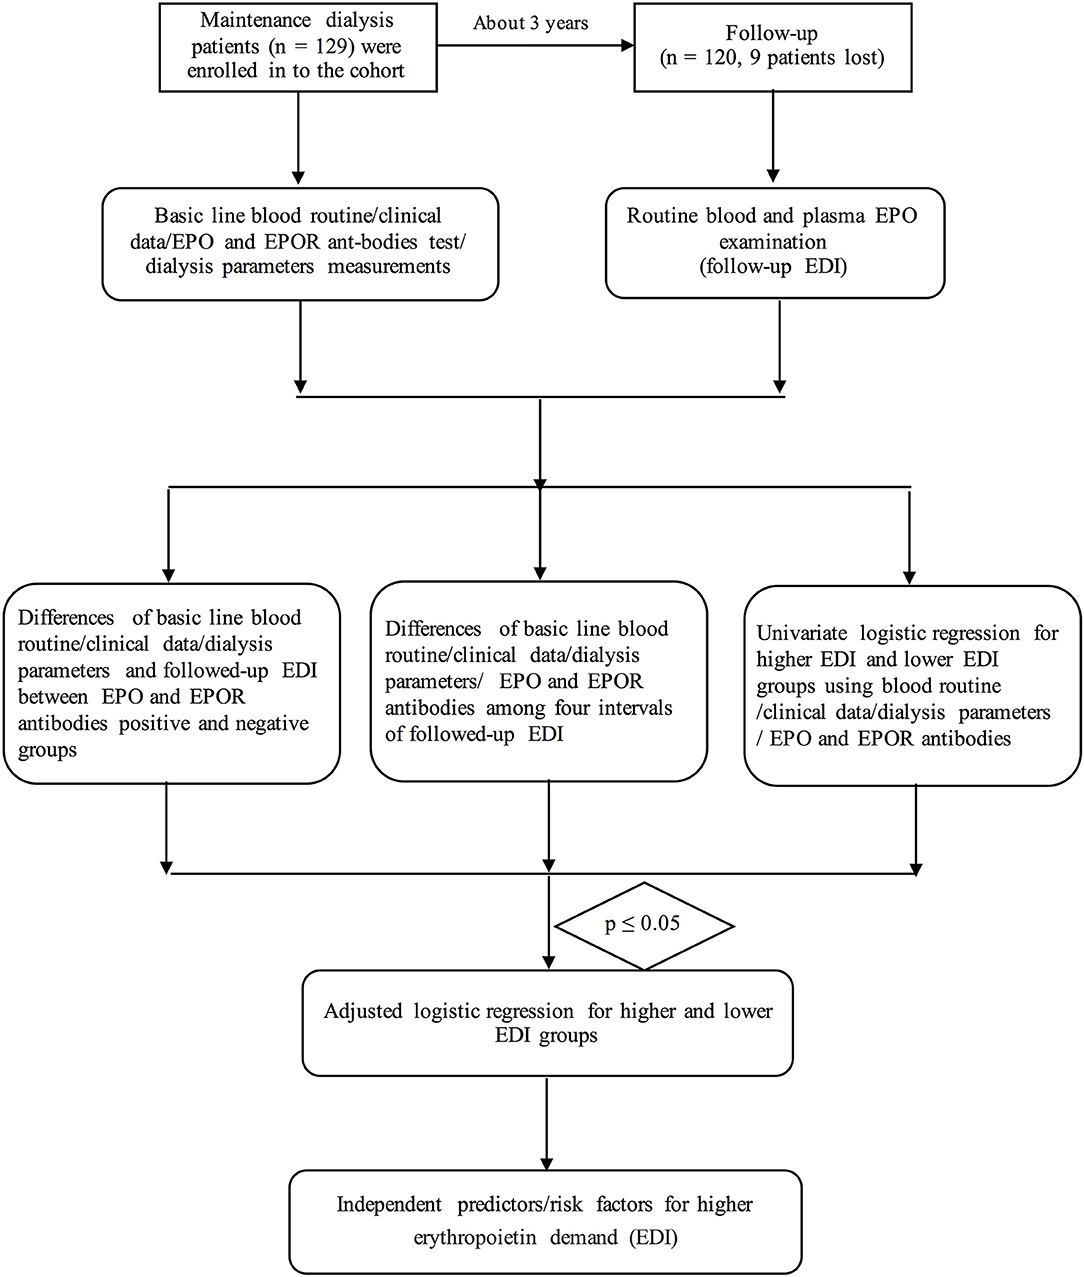
Our present research is a prospective cohort study in consecutive patients with ESRD who were undergoing maintenance dialysis at Xinqiao Hospital, Army Medical University (Third Military Medical University) from March 1, 2016, to July 1, 2019. A total of 129 consecutive patients were included in our cohort according to the inclusion and exclusion criteria. Most of the subjects were followed up within 39 months (fewer of them were followed up within 2 months). Median and quartiles of the follow-up time were 39 (39–39) months. During a median of 39 months of follow-up, nine patients were excluded or lost to follow-up.
The inclusion criterion was ESRD patients who were undergoing maintenance dialysis. The exclusion criteria were as follows: severe hepatic dysfunction (n = 2), death during hospitalization (n = 2), advanced cancer (n = 1), or severe infection (1). Additionally, three patients were lost to follow-up in the cohort, as shown in Figure 1.
All patients provided written informed consent. Our present research complied with the Declaration of Helsinki with respect to human investigations and was approved by the ethics committee of Xinqiao Hospital, Army Medical University (Third Military Medical University).
Procedures and Clinical Data Collection
The selected maintenance dialysis patients were viewed in clinical reception by our trained physicians, Dr. Ying Zhang and Dr. Yiqing Wang, by using standardized case file records to record demographic data (age, height, and weight), lifestyle factors (smoking and alcohol consumption status), prevalent diseases (hypertension, cardiovascular diseases, and other diseases), family histories, and medication use (antihypertension drugs, anticoagulants, and phosphate binders), as well as EPO usage.
Biomarker Variable Determination
Venous blood samples were obtained from the patients in the early morning after at least 12-h fasting at both cross sections (after entrance to the cohort and follow-up cross section) within a median of 39 months of follow-up (from 2 to 39 months).
First, we performed routine blood examination [tests of red blood cell count (RBC), mean corpuscular volume (MCV), concentration of hemoglobin (Hb), mean corpuscular hemoglobin (MCH), hematocrit (HCT), MCH concentration (MCHC), red blood cell distribution width (RDW), white blood cell count (WBC), platelet count (PLT), plateletcrit (PCT), and platelet distribution width (PDW)] by using an automated hematology corpuscle analyzer (AU400; Olympus Optical, Co., Tokyo, Japan).
Second, we measured plasma creatinine (Cr, enzyme method), UA (colorimetry), parathyroid hormone (PTH; chemiluminescent immunoassay), and ferritin (chemiluminescent immunoassay) concentrations by using Roche Diagnostics GmbH products (Abbott, i2000, USA).
Third, we also performed examinations of serum iron concentration (FERENE methods, Beckman AU5821), blood urea nitrogen concentration (BUN), potassium concentration (K+), and sodium concentration (Na+) by using indirect ion-selective electrode methods (EX-Z, JOKOH, Japan). Serum calcium concentration (Ca2+) was measured by using Tri-azo methods, and phosphate concentration (P) was measured with a phosphomolybdate ultraviolet method (Roche Diagnostics GmbH, USA).
Finally, EPO, anti-EPO antibody, and anti-EPOR antibody were measured using ELISA kits (Recombinant Human Erythropoietin, BioLegend and Recombinant Human R Erythropoietin, RD Systems, USA). Each sample was assayed in duplicate to measure the exact concentrations of endogenous EPO, anti-EPO antibody, and anti-EPOR antibody.
All of the biochemical variables were measured from blood specimens in the Clinical Laboratory Department, Xinqiao Hospital.
Definition of the Variables
KT/V was calculated as ln(posturea/preurea) – 0.008 *ultrafiltration time + (4 – 3.5 *posturea/preurea) *(ultrafiltration volume/postweight). Follow-up EPO demand was assessed by using the endogenous EPO level divided by Hb (EDI). Anti-EPO antibody positive (EPOA+) was defined as an optical density (OD) >0.5526 [the mean ± 3 standard deviations (SDs) in 55 age-matched healthy volunteers]; otherwise, it was defined as anti-EPO antibody negative (EPOA–). Similarly, EPOR antibody positive (EPOA+) was defined as an OD >0.5356 (the mean ± 3 SDs in 55 age-matched healthy volunteers); otherwise, it was defined as anti-EPOR negative (EPORA–).
Statistical Analysis
Continuous variables (such as age and BMI) that are normally distributed were expressed as the means ± SD. The differences between two groups or among four EDI intervals of these variables were compared using independent Student's t-test or one-way ANOVA [comparisons between two intervals were made using least significant difference (LSD) methods]. The Wilcoxon rank sum test was used to compare the non-normally distributed variables (comparisons among four intervals were performed by using one-way ANOVA after transformation to normality). Furthermore, the chi-square test or Fisher's exact test (if there were less than five cases) was employed to assess dichotomous variables. Univariate logistic regression analyses were performed to primarily screen the risk factors for EPO demand. Variables with p < 0.05 in comparisons among different EDI groups or in the univariate logistic regression were included in multivariate (adjusted) logistic regression analyses to identify independent associated factors of higher EPO demand. The regressions were performed using ordinal logistic regression analyses, and we have just listed the Q4 EDI vs. other intervals (Q1–Q3) owing to too many data. Furthermore, the generalized linear model's analyses have also been performed to determine the OR and its 95% CI. All of the statistical analyses were performed with SPSS 22.0 for MAC statistical software (California, USA).
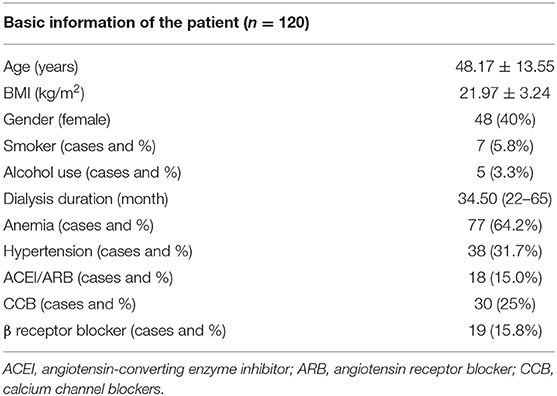
Results
At the follow-up cross section, 120 patients were included in the statistical analysis. The basic characteristics of the patients are listed in Table 1. The mean age of the subjects was 48.17 ± 13.55 years, and the BMI was 21.97 ± 3.24 kg/m2. A total of 77 patients were diagnosed with anemia (64.2%). Hypertension status and drug use are also shown in Table 1. The follow-up endogenous EPO was 18.05 (10.70–18.88) g/dl in these maintenance dialysis patients.
Differences in Baseline Parameters Among the Four Intervals of Follow-Up Erythropoietin Demand Index
The EDI was divided into four quartile intervals, and we compared the differences among various groups. The patients in the Q4 and Q3 groups were significantly older than those in the Q2 and Q1 groups (p-values were <0.05; Table 2).
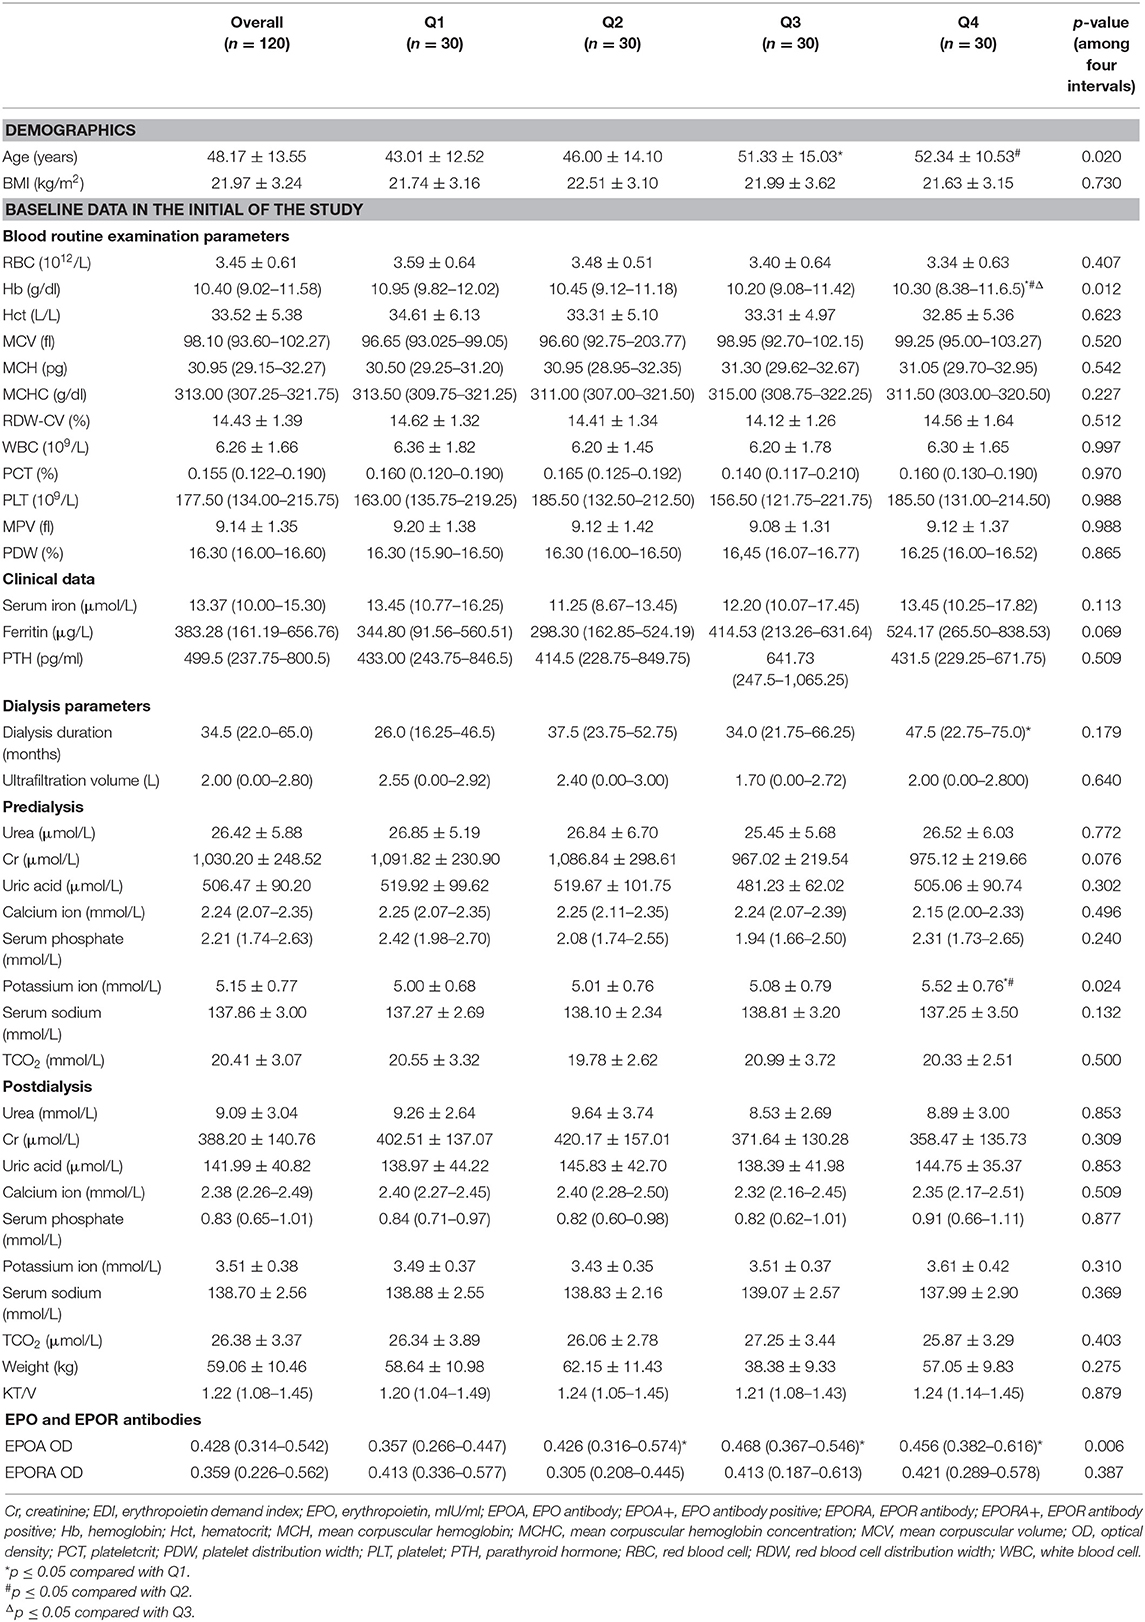
Table 2. Differences of basic line routine blood, clinical data, dialysis parameters, EPO, and EPOR antibodies among four intervals of follow-up EDI.
In the routine blood tests, only Hb showed significant differences among different EDI intervals. The Hb concentration was significantly higher in the Q1 EDI group at 10.95 (9.82–12.02). Other routine blood test parameters, including HCT, MCV, MCH, MCHC, RDW-CV, WBC, PCT, PLT, mean platelet volume (MPV), and PDW, showed no differences among the various intervals of EDI.
The serum iron, ferritin, and PTH levels were similar in the groups (all p-values were >0.05).
In the dialysis parameters, the dialysis duration showed no differences among the four intervals (p = 0.179). Predialysis, the potassium ion concentration was significantly higher in the Q4 population than in the other three populations (all p-values were <0.05). However, other predialysis parameters, including the concentrations of urea, Cr, uric acid, calcium ion, serum phosphate, and serum sodium, as well as TCO2, showed no differences among these populations (all of the p-values were >0.05). Furthermore, the postdialysis-related variables were all similar among various populations, including concentrations of urea, Cr, uric acid, calcium ion, serum phosphate, potassium ion, and serum sodium, as well as TCO2.
Unfortunately, we found no difference in either ultrafiltration volume or KT/V value (p > 0.05). Focusing on the target level of anti-EPO and anti-EPOR antibodies, only anti-EPO antibody showed significant differences among the four intervals (p = 0.006); that is, the levels of anti-EPO antibody were significantly higher in the Q2, Q3, and Q4 populations than in the Q1 subgroup (all p-values were <0.05). However, the anti-EPO antibody levels were similar among the three subgroups (Q2, Q3, and Q4, Table 2).
Differences in Baseline Parameters Between Erythropoietin and Erythropoietin Receptor Antibodies Positive and Negative Groups
We further analyzed the differences in baseline parameters between EPO/EPOR antibody-positive and EPO/EPOR antibody-negative groups. First, age and BMI showed no difference between the EPOA+ and EPOA– groups or between the EPORA+ and EPORA– groups.
In the routine blood examination parameters, we found that only RDW was significantly higher in the EPOA+ group than in the EPOA– group (14.87 ± 1.57% vs. 14.28 ± 1.31%, p = 0.046). Only one variable (MPV) was significantly higher in the EPORA+ group than in the EPORA– group (9.65 ± 1.70 vs. 8.94 ± 1.14 fl, p = 0.010). However, none of the other routine blood examination parameters showed any differences between the EPORA+ and EPORA– individuals (p > 0.05).
Moreover, neither clinical data (serum iron, ferritin, and PTH) nor dialysis-related parameters showed any differences between the EPOA+ and EPORA+ populations.
Regarding the EPORA groups, we found that ferritin and TCO2 (both predialysis and postdialysis) showed differences between the EPORA+ and EPORA– populations. Other clinical data and dialysis-related parameters were similar in the two groups (Table 3).
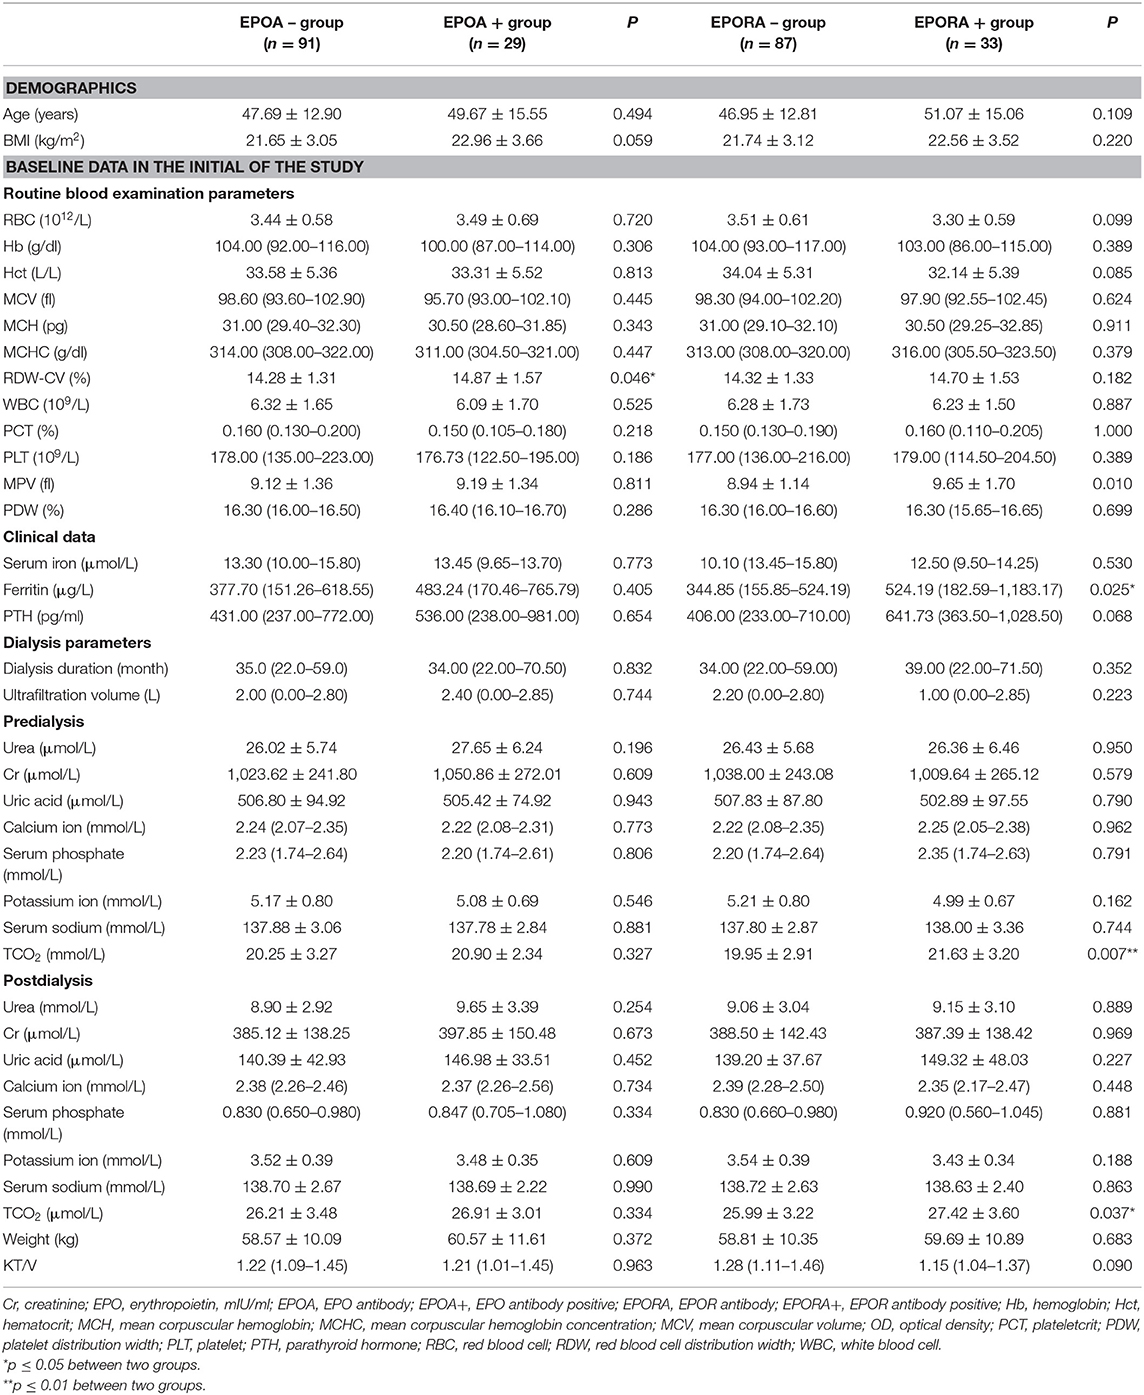
Table 3. Differences of basic line blood routine, clinical data, and dialysis parameters between EPO and EPOR antibody positive and negative groups.
Associations Between Erythropoietin Demand Index and Erythropoietin/Erythropoietin Receptor Antibodies
To identify the associations between EDI and anti-EPO/anti-EPOR antibody levels, we further compared the EDI between the EPOA + and EPOA– groups (as well as between the EPORA+ and EPORA– groups). As shown in Figure 2, the baseline EPO antibody level is correlated with follow-up EDI (r2 = 0.0377, p = 0.03), whereas the baseline anti-EPOR antibody level was not correlated with EDI (r2 = 0.0009, p = 0.73). Furthermore, in Figure 3, we found that the follow-up EDI was significantly higher in the EPOA+ group than in the EPOA– group (p = 0.02, Figure 3A). However, there were no significant differences between the EPORA+ and EPORA– groups. In addition, follow-up EDI was similar in the EPOA+ combined with EPORA+ group and EPOA– combined EPORA– group (Figures 3B–D). The correlations between the follow-up EDI and other parameters are shown in Table S1.
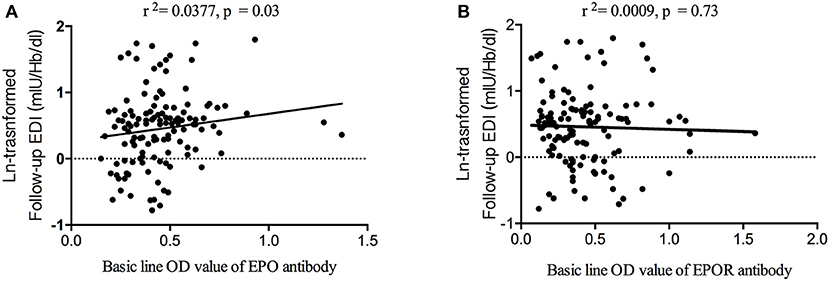
Figure 2. Correlation between follow-up EDI and baseline anti-EPO and anti-EPOR antibodies. (A) The baseline anti-EPO antibody level was correlated with follow-up EDI. (B) The baseline anti-EPOR antibody level was not correlated with follow-up EDI. EDI, erythropoietin demand index; EPO, erythropoietin; EPOR, erythropoietin receptor.
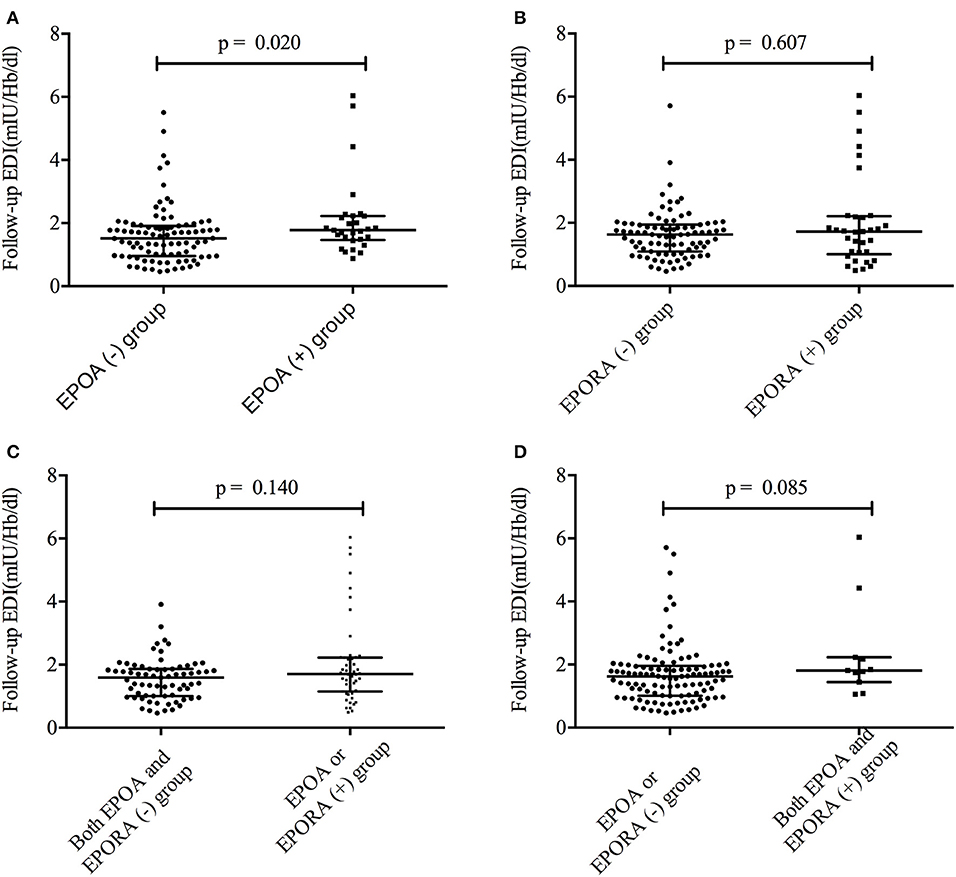
Figure 3. The follow-up EDI was different between the different groups. (A) The follow-up EDI was different between the EPOA+ and EPOA– groups. (B) The follow-up EDI was not different between the EPORA+ and EPORA– groups. (C) Follow-up EDI showed no difference between the EPOA/EPORA+ group and the EPOA– (plus EPORA–) group. (D) Follow-up EDI showed no difference between the EPOA+ (plus EPORA+) group and the EPOA–/EPORA– group. EDI, erythropoietin demand index; EPOA–, EPOA negative; EPOA, erythropoietin antibody; EPOA+, EPOA positive.
Univariate and Adjusted Regressions for the Higher Erythropoietin Demand Index Group
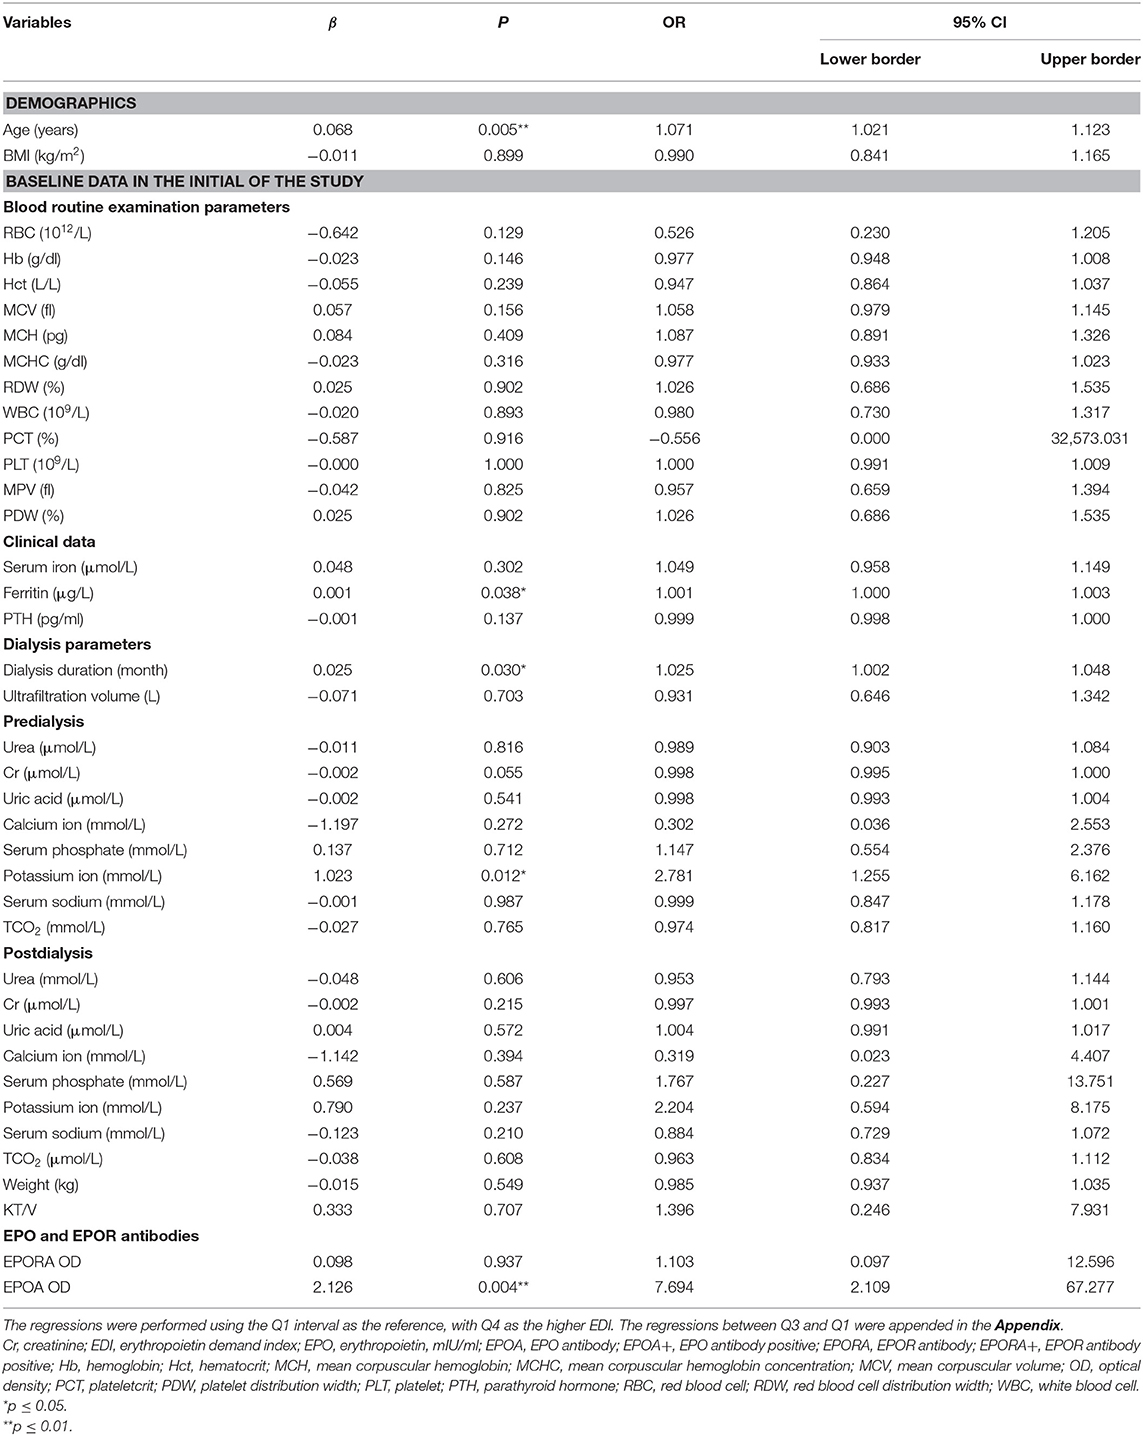
To identify the predictive roles of EPO and other potential factors, we performed univariate logistic regression for each parameter between the higher and lower erythropoietin demand (Q4 of EDI vs. Q1 of EDI). Other analyses between Q3 EDI and Q1 EDI are shown in the Appendix.
In the univariate logistic regression analyses, we found that age (OR = 1.071, 95% CI 95% CI: 1.021–1.123, p = 0.005), ferritin (OR = 1.001, 95% CI: 1.000–1.003, p = 0.038), potassium ion concentration before dialysis (OR = 2.781, 95% CI: 1.255–6.162, p = 0.012), dialysis duration (OR = 1.025, 95% CI: 1.002–1.048, p = 0.030), and EPOA OD value (OR = 7.694, 95% CI: 2.109–67.277, p = 0.004) were potential associated factors for higher erythropoietin demand (Table 4).
To identify the independent associated factors of higher erythropoietin demand, variables that showed differences among various intervals of EDI or that had a p-value of <0.05 in univariate logistic regression analyses were included in the adjusted logistic regression. Ultimately, age (OR = 1.072, 95% CI: 1.008–1.140, p = 0.026), potassium ion concentration before dialysis (OR = 3.425, 95% CI: 1.297–9.040, p = 0.013), and EPOA OD value (OR = 5.27, 95% CI: 2.577–6.733, p = 0.007) were found to be independent associated factors of higher erythropoietin demand (Table 5).
The ordinal logistic regression analyses have found that the baseline EPO antibody level (OR = 5.328, 95% CI: 1.072–8.735, p = 0.045), ferritin (OR = 6.746, 95% CI: 1.028–9.976, p = 0.044), and PTH (OR= 0.064, 95% CI: 0.009–0.148, p = 0.035) were independently associated with higher EDI (Tables S4, S5).
Discussion
In the present cohort study lasting a median of 39 months, we found differences in age, baseline Hb, baseline predialysis potassium ion concentration, and baseline anti-EPO antibody level among four follow-up EDI intervals. Furthermore, EDI was significantly higher in the EPOA+ group than in the EPOA– group, and it was associated with the anti-EPO antibody level. Further analyses indicated that age, potassium ion concentration before dialysis, and anti-EPO antibody OD level were independent associated factors of higher EPO demand or higher EDI.
As mentioned in the Introduction, anemia is one of the most frequent complications accompanying ESRD, especially in the maintenance dialysis patient subpopulation (1, 7, 11, 12). In the present study, more than half of the maintenance dialysis patients had various severities of anemia. It is known that patients with ESRD produce insufficient EPO due to kidney dysfunction to satisfy the higher need for EPO resulting in anemia. It is also the most important reason for use of ESA.
Age has been considered a non-modifiable risk factor for various diseases, including anemia and renal dysfunction (13, 14). Without exception, we found that older patients with ESRD who underwent maintenance dialysis were characterized by a higher EDI, indicating a greater requirement for EPO. We also found that age may be the potential risk factor for higher EPO demand in the primary screening univariate regression analysis. Final adjusted analyses identified the independently predictive role of age in the higher EPO demand after 39 months.
EPO demand is directly calculated by Hb; thus, it may be related to baseline routine blood parameters, especially RBC and Hb variables. We found that the baseline Hb concentration was significantly higher in the lower follow-up EPO demand group. However, in the latter analyses, baseline Hb concentration showed no association with EPO demand. Neither was it an independent associated factor of higher EPO demand. Serum iron, ferritin, and PTH were also considered in the analyses; however, they were not associated with follow-up EDI. Although iron is one of the basic elements for the production of Hb, we did not find an association between iron and EPO demand (15).
We also attempted to identify the association between dialysis parameters (separated into predialysis and postdialysis). We revealed one novel finding that the predialysis potassium concentration was significantly higher in the higher EDI group. Further analyses also indicated that the predialysis potassium concentration was an independent associated factor/risk factor of higher EPO demand. Our present study identified a novel risk factor for follow-up EDI/EPO demand and predialysis potassium concentration. However, the mechanisms underlying this association have not been uncovered and may be associated with the renewal of erythrocytes and their energy demand (16). Others' studies have shown that potassium ion transport may play an important role in the production of erythrocytes as well as Hb (16–18). Furthermore, the associations have also been reported between potassium levels and Hb in the red cell units that undergo changes during storage and processing (19).
Anti-EPO antibodies have been reported in a small number of chronic renal disease patients who were administered EPO α (8). Others' studies have also found that anti-EPO antibody prevalence in ESRD patients who receive ESA may be associated with EPO resistance and demand, resulting in anemia (9, 20). Studies in patients with some autoimmune diseases and patients with HIV revealed high levels of anti-EPO antibodies (8, 21). Thus, EPO antibodies may participate in a variety of diseases. Importantly, we have identified that the baseline anti-EPO antibody level was associated with follow-up EPO demand. Previous studies suggest that EPO is associated with Hb loss (22). In addition, EPO antibodies have been demonstrated to mediate pure red cell aplasia after treatment with recombinant EPO products (22, 23). Furthermore, anemia treated with ESAs continuously failed to obtain a sustained response, which may also be caused by EPO antibodies. Finally, we identified that a higher baseline anti-EPO antibody level was an independent risk factor for higher EPO demand, which may provide a novel strategy for prevention or risk classification of anemia as well as the direction of ESA use.
Limitations
We performed this prospective cohort study in 129 consecutive patients with ESRD who were undergoing dialysis and identified the predialysis potassium concentration, baseline anti-EPO antibody level, and age as independent risk factors for higher EPO demand. However, there are still three limitations to this study. First, the population size is relatively small. Second, there are many other factors that may be associated with EPO demand that should be included; however, we have not considered all of them owing to limited time and finances. Finally, the mechanisms underlying the associations between anti-EPO antibody and EPO demand have not been investigated, which warrants basic molecular research.
Conclusion
The baseline anti-EPO antibody level combined with an older age and a higher predialysis potassium ion concentration are independent risk factors for a higher follow-up EPO demand in maintenance dialysis patients with ESRD, which also indicated that a lower baseline anti-EPO antibody level was an independent associated factor of lower EPO demand. The novel risk factors identified in this study may allow prevention or risk classification of anemia as well as guidance for ESA use.
Data Availability Statement
The datasets generated for this study are available on request to the corresponding author.
Ethics Statement
The studies involving human participants were reviewed and approved by the ethics committee of Xinqiao Hospital, Army Medical University (Third Military Medical University). The patients/participants provided their written informed consent to participate in this study.
Author Contributions
YZ and JZ participated in the design of the study. YZ and S-ZB also drafted the manuscript and performed the statistical analysis. JZ reviewed and revised this manuscript critically for important intellectual content. YZ, ST, and KY collected the baseline history and baseline demographic data and the measurements of EPO and EPOR antibodies. The laboratory measurements were performed by YZ, YW, LN, and DW. The dialysis-related data were obtained by YW and WW.
Funding
This study was supported by the National Natural Science Foundation of China (grant no. 81400736) and Xinqiao Hospital, Army Medical University (grant no. 2016YLC36). We would like to thank all the individuals who participated in this study for their support.
Conflict of Interest
The authors declare that the research was conducted in the absence of any commercial or financial relationships that could be construed as a potential conflict of interest.
Supplementary Material
The Supplementary Material for this article can be found online at: https://www.frontiersin.org/articles/10.3389/fmed.2020.00109/full#supplementary-material
References
1. Yokoro M, Nakayama Y, Yamagishi SI, Ando R, Sugiyama M, Ito S, et al. Asymmetric dimethylarginine contributes to the impaired response to erythropoietin in CKD-Anemia. J Am Soc Nephrol. (2017) 28:2670–80. doi: 10.1681/ASN.2016111184
2. Okazaki M, Komatsu M, Kawaguchi H, Tsuchiya K, Nitta K. Erythropoietin resistance index and the all-cause mortality of chronic hemodialysis patients. Blood Purif. (2014) 37:106–12. doi: 10.1159/000358215
3. Afsar B, Saglam M, Yuceturk C, Agca E. The relationship between red cell distribution width with erythropoietin resistance in iron replete hemodialysis patients. Eur J Intern Med. (2013) 24:e25–9. doi: 10.1016/j.ejim.2012.11.017
4. Guerrero-Riscos MA, Montes-Delgado R, Seda-Guzman M, Praena-Fernandez JM. Erythropoietin resistance and survival in non-dialysis patients with stage 4-5 chronic kidney disease and heart disease. Nefrologia. (2012) 32:343–52. doi: 10.3265/Nefrologia.pre2012.Jan.11111
5. Khankin EV, Mutter WP, Tamez H, Yuan HT, Karumanchi SA, Thadhani R. Soluble erythropoietin receptor contributes to erythropoietin resistance in end-stage renal disease. PLoS ONE. (2010) 5:e9246. doi: 10.1371/journal.pone.0009246
6. Priyadarshi A, Shapiro JI. Erythropoietin resistance in the treatment of the anemia of chronic renal failure. Semin Dial. (2006) 19:273–8. doi: 10.1111/j.1525-139X.2006.00172.x
7. Sharma RK, Chakrabarti S. Anaemia secondary to erythropoietin resistance: important predictor of adverse outcomes in chronic obstructive pulmonary disease. Postgrad Med J. (2016) 92:636–9. doi: 10.1136/postgradmedj-2015-133814
8. Helegbe GK, Huy NT, Yanagi T, Shuaibu MN, Kikuchi M, Cherif MS, et al. Anti-erythropoietin antibody levels and its association with anaemia in different strains of semi-immune mice infected with plasmodium berghei ANKA. Malar J. (2013) 12:296. doi: 10.1186/1475-2875-12-296
9. Oh JG, Seong J, Han S, Heo TH. Development of an anti-EPO antibody detection kit based on lab-on-a-chip and bridging antibody technologies. Biologicals. (2018) 5:48–12. doi: 10.1016/j.biologicals.2018.05.005
10. Wang T, Hao SF, Fu R, Wang HQ, Shao ZH. Significance of anti-EPO receptor antibody in immune-related pancytopenia. Zhonghua Yi Xue Za Zhi. (2017) 97:1406–10. doi: 10.3760/cma.j.issn.0376-2491.2017.18.011
11. Okonko DO, Marley SB, Anker SD, Poole-Wilson PA, Gordon MY. Erythropoietin resistance contributes to anaemia in chronic heart failure and relates to aberrant JAK-STAT signal transduction. Int J Cardiol. (2013) 164:359–64. doi: 10.1016/j.ijcard.2011.07.045
12. Mallick S, Rafiroiu A, Kanthety R, Iqbal S, Malik R, Rahman M. Factors predicting erythropoietin resistance among maintenance hemodialysis patients. Blood Purif. (2012) 33:238–44. doi: 10.1159/000335256
13. Treister-Goltzman Y, Peleg R, Biderman A. A comparative study of iron deficiency anemia in bedouin and jewish women of childbearing age in Southern Israel. Popul Health Manag. (2019). doi: 10.1089/pop.2019.0177. [Epub ahead of print].
14. Hamarneh Z, Symonds EL, Kholmurodova F, Cock C. Older age, symptoms or anemia: which factors increase colorectal cancer risk with a positive fecal immunochemical test? J Gastroenterol Hepatol. (2019). doi: 10.1111/jgh.14888. [Epub ahead of print].
15. Jiang X, Gao M, Chen Y, Liu J, Qi S, Ma J, et al. EPO-dependent induction of erythroferrone drives hepcidin suppression and systematic iron absorption under phenylhydrazine-induced hemolytic anemia. Blood Cells Mol Dis. (2016) 58:45–51. doi: 10.1016/j.bcmd.2016.02.005
16. Duhm J, Gobel BO, Beck FX. Sodium and potassium ion transport accelerations in erythrocytes of DOC, DOC-salt, two-kidney, one clip, and spontaneously hypertensive rats. Role of hypokalemia and cell volume. Hypertension. (1983) 5:642–52. doi: 10.1161/01.HYP.5.5.642
17. Fincher RK, Strong JS, Jackson JL. Accuracy of measurements of hemoglobin and potassium in blood samples from peripheral catheters. Am J Crit Care. (1998) 7:439–43. doi: 10.4037/ajcc1998.7.6.439
18. Saini N, Basu S, Kaur R, Kaur J. Assessment of changes in plasma hemoglobin and potassium levels in red cell units during processing and storage. Transfus Apher Sci. (2015) 52:319–25. doi: 10.1016/j.transci.2015.01.009
19. Wang K, Wu J, Xu J, Gu S, Li Q, Cao P, et al. Correction of anemia in chronic kidney disease with angelica sinensis polysaccharide via restoring EPO production and improving iron availability. Front Pharmacol. (2018) 9:803. doi: 10.3389/fphar.2018.00803
20. Lee H, Yang J, Kim H, Kwon JW, Oh KH, Joo KW, et al. Improvement in erythropoieis-stimulating agent-induced pure red-cell aplasia by introduction of darbepoetin-alpha when the anti-erythropoietin antibody titer declines spontaneously. J Korean Med Sci. (2010) 25:1676–79. doi: 10.3346/jkms.2010.25.11.1676
21. Schecter JM, Mears JG, Alobeid B, Gaglio PJ. Anti-erythropoietin antibody-mediated pure red cell aplasia in a living donor liver transplant recipient treated for hepatitis C virus. Liver Transpl. (2007) 13:1589–92. doi: 10.1002/lt.21332
22. Tsubata EK, Kawamura S, Ishimoto T, Tomiyama-Miyaji Y, Watanabe C, Sekikawa H, et al. Protection against malaria by anti-erythropoietin antibody due to suppression of erythropoiesis in the liver and at other sites. Immunol Cell Biol. (2005) 83:638–42. doi: 10.1111/j.1440-1711.2005.01385.x
Keywords: anti-erythropoietin antibody, predictor, erythropoietin demand, maintenance dialysis, cohort study
Citation: Zhang Y, Bian S-Z, Yang K, Wang Y, Tang S, Wang W, Wang D, Nie L and Zhao J (2020) Baseline Soluble Anti-erythropoietin Antibody Level Is an Independent Associated Factor for Follow-Up Erythropoietin Demand in Maintenance Dialysis Patients With End-Stage Renal Disease: A Prospective Cohort Study. Front. Med. 7:109. doi: 10.3389/fmed.2020.00109
Received: 09 November 2019; Accepted: 10 March 2020;
Published: 07 April 2020.
Edited by:
Xueying Zhao, Morehouse School of Medicine, United StatesReviewed by:
Praveen Kumar Potukuchi, University of Tennessee Health Science Center (UTHSC), United StatesDaw-Yang Hwang, National Health Research Institutes, Taiwan
Copyright © 2020 Zhang, Bian, Yang, Wang, Tang, Wang, Wang, Nie and Zhao. This is an open-access article distributed under the terms of the Creative Commons Attribution License (CC BY). The use, distribution or reproduction in other forums is permitted, provided the original author(s) and the copyright owner(s) are credited and that the original publication in this journal is cited, in accordance with accepted academic practice. No use, distribution or reproduction is permitted which does not comply with these terms.
*Correspondence: Jinghong Zhao, emhhb2poQHRtbXUuZWR1LmNu
 Ying Zhang
 Shi-Zhu Bian
 Kun Yang
 Yiqing Wang
 Sha Tang
 Weili Wang
 Daihong Wang
 Ling Nie
 Jinghong Zhao