 Jun Han
 Zai-Ming He1,2,3
94% of researchers rate our articles as excellent or good
Learn more about the work of our research integrity team to safeguard the quality of each article we publish.
Find out more
HYPOTHESIS AND THEORY article
Front. Mech. Eng. , 10 March 2025
Sec. Mechatronics
Volume 11 - 2025 | https://doi.org/10.3389/fmech.2025.1562920
In response to the problems of low efficiency and safety hazards in traditional subsea pipeline intersection isolation release operations, this study designs a new type of automatic deployment device for subsea oil and gas pipeline intersection isolation, aimed at replacing manual and unmanned underwater vehicles (ROVs) for underwater deployment and monitoring. The device adopts an innovative framework structure design, significantly improving its resistance to water flow, and enhancing the operability and accuracy of underwater operations through a ducted propeller propulsion system. This study used computational fluid dynamics (CFD) combined with multiple reference frame (MRF) method to conduct detailed simulation analysis of the fluid dynamics characteristics of the device under different motion states, and explored its optimal working conditions. The simulation results show that during rotational motion, when the flow velocity exceeds 0.5 m/s, the resistance experienced by the device significantly increases, reaching a maximum of 7066.33 N. In addition, this study conducted an in-depth analysis of the causes of flow separation and resistance distribution under different motion states, revealing the important impact of frame style exterior design on the hydrodynamic performance and stability of the device. The research results indicate that the automatic placement device can efficiently complete the placement task of isolation materials in a water flow environment of 0.75 m/s, with a maximum driving torque of 6750 N*m, and has good engineering application prospects. The design proposed in this article not only provides a new perspective and solution for deep-sea pipeline protection technology, but also lays an important theoretical foundation for research and application in this field through innovative structural design and advanced simulation analysis methods.
In recent years, the decline of onshore oil and gas resources has increasingly highlighted the need for the development of offshore oil and gas resources. Submarine oil and gas pipelines are becoming increasingly important as transportation channels for offshore oil and gas resources. Submarine oil and gas pipelines have the advantages of continuous transmission, large transportation capacity, high efficiency, and low cost (Wang, 2024). They are the main way to transport fluid media and the lifeline of resource development projects (Zhou et al., 2011; Guo et al., 2018). The number of submarine oil and gas pipelines around the world is increasing rapidly, and the Langeled pipeline from Norway to the United Kingdom is the longest submarine oil and gas transportation pipeline in the world, with a total length of 1,200 km (Meng, 2016). The depth of the submarine oil and gas pipeline laid by the pipelayer “Solitaire” reached a depth of 2,775 m, which is the deepest submarine oil and gas pipeline in the world. In order to avoid risks in the operation process and reduce the difficulties in subsequent pipeline or cable maintenance operations, necessary treatment is usually carried out at the intersection position of the new submarine pipeline and cable laying route (Guo et al., 2019). At present, there are four common treatment methods: direct covering of cement briquettes, cement pier support spanning, correction of cement grouting package, and pre-filled cement grouting package (Liu and Yinhai, 2018). These disposal options all rely on the monitoring and implementation of divers or remotely operated vehicles (ROVs), which not only significantly prolongs the operation cycle, but also leads to increased costs and heightened safety risks for operators (Luo et al., 2024). With the continuous development of science and technology, achieving a high degree of automation and intelligence of such deployment tasks has become one of the key goals to be overcome in this field.
The submarine oil and gas pipeline isolation device is a new type of device that completes relevant operations underwater according to the set tasks, and a variety of similar deployment devices have been developed in recent years around the world. In the protection and isolation technology with oil and gas pipelines, the deployment and recovery device has become a hot topic of research in recent years. The “MDS” series of cement flexible pad deployment system for submarine oil and gas pipelines developed by Offshore Marione Equipment in the United Kingdom has four vector arranged propellers, which can achieve accurate horizontal movement and positioning under water, which greatly improves the deployment efficiency (Musarra, 2013). The “AssoMat” series of submarine pipe and cable protection products developed by Assodivers Ltd in Greece is equipped with special instruments including cameras, lights, sonars, pipes, and cable beacons in order to work efficiently in various conditions (Assodivers-Ltd, 2020). However, this type of automatic placement device has limitations and can only be used for a certain type of protective product.
In this paper, an automatic deployment device for the pretreatment structure of submarine oil and gas pipeline intersection with high automation and electrification characteristics is introduced, which has good adaptability to different submarine terrains, effectively solves the shortcomings of the mother ship release mode, and can meet the deployment requirements of different sea areas. The structural design of the device was carried out, and the hydrodynamic performance of the device in different motion states was simulated by using Fluent software.
The proper placement of isolation devices is a crucial part of maintaining pipeline safety. At present, the amplification of isolation devices is mostly dependent on diver or ROV-assisted release. In view of this working situation, the structure and system design and hydrodynamic performance simulation of the automatic deployment device are carried out, which can realize the real-time transmission of underwater operation screen and realize the automatic deployment of the isolation structure.
The automatic deployment device is connected to the mother ship through a lifting cable, which can realize forward and backward direct navigation, left and right traversing, floating and diving, and rotating movement underwater. Its structure is mainly composed of underwater motors, hydraulic compensators, propellers, observation and positioning gimbals, slings and hydraulic systems. Among them, the observation and positioning gimbal includes high-definition cameras, lights, beacons, and sonar. Thrusters include horizontal thrusters and vertical thrusters. The load-bearing frame is used to carry all kinds of electronic devices in the upper part and the cement briquettes in the lower part. In the orange pressure chamber, there are also control valve boxes, hydraulic pumps, compensators and other devices. The structure of the automatic deployment device is shown in Figure 1. The choice of the bearing frame material of the automatic placement device affects the performance and working strength of the device. Considering the operating requirements and cost of the automatic deployment device, it is proposed to use low-alloy high-strength steel Q355D material for the frame, which can fully meet the various application requirements of the automatic deployment device. The overall design parameters of the automatic deployment device are shown in Table 1.
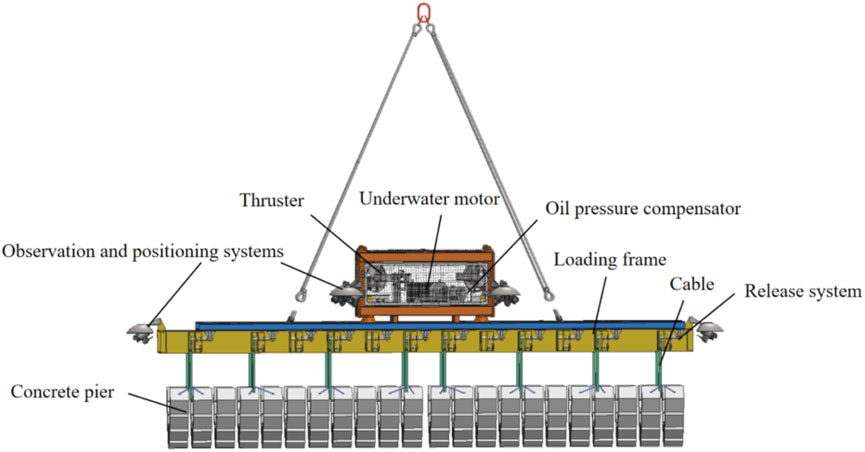
Figure 1. Indicators of overall design parameters.
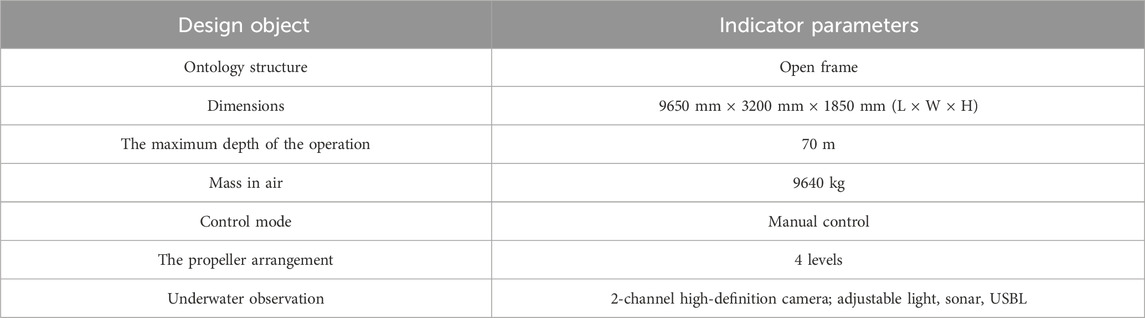
Table 1. Structural diagram of automatic deployment device.
The frame structure of the automatic placement device adopts a combination of square frame and load-bearing frame design, which not only effectively protects the pressure resistant electronic compartment inside, but also effectively carries more weight. The pressure resistant electronic compartment is fixed in the middle of the load-bearing frame, and position and load sensors are also arranged on both sides to detect its displacement changes during operation. There is also a push rod frame on the upper part of the load-bearing frame, which is used to place the release system of the automatic laying device. The release system consists of an active rod group, mounting pin, sling, oil cylinder, and oil cylinder position sensor, which can be used in conjunction with an observation and positioning pan tilt to achieve unmanned remote release. The specific working process is as follows: park the laying device on the cement press block, and have the worker attach the fixed end of the sling to the mounting pin; The oil cylinder moves to the middle position, triggering the middle position signal of the sensor, driving the movable rod group to move the end of the mounting rod to the middle of the mounting vertical plate, making room for the suspension strap to be mounted. Then, the movable end of the suspension strap is passed through the cement pressure block lifting ring and mounted onto the mounting rod; After the movable end of the sling is mounted, the oil cylinder shrinks to the fully retracted position, triggering the sensor’s fully retracted position signal, which drives the movable rod group to completely pass through the mounting vertical plate, limiting the movable end of the sling to the mounting rod; After lifting the placement device to the target position, the oil cylinder is pushed out to the fully pushed out position, triggering the push out position signal of the sensor to drive the movable rod group to remove the mounting rod from the middle interval of the mounting vertical plate, release the movable end of the sling, and place the cement pressure block at the target position. The structure of the release system is shown in Figure 2. Figure 3 shows the action process of releasing system.
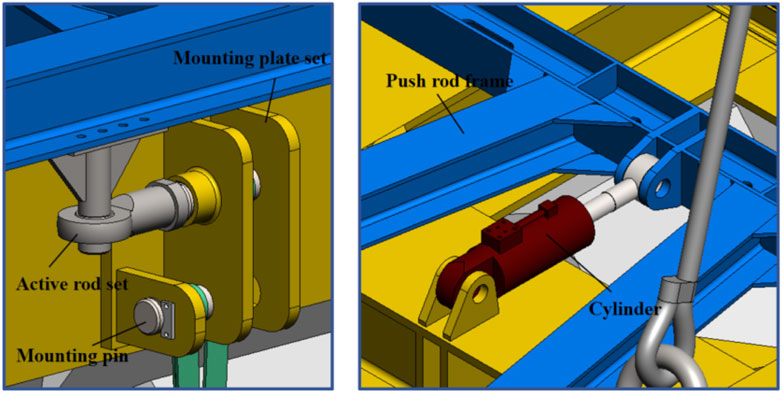
Figure 2. Release system structure composition.
Figure 3. Release the system working process. (A) Pre mount (B) mount (C) lock (D) release.
There are a variety of working conditions in the operation of the automatic placement device:
1. Mounting: After the movable end of the sling is loaded, the oil cylinder shrinks to the fully indented position, and the full indented position signal of the cylinder position sensor will be triggered at this time, and the push rod and the movable rod group will be driven at the same time, so that the mounting rod will completely pass through the mounting stand, and the movable end of the sling will be limited to the mounting rod.
2. Dive: Use the mother ship to lift the deployment device to the target position, and then drop the automatic deployment device through the cable to the specified point. The control console of the ship controls the thruster to drive the deployment device to rotate or move to complete the adjustment of position and angle, pushes the oil cylinder to the fully pushed out position, triggers the full launch position signal of the oil cylinder position sensor, and simultaneously drives the push rod and the movable rod group to withdraw the loading rod from the middle interval of the mounting stander, releases the movable end of the sling, and puts the concrete pier cloth to the target position.
3. Release: After the angle and position of the automatic deployment device are adjusted by the propeller, the oil cylinder is pushed out to the fully pushed out position, the full push position signal of the oil cylinder position sensor is triggered, and the push rod and the movable rod group are driven to withdraw the loading rod from the middle interval of the mounting riser, release the movable end of the sling, and put the concrete pier layout to the target position.
4. Recovery: After the release of a piece of concrete cement briquette, the console will hoist the deployment device back to the mother ship, place it on the next batch of cement briquettes to be deployed, and repeat the previous operation.
Figure 4 shows the working conditions of the automatic deployment device, wherein Figure 4A is the submersible condition, Figure 4B is the release condition, and Figure 4C is the recovery condition.
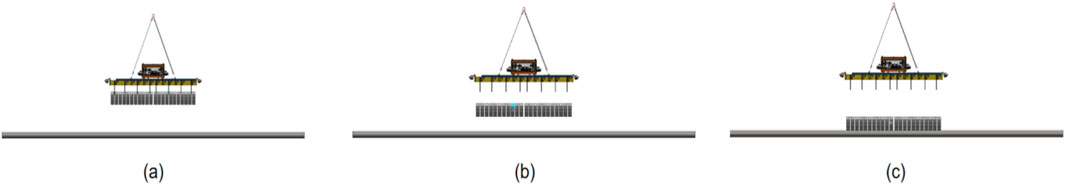
Figure 4. The workflow of an automatic placement device.
The hoisting frame of the cement briquette deployment device is the main bearing structure of the underwater deployment device under different working conditions such as deployment, recycling, and fastening, and also provides an integrated platform for the installation, commissioning and completion of a variety of operation tasks of various equipment, so the strength must be checked to ensure that the deployment device can operate normally underwater. The dry weight of the cement briquetting lifting frame is about 6.76 tons, and the design water depth is 100 m. In order to increase the bearing capacity, the main material of the frame is selected as Q355D high-strength steel; The fasteners and lifting rings on it are made of 316 stainless steel. 12 mounting plate groups are arranged on one side of the hoisting frame outside, a total of 24 mounting plate groups are arranged, the spacing of ten mounting plate groups in the middle of each side is 620 mm, and the spacing between the front and rear two mounting plate groups and the origin point is 3,810 mm, so as to ensure that the mounting point corresponds to the hanging point of the structure. The force of the equipment and cement briquetting mounted on the frame structure is very complex and cumbersome, and the weight difference is also large, and the smaller equipment has little influence on the strength of the frame, which can be ignored. In this calculation, the gravitational acceleration is taken as 10 m/s2, and all loads are taken as 3 times the gravitational acceleration. The weight of the frame itself can be simulated by setting a volume load of 3 g downward; All other loads are applied to the frame of the installation position or its installation base plane in the form of uniform load or concentrated force, and the maximum weight of cement briquetting is 14 tons, and the lifting weight is calculated according to the requirements of technical indicators. The gravitational force is set to gravitational force g = 30 m/s2, the load of the control system is distributed on the butt frame, the cement briquetting load is distributed at the position of 16 lifting points, and the lifting points are fixed constraints. Figure 5 illustrates the meshing, constraints, and load distribution of the cement briquette mount and release structural system. Table 2 shown the calculation of the load of the hoisting frame.
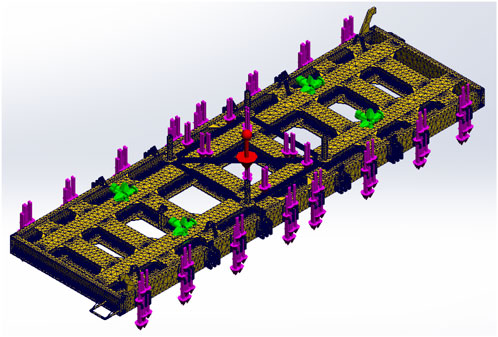
Figure 5. Meshing, constraint and load distribution of the cement briquette mounting and release structure system.
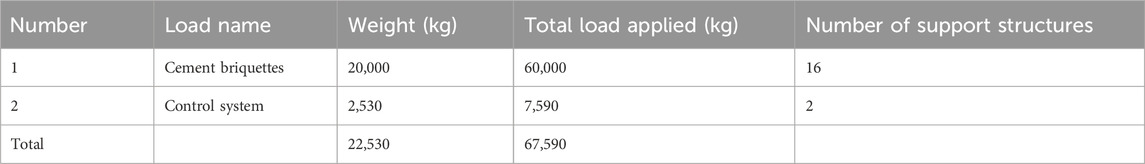
Table 2. Calculation of the load of the hoisting frame.
The simulation results show that the maximum equivalent stress of the lifting frame is 143.2 MPa, which occurs at the four hanging points connected with the hanging cable, and the Von Mises stress of all elements of the frame as a whole is less than 177.5 MPa, that is, the Von Mises stress of all components is less than the allowable stress corresponding to the Q355D material of low-alloy high-strength steel. Therefore, the design of the hoisting frame can meet the strength and pressure requirements of the underwater working water depth. The maximum deformation of the hoisting frame is 1.329 mm, which occurs in the middle of the frame, which is negligible, and the deformation relative to the overall scale of the frame is 1.329/9,310*100 = 0.014%, which meets the overall stiffness requirement of less than 0.4% of the deformation of Offshore Containers and Associated Lifting Sets (2018). The stress analysis contour of the hoisting frame is shown in Figure 6.
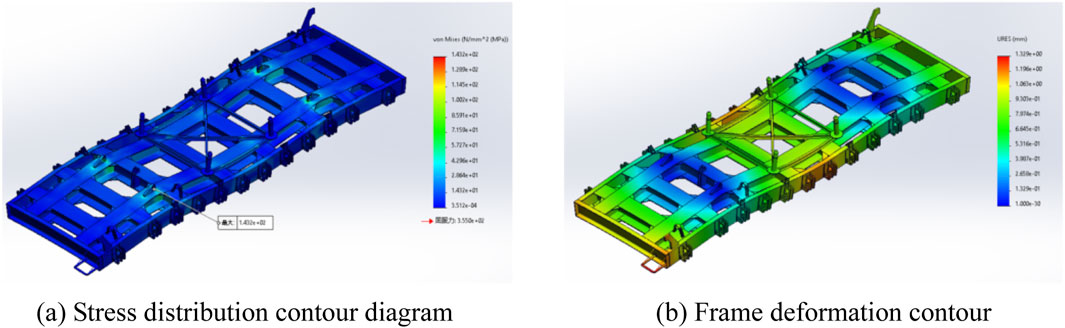
Figure 6. Stress analysis diagram of the hoisting frame. (A) Stress distribution contour diagram (B) Frame deformation contour.
The resistance of the deployment device during the movement is an important basis for the subsequent system design. The deployment device was modeled, and its frame structure consisted of a pressure-resistant chamber and a load-bearing frame. A simplified diagram of the deployment device model is shown in Figure 7.
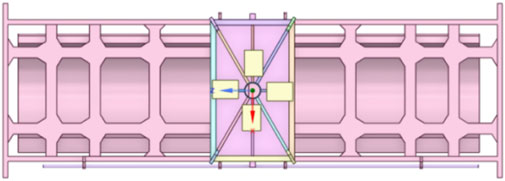
Figure 7. Simplified diagram of the automatic placement device model.
Computational fluid dynamics (CFD) simulation software was used to calculate the resistance of the automatic placement device using a computational model. When the automatic deployment device is operated underwater, it is necessary to fine-tune the position and posture, and there are two main movements: direct flight and rotation. In addition, the automatic deployment unit does not require too high a speed during underwater operation. In order to adapt to the actual work needs. The design direct motion speed is 0.1 m/s∼1 m/s, and the rotational motion speed is 0.0131 rad/s, that is, the rotation is 45.06° per minute.
When the direct motion is in direct motion, when the working speed is 0.1 m/s∼1 m/s, the resistance is measured. The scale of the entire computational domain is 4–5 times that of the corresponding direction scale of the ship inspection underwater robot, which can counteract the blocking effect (Tian et al., 2017). The inlet is the velocity inlet condition, and the outlet is set to the pressure outlet condition. The calculation domain and boundary conditions settings are shown in Figure 8.
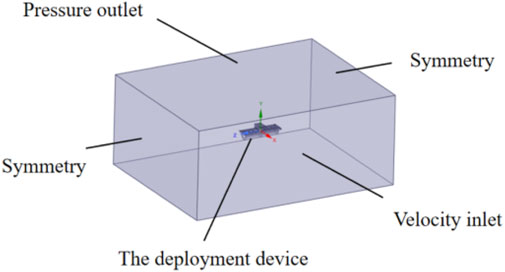
Figure 8. Calculation domain and boundary condition settings for direct flight motion.
After the automatic deployment device reaches the designated sea area, it needs to adjust its position by rotation to accurately release the isolation device. MRF technology can deal with the rotation of rotating parts by introducing a relative motion reference frame, which can well analyze the underwater flow field distribution of symmetrical objects. Therefore, MRF technology is used to divide the rotational motion calculation domain into two flow fields: external stationary and internal motion. A constant velocity is applied at the inlet with an initial velocity of 0.1 m/s, which is subsequently increased to 1 m/s. The outlet is set to a pressure outlet. Applies symmetrical boundary conditions on both sides of the zone. The compute domain settings are shown in Figure 9.

Figure 9. Rotational motion calculation domain and boundary condition settings.
After the above calculation domain and boundary conditions are set, the drag simulation results when the inlet velocity is set to 0.1 m/s∼1 m/s are shown in Figure 10. Table 3 shown the change of different resistance at different speeds. With an increase in speed, the resistance of the automatic placement device under the direct motion of the automatic placement device is constantly increasing, reaching 7102.50 N at 1 m/s. Four velocity values, 0.2 m/s, 0.4 m/s, 0.8 m/s, and 1 m/s, were selected in Table 1 to analyze the resistance composition under the corresponding conditions. The damping force experienced by underwater robots during direct navigation can be divided into frictional resistance and differential pressure resistance. Frictional resistance is the reactive force exerted by water on an object in a flowing water area (Yangbo, 2024). This is due to the viscosity of water. When an underwater robot moves, its surface rubs against surrounding water molecules, creating this resistance; Differential pressure resistance is caused by the viscosity of water, resulting in the resistance of fluid on the surface of the underwater robot. When the underwater robot moves, its front end will push water, while its rear end will be filled with water. Due to the viscosity of water, this flow creates a pressure difference before and after, resulting in pressure resistance. The automatic placement device adopts an open frame design, which features a large projection area on the upstream side, leading to a rapid increase in shape resistance. In addition, the device is significantly smaller in width than its length, which is not conducive to the formation of a significant viscous boundary layer effect. Therefore, in the composition of total resistance, the proportion of viscous resistance is much lower than that of shape resistance.
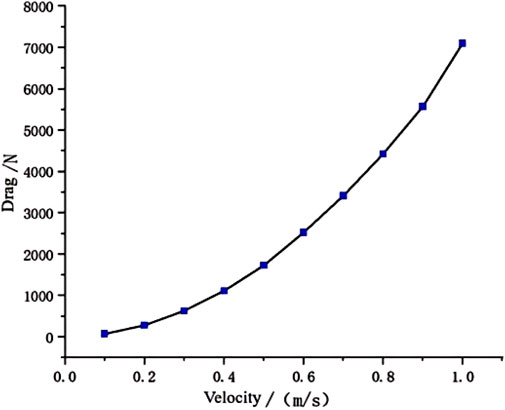
Figure 10. Resistance simulation results.
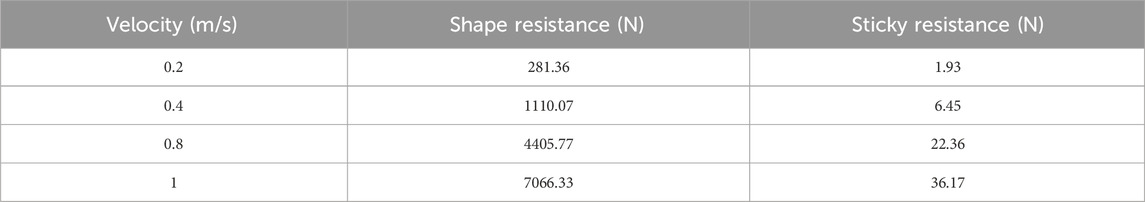
Table 3. Resistance composition of automatic placement device.
In Figure 11A, When the flow velocity gradually increases from a static state (0 m/s) to 1 m/s, the corresponding resistance value sharply rises from the reference zero value to the order of 7000 N. Specifically, the slope of the resistance velocity curve increases continuously with increasing velocity, which conforms to the classical theoretical framework in fluid mechanics that resistance is proportional to the square of velocity. This suggests that the device may face exponential energy consumption challenges in high-speed sections. Especially the maximum resistance observation value of 7000 N provides clear boundary condition parameters for determining the critical operating conditions of the device. The speed difference between the windward and leeward sides is almost zero. At extremely low flow rates, the impact of fluid on the device is very weak, and it is almost impossible to form vortex structures. Meanwhile, the influence of rotational motion on velocity distribution can be almost negligible, resulting in a very uniform overall velocity distribution. However, as the flow velocity increases, the vortex structure at the rear of the deployment device develops rapidly, and the speed difference between the windward and leeward sides gradually increases. The further increase in flow velocity leads to an enhanced impact of the fluid on the device, and the vortex strength continues to rise. At the same time, the influence of rotational motion on velocity distribution is also enhanced, making the overall velocity distribution more uniform. Figure 11B reveals a significant linear response mechanism between torque and motion speed for the same underwater device in the velocity range of 0.25–1.00 m/s. The quantitative relationship obtained through hydrodynamic simulation shows that when the device’s motion speed linearly increases from the reference value of 0.25 m/s–1.00 m/s, the corresponding torque value synchronously increases from the order of 500 N*m–2500 N*m, forming an accurate 2.5-fold incremental relationship. From the perspective of dynamic mechanism analysis, this linear feature differs from the classical fluid resistance square law, indicating the existence of a velocity dependent energy dissipation mechanism in the system: it may include a transmission system dominated by viscous friction effects in the motion mechanism, or be controlled by active torque compensation devices. It is particularly noteworthy that in the medium speed range of 0.25–0.75 m/s, the torque growth rate maintains a constant gradient of 2000 N*m/s, but when approaching the critical speed of 1.00 m/s, the slope of the curve shows a 6.7% increase (reaching 2133 N*m/s).
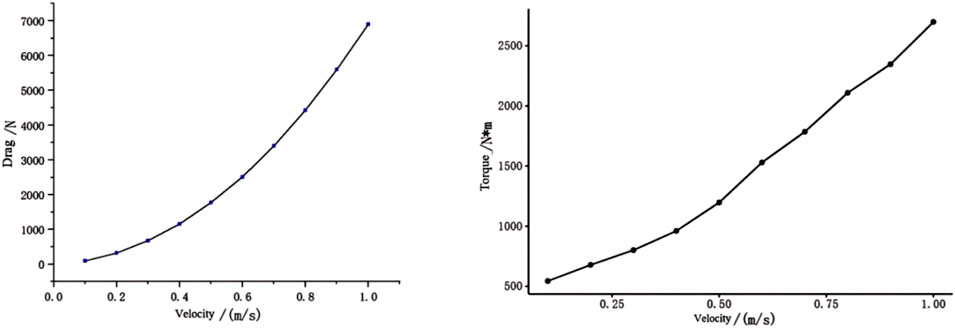
Figure 11. Changes in resistance and torque of the automatic placement device under rotational motion.
In Figure 12, in the operating condition with a maximum inflow velocity of 1.0 m/s (Figure 12A), a large area of blue low-speed band appears in the wake region of the device, which is due to the boundary layer separation effect caused by high-speed flow. It is worth noting that the stagnation area on the upstream side of the device presents a circular yellow high-speed zone, indicating that the streamline undergoes rapid compression and acceleration at this point, forming a local velocity peak area. When the incoming velocity decreases to 0.75 m/s (Figure 12B), the low-speed region of the wake shrinks but the velocity gradient in the vortex core region increases, and the blue contour lines exhibit fractal structural characteristics. At this time, a symmetrical yellow high-speed jet is generated on the back pressure surface of the device, and its spatial angle is increased by 12° compared to the working condition in Figure 12A, indicating that the flow separation point is migrating towards the tail. In the 0.5 m/s operating condition (Figure 12C), the flow exhibits obvious laminar turbulent transition characteristics, and periodic vortex street structures appear in the wake region, corresponding to the striped pattern of alternating blue low-speed zone and yellow high-speed zone. The thickness of the boundary layer on the surface of the device increased by 43%, resulting in an increase in the coverage of the near wall high-speed zone (yellow) to 25%, which verifies the strengthening effect of the Reynolds number decrease on the flow viscosity effect. The operating condition with a minimum speed of 0.25 m/s (Figure 12D) exhibits a unique flow topology: the wake region is completely dominated by yellow high-speed fluid, forming a jet channel that runs through the flow field. This phenomenon is contrary to the flow characteristics dominated by viscous dissipation at low Reynolds numbers. Vortex field assisted analysis shows that the anomalous high-speed region is due to the induced velocity field superposition effect of large-scale separated vortices. The anomalous velocity distribution pattern revealed by this cloud map shows that as the incoming velocity decreases, the proportion of the high-speed zone in the flow field increases nonlinearly from 21% (Figure 12A) to 68% (Figure 12D), essentially reflecting the reversal of the competitive relationship between inertial and viscous forces. This discovery has important implications for the study of low-speed handling stability of underwater devices, especially the global high-speed phenomenon observed in the working condition shown in Figure 12D.
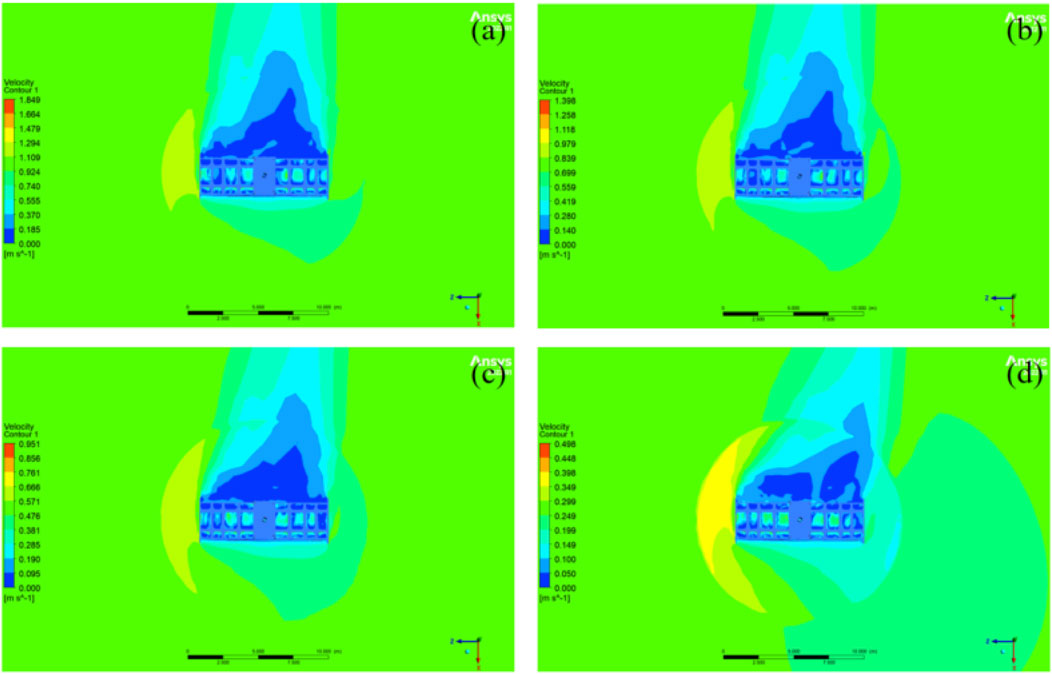
Figure 12. (A–D) Rotational velocity contour of the deployment device.
Figure 13A–D constitute two groups of pressure response modes. In the high-pressure difference group (Figures 13A, B), a red high-pressure core (400 PA) with a diameter of 0.3 d is formed in the stagnation area of the upstream surface, and the deviation between its spatial structure and the predicted value of the classical potential flow theory is≤8%, while a blue low-pressure groove (−1600 pa) extending axially appears on the downstream surface, corresponding to the initial falling phase of the Karman vortex street. The low differential pressure group (Figures 13C, D) presents a quasi-static pressure distribution: the maximum differential pressure decreases from −1600 PA to −400 PA, and the surface separation point migrates to the tail by 12% chord length. The annular pressure saddle (−92.3 PA) can be seen in Figure 13C, and its topology conforms to the transition characteristics of bistable flow; Figure 13D the low-pressure area on the back flow surface is broken into discrete vortex cell structure (−246.2 PA), and the equivalent diameter of a single vortex cell is about 0.15 d, corresponding to the subharmonic resonance state with Strouhal number st = 0.21. Figure 13 reflect a common characteristic: on the windward side of the deployment device, the pressure may be higher, forming a high-pressure zone. On the leeward side, due to the formation of vortices and separation of fluids, the pressure may be lower, forming a low-pressure zone. However, there are also differences in pressure cloud maps at different speeds: as the flow velocity increases, the high-pressure zone on the windward side and the low-pressure zone on the leeward side may become more pronounced. This is because the impact of fluid on the device is stronger at high flow rates, resulting in an increase in pressure differences. On the contrary, as the flow velocity decreases, the pressure difference between the windward and leeward sides may gradually decrease. At extremely low flow rates (as shown in Figure 13D), the pressure distribution may be very uniform, making it almost impossible to distinguish between high-pressure and low-pressure zones. Therefore, in the actual operation of the laying device, choosing reasonable working conditions is of great significance for completing the task with higher efficiency.
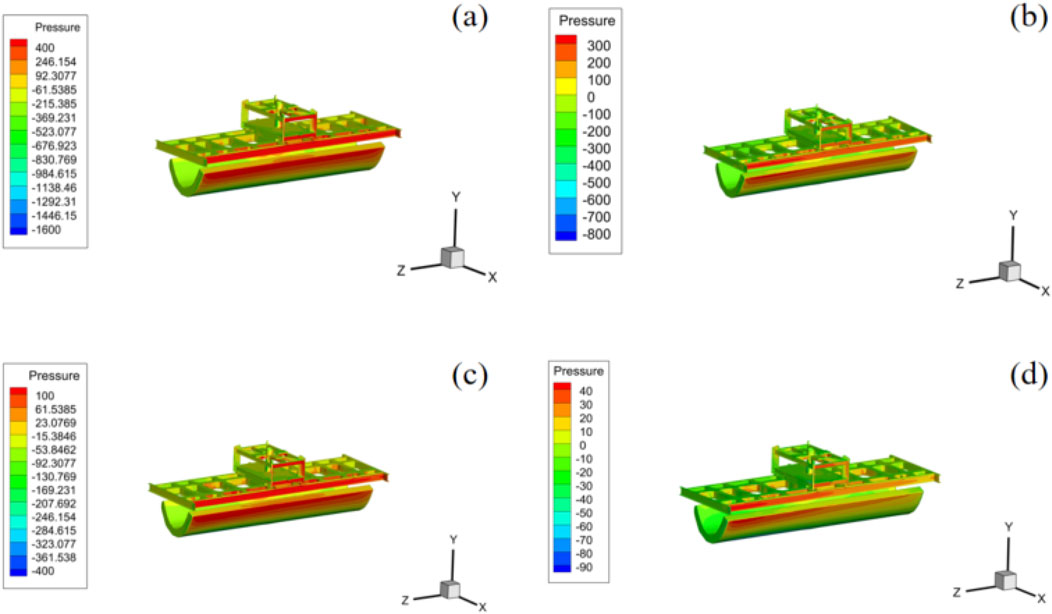
Figure 13. (A–D) Rotational pressure contour of the deployment device.
According to the hydrodynamic analysis of the direct navigation movement, the maximum horizontal force of the heading resistance received by the deployment device is about 1800 N*m when the heading adjustment speed is selected at an angle of 90 angle in 2 min in the water flow environment of 0.75 m/s. The driving torque required for motion control is 2714 N*m, and the total driving torque is 4500 N*m, and the total driving torque of the propeller is 6750 N*m by using 2 times the safety factor.
The torque T is calculated as follows in Equation 1:
where:
Therefore, the thrust of the propeller was selected as a maximum thrust of 320 kg, and the torque generated by the system was 13,800 N*m: as shown in the figure below. The working pressure of the thruster is 21 MPa, the jackpot power of the thruster is about 18 kw, and the maximum flow requirement is 50 L/min. Figure 14 illustrates how the thrusters are laid out.
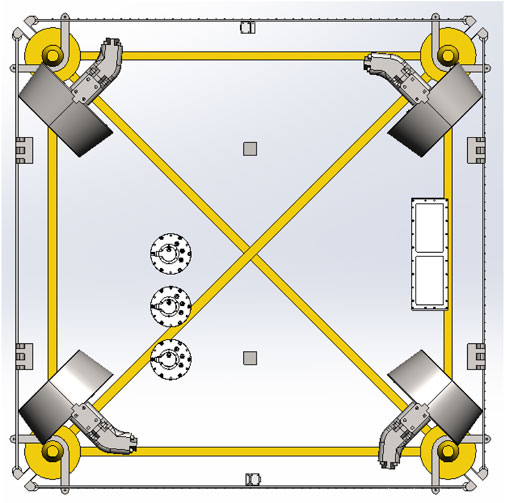
Figure 14. Layout of the thruster position.
This study addresses the issues of low efficiency and high safety risks associated with traditional subsea pipeline intersection isolation placement operations. A new type of automatic placement device has been designed, and its hydrodynamic performance has been systematically studied. The device adopts an open frame structure and a ducted propeller propulsion system, significantly improving its resistance to water flow and operational accuracy. By combining CFD with multiple reference frame (MRF) method, the resistance characteristics under direct and rotational motion were simulated and analyzed, revealing the nonlinear effect of flow velocity on resistance (such as a sharp increase in resistance to 7066.33 N when the flow velocity exceeds 0.5 m/s), and quantifying the difference in the proportion of shape resistance and viscous resistance (shape resistance accounts for over 99%). In addition, the structural strength verification shows that the maximum equivalent stress of the suspended frame is 143.2 MPa, which meets the strength and stiffness requirements for deep-sea operations. The research results indicate that the device can efficiently complete the deployment task at a flow rate of 0.75 m/s, with a maximum driving torque of 6750 N*m, verifying its engineering feasibility.
Future research can be conducted in the following directions: firstly, optimizing the framework shape design based on the distribution law of resistance to reduce energy loss in high-speed flow fields; Secondly, integrating artificial intelligence algorithms and multimodal sensors to enhance the adaptive positioning capability of complex seabed terrain; Thirdly, expand the operating depth of the device to the kilometer level sea area and conduct long-term stability testing in actual marine environments. In addition, the design concept and analysis method of the device can be further extended to scenarios such as submarine cable protection and deep-sea mining equipment, providing theoretical support and technical reference for the intelligent development of marine engineering equipment.
The original contributions presented in the study are included in the article/supplementary material, further inquiries can be directed to the corresponding author.
JH: Writing–original draft, Writing–review and editing. Z-MH: Formal Analysis, Methodology, Writing–review and editing, Project administration. LM: Conceptualization, Writing–review and editing, Formal Analysis. X-FL: Data curation, Methodology, Software, Writing–review and editing. J-LW: Project administration, Resources, Writing–review and editing.
The author(s) declare that no financial support was received for the research, authorship, and/or publication of this article.
The authors declare that the research was conducted in the absence of any commercial or financial relationships that could be construed as a potential conflict of interest.
The author(s) declare that no Generative AI was used in the creation of this manuscript.
All claims expressed in this article are solely those of the authors and do not necessarily represent those of their affiliated organizations, or those of the publisher, the editors and the reviewers. Any product that may be evaluated in this article, or claim that may be made by its manufacturer, is not guaranteed or endorsed by the publisher.
Assodivers-Ltd (2020). The biodiversity heritage library. Available at: https://wwwassodiversgr.
Guo, X. S., Nian, T. K., Zheng, D. F., and Yin, P. (2018). A methodology for designing test models of the impact of submarine debris flows on pipelines based on Reynolds criterion. Ocean. Eng. 166 (OCT.15), 226–231. doi:10.1016/j.oceaneng.2018.08.027
Guo, X. S., Zheng, D. F., Nian, T. K., and Yin, P. (2019). Effect of different span heights on the pipeline impact forces induced by deep-sea landslides. Appl. Ocean Res. 87, 38–46. doi:10.1016/j.apor.2019.03.009
Liu, F., and Yinhai, Yu (2018). Research on the treatment methods for the intersection points of submarine pipelines at home and abroad. China Petroleum Chem. Stand. Qual. (7), 2.
Luo, G. S., Wang, Z. C., Chen, Y., Wang, F., Zhang, J. F., Ma, Z. Q., et al. (2024). Design and hydrodynamic analysis of an automated polymer composite mattress deployment system for offshore oil and gas pipeline protection. Mar. Geores Geotechnol., 1–17. doi:10.1080/1064119x.2024.2393732
Meng, W. (2016). How to ensure the security of the “energy blood vessels” A grand decryption of pipeline anti-corrosion and detection technologies. Pet. Knowl. (5), 4.
Musarra, S. P. (2013). Concrete mattresses offer more than just pipeline protection. Offshore Eng. 38 (9).
Tian, W., Mao, Z., Zhao, F., and Zhao, Z. (2017). Layout optimization of two autonomous underwater vehicles for drag reduction with a combined CFD and neural network method. Complexity 2017 (2, article 7), 1–15. doi:10.1155/2017/5769794
Wang, P. (2024). Research and design of submarine pipeline corrosion detection system [D]. Harbin Engineering University.
Yangbo, H. (2024). “Mechanical engineering,” in Design and mechanical property analysis of underwater dual-arm robot. Xi'an Technological University.
Keywords: automatic deployment device, innovative framework structure design, CFD with MRF, a ducted propeller propulsion system, improving resistance to water flow
Citation: Han J, He Z-M, Ma L, Li X-F and Wan J-L (2025) Design and hydrodynamic analysis of subsea development automatic placement devices. Front. Mech. Eng. 11:1562920. doi: 10.3389/fmech.2025.1562920
Received: 18 January 2025; Accepted: 17 February 2025;
Published: 10 March 2025.
Edited by:
Yaoyao Wang, Nanjing University of Aeronautics and Astronautics, ChinaCopyright © 2025 Han, He, Ma, Li and Wan. This is an open-access article distributed under the terms of the Creative Commons Attribution License (CC BY). The use, distribution or reproduction in other forums is permitted, provided the original author(s) and the copyright owner(s) are credited and that the original publication in this journal is cited, in accordance with accepted academic practice. No use, distribution or reproduction is permitted which does not comply with these terms.
*Correspondence: Jun Han, MzgwNDYwMDMyQHFxLmNvbQ==
Disclaimer: All claims expressed in this article are solely those of the authors and do not necessarily represent those of their affiliated organizations, or those of the publisher, the editors and the reviewers. Any product that may be evaluated in this article or claim that may be made by its manufacturer is not guaranteed or endorsed by the publisher.
Research integrity at Frontiers
Learn more about the work of our research integrity team to safeguard the quality of each article we publish.