
94% of researchers rate our articles as excellent or good
Learn more about the work of our research integrity team to safeguard the quality of each article we publish.
Find out more
ORIGINAL RESEARCH article
Front. Mech. Eng., 07 March 2025
Sec. Tribology
Volume 11 - 2025 | https://doi.org/10.3389/fmech.2025.1522524
This article is part of the Research TopicVisualization Techniques in TribologyView all 17 articles
 Hiroshi Shiomi*
 Shingo Obara
This study measures the changes in the viscosity and oil volume of lubricants in a vacuum sliding test under starved EHL to evaluate the lubrication life of a small amount of lubricants, and investigates their time transition and a mechanism of lubrication life. Starved EHL is observed in ball bearings lubricated with a small amount of lubricant, which require low friction torque even at high speeds, such as bearings used in artificial satellites. Under starved oil conditions, the oil film formed in the contact area becomes thin, so it is important to accurately estimate the oil film thickness in order to avoid solid contact. Since viscosity and oil volume affect the oil film thickness in the contact area, it is important to know how they change during the test. In this study, a method was proposed to measure viscosity and oil quantity without breaking the vacuum during a sliding test using a small amount of oil in a vacuum. Using this method, changes in viscosity and oil quantity until the end of lubrication life were measured in a sliding test using a small amount of MAC. As a result, an increase in viscosity and a decrease in oil quantity were observed. The measured results discussed the relationship between the increase in viscosity and the frictional work or sliding distance and indicated that the lubrication condition at the end of lubrication life was severely starved.
Most of the mechanical parts used in satellites orbiting the earth are lubricated with a small quantity of liquid lubricants due to the demand for low torque and other factors. Therefore, the tribological performance of space liquid lubricants has been evaluated on a small quantity of those (Jones and Jansen, 2000; Jansen et al., 2001; Masuko et al., 2010). Mechanical elements lubricated with a small quantity of oil often experience oil starvation in the contact areas, especially at high speeds. In order to avoid solid contact and prevent damage to mechanical elements under starved conditions, it is necessary to predict oil film formation in the contact area. Many studies have experimentally and numerically investigated film thickness under starvation conditions.
The film thickness can be much less than the fully flooded value under starved conditions. Wedeven et al. showed a correlation between the inlet distance of oil meniscus and oil film reduction with an experimental approach using optical interferometry (Wedeven et al., 1971). Hamrock and Dowson (H–D) proposed an equation to calculate the oil film reduction rate using the inlet distance of meniscus (Hamrock and Dowson, 1977a). It is necessary to estimate this distance based on the amount of supplied oil and the operating conditions, and many such studies have been conducted both experimentally and numerically. The formula proposed by H–D is effective when the inlet meniscus distance is known, but it is difficult to measure the inlet distance of meniscus for many mechanical elements. Nogi estimated the oil film shape behind the contact zone using the Coyne–Elrod condition, which considers surface tension. Assuming that the oil film shape flows into the inlet side, Nogi calculated the inlet meniscus distance and film thickness numerically and showed that they nearly agreed with H–D’s formula (Nogi, 2015a). The formula for inlet distance by Nogi is difficult to apply to severely starved conditions when the inlet meniscus distance is less than 1. Cann et al. proposed a formula to calculate the oil film reduction rate using a dimensionless number called starvation degree (SD) that makes it possible to evaluate the degree of oil starvation up to the severe starvation condition (E Cann et al., 2004). In recent years, many studies have also been conducted on methods for estimating oil film thickness under starvation conditions using computational fluid dynamics (CFD). It is possible to calculate the oil film distribution in front of the contact area from the lubricant volume near the contact area and then use this to predict the oil film shape in the contact area under starvation conditions (Zhang et al., 2023). The oil film reduction rate estimated using the operating conditions and the calculation of film thickness using CFD are effective if the viscosity and amount of lubrication are known. While mechanical elements operate, the lubricant may degrade or evaporate, and the viscosity and oil quantity may change. These must be measured or predicted based on operating conditions.
Multiply alkylated cyclopentane (MAC) is the most-used liquid lubricant for space machinery parts due to its high thermal and chemical stability, especially its ultra-low vapor pressure. Although the chemical stability of MAC is very high, frictional conditions and contact with metals can cause partial decomposition of MAC to form low-molecular weight products such as hydrogen, methane, and ethane (John et al., 2001; Lu et al., 2007). It has been pointed out that the decomposition reaction may lead to contamination of nearby optical components and the loss of lubrication. Masuko et al. conducted reciprocating ball-on-disk tests in a vacuum and found that MAC polymerizes by oxidative polymerization (Masuko et al., 2010). This polymerization increases the viscosity of the MAC oil and reduces the replenishment of the lubricant to the contact area, resulting in the starved condition and loss of lubricity. Although there has been progress in research into the reduction and deterioration of MAC, it is still unknown how these progresses or the degrees of starvation of lubrication life. It is difficult to research changes in viscosity and decreases in oil amount in MAC lubricity evaluation tests because the amount of oil supplied is small, on the order of several mg, and is difficult to measure.
In mechanical elements lubricated with a small amount of MAC operating in a vacuum, the viscosity of the MAC increases and losses due to evaporation occur, further thinning the lubricant film due to oil starvation. In order to use mechanical elements safely over the long term, it is necessary to quantitatively predict the increase in viscosity of the lubricant and the decrease in the amount of lubricant. The purpose of this study is to quantitatively evaluate how degradation progresses when a small amount of MAC is rubbed in a vacuum. A method is proposed to measure the viscosity and oil volume of a small amount of lubricant during a ball-on-disk sliding test in a vacuum without breaking the vacuum. Using the proposed method, the viscosity and oil volume of MAC are measured during pure sliding tests using a small amount of MAC, and the transitions up to the end of its life are obtained. From measuring results, viscosity increases during sliding tests and lubrication state at the end of its lubrication life are discussed.
The sliding tests were carried out in a vacuum chamber with a base pressure of 10−4 Pa level. The schematic illustration of test rig is shown in Figure 1. This testing machine is characterized by the ability to install two disk test pieces above and below a steel ball. In this study, the upper disk is a glass disk, and the lower disk is a steel disk. Sliding tests are conducted between the steel ball and the steel disk. Sliding is induced by the steel ball rotation. The rotating shaft on which the steel ball is attached is connected to a stepping motor outside the chamber via a magnetic fluid seal. The rotating shaft is supported by a single-axis gimbal, and the rotation of the rotating shaft around the center of the gimbal is allowed by the deformation of the bellow. Using a weight, this testing machine can apply a load in the vertical direction to the point where the distance from the gimbal’s center of rotation is the same as from the steel ball. The steel ball can contact either the upper or lower disk by switching the direction of the load. When a steel disk and a glass disk are placed below and above the steel ball, respectively, sliding tests can be conducted between the lower steel disk and the steel ball, and the visualization test can be performed by interrupting the sliding test and bringing the upper glass disk and the steel ball in contact.
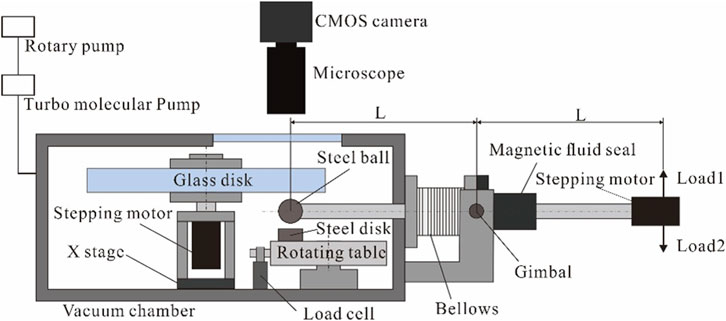
Figure 1. Schematic illustration of the test rig.
Sliding in the sliding test and visualization tests is induced by rotating steel ball, and the frictional force during the sliding test is measured with the load cell. By placing the disks symmetrically above and below the steel ball, sliding and visualization tests can be performed on the same track of the steel ball. In this study, the distance of the steel balls from the upper and lower disks is set to 1 mm, and the rotation angle of the shaft required to bring the balls into contact with each disk is less than 1 deg. One optical image from a visualization test is shown in Figure 2.
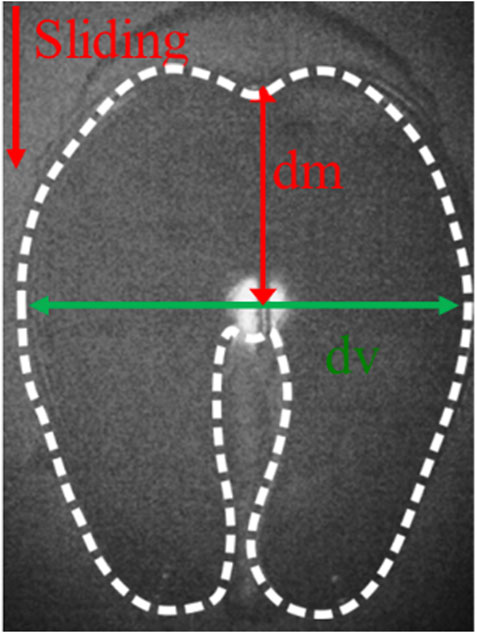
Figure 2. Optical image in a visualization test.
Physical properties of test specimens and test conditions used in the tests are as follows. The material of the steel ball and the steel disk for the sliding test is SUS440C (Young’s modulus 200 GPa, Poisson’s ratio 0.3). The glass disk for the visualization test is made of BK7 optical glass (Young’s modulus 80 GPa, Poisson’s ratio 0.21). The sliding test was performed with a load of 10 N and rotating speed of 10–100 rpm (5.2 mm/s to 52 mm/s). The load and rotational speed are adjusted to those of the sensor bearings, which operate at relatively low rotational speeds among the mechanical components used in satellites.
The visualization test was performed with a load of 1 N to reduce wear during measurement, and the rotating speed was 1–100 rpm (0.52–52 mm/s). The lubricant’s MAC (0.2 cst@25°C) was applied to the steel ball before the test began, and the tests were then performed without supplying any more lubricant. After applying MAC to the steel ball, it was rotated at 100, 200, 500, 1,000, and 2,000 rpm for 5 min and then at 3,000 rpm for 10 s to spread it evenly over the ball. The rotation speed and time were selected empirically so that the average initial oil film thickness was several tens of micrometers, similar to that in the test by Masuko et al. (2010). In this study, when the friction coefficient measured during the sliding test exceeded 0.3, it was considered to be at the end of its lubrication life, and the test was stopped.
In this study, viscosity is calculated with the dimensionless inlet distance equation proposed by Nogi (2015a), as shown in Equation 1:
Where, m is a dimensionless number obtained by dividing the inlet distance dm (shown in Figure 2) by the Hertz radius of the contact area. Hi is the amount of oil in the meniscus divided by the area of the meniscus on the glass disk, and the average oil film thickness hi is made dimensionless using the steel ball diameter and Hertz radius. If the meniscus shape can be measured, hi can be calculated from the geometric shape between the steel ball and the disk and calculated by Equation 2 using the diameter dv (shown in Figure 2) at the cross section perpendicular to the sliding direction.
Hcff is calculated by making hcff (central film thickness in fully flood condition) dimensionless using the steel ball diameter and Hertz radius. In this study, the Johnson dimensionless number was used to determine the region, and hcff was calculated using the Hamrock–Dowson formula for the piezo-viscous elastic region (Equation 3) (Hamrock and Dowson, 1977b; Johnson, 1970).
C is the capillary number and is expressed by Equation 4.
By calculating the average oil film thickness hi from dv and Equation 2, the relationship between viscosity and dimensionless inlet distance can be obtained from Equations 1, 3. As examples, the variation in viscosity with a dimensionless inlet distance at sliding velocity and hi = 0.005 mm and 0.03 mm are shown in Figure 3. Figure 3 shows that the inlet meniscus distance decreases with increasing viscosity for the following reasons. The increased viscosity causes insufficient re-flow behind the contact outlet, causing the sideband to move outward. As a result, the amount of oil flowing from the sideband into the contact area near the inlet of the contact area is reduced, and the inlet distance becomes shorter (Nogi, 2015b). Using hi measured during the test, the relationship diagram between the inlet distance and viscosity is created as shown in Figure 3, and the viscosity is estimated from the measured dimensionless inlet distance. When measuring the viscosity in the visualization test, a velocity was selected such that the dimensionless inlet distance was in the range of 1.5–3. In this study, it is assumed that the surface tension does not change even when the viscosity of the lubricant changes.
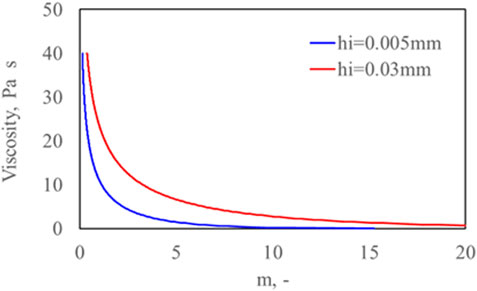
Figure 3. Variation of viscosity and inlet distance for hi = 0.005 and 0.03 mm as the viscosity of the lubricant changes.
Figure 4 shows the changes in friction coefficient over time obtained in sliding with a load of 10 N for the rotation speeds of 10 and 100 rpm. Regardless of the rotational speed, the coefficient of friction increased at the start of the test, then decreased and stabilized at a constant value, and then increased rapidly again, reaching the lubrication life. There was no significant difference in the friction coefficient during the test at either rotating speed, and it is inferred that the sliding test was carried out in the boundary lubrication region. The time to reach the end of its life was shorter at 100 rpm.
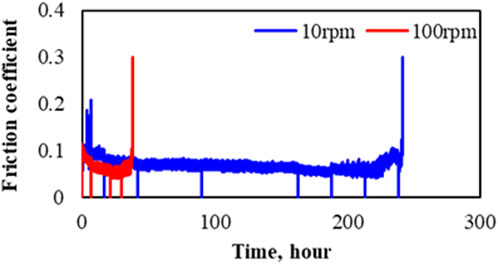
Figure 4. Changes in the friction coefficient with time in the sliding test.
The sliding test was stopped mid-test, and a visualization test was performed. When the friction test was stopped, the friction coefficient shown in Figure 4 was 0. In addition, when the friction coefficient exceeded 0.3 and the lubrication life was reached, the visualization test was performed after the sliding test was finished. Figure 5 shows optical images taken at test times of 42, 90, 163, and 242 h during a sliding test at a rotating speed of 10 rpm. In the 47-h and 90-h cases, a closed shape (shape 1) is observed, which ensures that the truck is fully replenished, and in the 163-h case, a butterfly shape (shape 2) is observed, which is seen in situations of oil shortage. These shapes have also been observed in air and are known to change from shape 1 to shape 2 with increasing velocity, viscosity, and decreasing oil amount (Van Emden et al., 2016). The meniscus size and inlet distance gradually decrease as the test progresses. Using the dm and dv values measured from each visualization test performed during the sliding tests, the viscosity and average film thickness were calculated using the procedure described in Section 3.2 and are shown in Figures 6A, B. It can be seen that the viscosity gradually increases, and the average film thickness gradually decreases, regardless of the rotating speed. The viscosity at the end of its life increased significantly at 10 rpm over that at 100 rpm. Compared to the initial viscosity, it increased by a factor of 90 at 10 rpm and 10 times at 100 rpm. The rate of change in viscosity over time is faster at 100 rpm. The rate of change of viscosity over time appears to be faster at 100 rpm. The average film thickness at the end of its lubricating life is similar at both speeds; the rate of decrease was faster at 100 rpm, and was roughly constant throughout the test.

Figure 5. Optical images in the visualization test in the sliding test of 10 rpm shown in Figure 4.
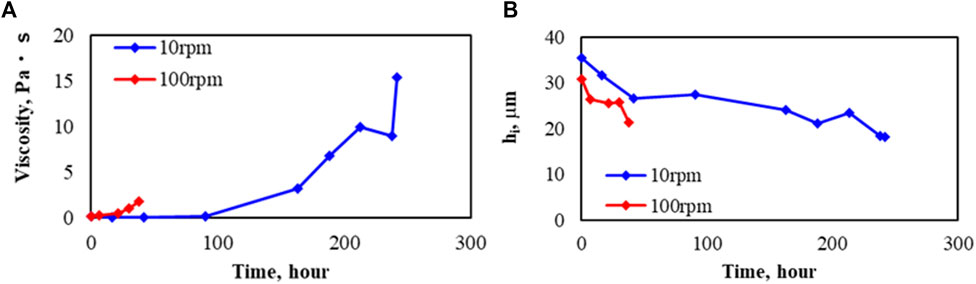
Figure 6. Changes in viscosity and average film thickness in the sliding test of 10 rpm and 100 rpm shown in Figure 4. (A) Viscosity. (B) Average film thickness (hi).
Figure 7 shows the changes in the friction coefficient, viscosity, and average film thickness shown in Figures 4, 6 for the sliding distance. It can be seen that the sliding distance until the end of the lubrication life is longer at 100 rpm. The rate of change in viscosity and oil volume relative to the sliding distance is smaller at 100 rpm.
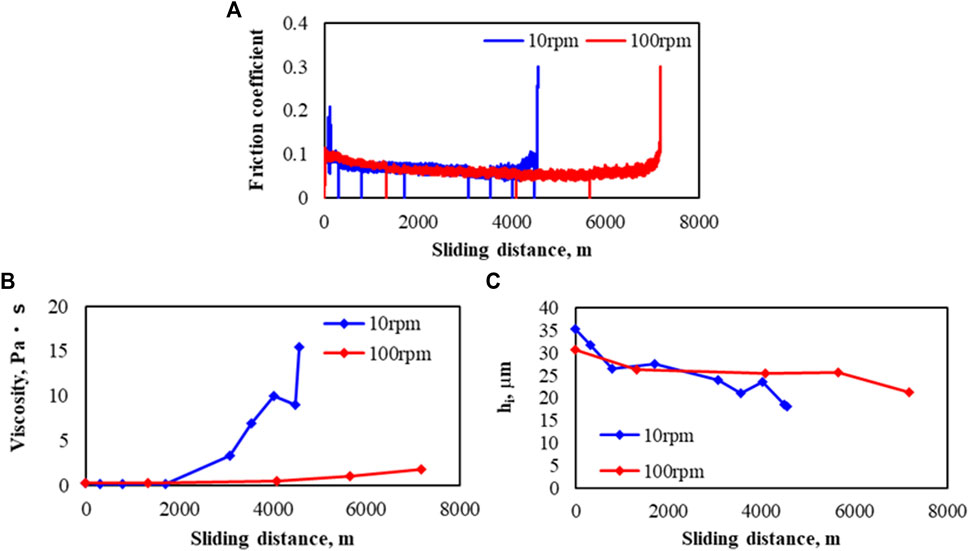
Figure 7. Changes in (A) friction coefficient, (B) viscosity, and (C) average film thickness (hi) with sliding distance in the sliding test of 10 and 100 rpm shown in Figures 4, 6.
The product of the friction force and the sliding distance is called friction work and is used as an index of the energy generated by the friction at the contact area. The friction work up to the end of its life was approximately 3,100 J and 4,600 J in the 10 rpm and 100 rpm tests, respectively. Since the friction force during the test does not differ significantly between the test results at 10 rpm and 100 rpm, the friction work is greater at 100 rpm, which has a longer sliding distance until the end of its life. At 100 rpm, where frictional work is greater, the increase in viscosity is smaller, and no correlation is observed between the increase in viscosity and frictional work. Lu et al. investigated the evolution of low molecular weight gases during vacuum sliding tests of MAC and reported that the rate of gas evolution was determined by the amount of nascent surface rather than the magnitude of friction work (Lu et al., 2007). In a study by Masuko et al., polymerization by oxidation did not occur during sliding tests in air, and it was considered that polymerization requires the generation of nascent surface (Masuko et al., 2010). Lu et al. reported that the gas generation rate is proportional to the sliding velocity. The time integration of the gas generation rate and the sliding velocity results in the amount of gas generated and the sliding distance, so the amount of gas generated is proportional to the sliding distance (Lu et al., 2010). Considering the reports by Lu et al. and Masko et al. together, it is thought that the polymerization of MAC and the associated increase in viscosity require the generation of new surfaces and that the total amount of reaction is proportional to the sliding distance. However, the results of this test show that the viscosity increase was smaller in the 100-rpm test, which has a longer sliding distance, and the viscosity increase cannot be explained solely by chemical reactions at the contact surface. Observation of the test specimens after the test revealed that a large amount of wear debris and powder had been mixed into the MAC. It is known that mixing solid powder into a liquid increases the viscosity. It has been revealed that when grease lubrication is used, in the low speed range, the concentration of the thickener increases near the inlet of the contact area, resulting in increased viscosity and oil film thickness. If something similar to this occurs in this test as a result of an increase in the concentration of wear debris mixed into the lubricating oil, this may explain why the viscosity is higher at 10 rpm than at 100 rpm.
The meniscus observed in the visualization test after the life evaluation test was split into left and right at a rotation speed of 10 rpm, as shown in Figure 5D, and was similar in the life test at 100 rpm. Under these conditions, lubricant flow from the sideband to the contact area does not occur, and it is assumed that the lubricant film ruptures due to insufficient lubricant supply to the contact area, resulting in increased friction. A parameter that indicates the degree of oil starvation is the inlet distance that is used to measure viscosity, but, as there is no meniscus in front of the contact zone, the inlet distance cannot be defined in the present results. Therefore, the starvation degree (SD) proposed by E Cann et al. (2004) is used as an indicator of the degree of oil shortage to organize the state of oil shortage during the sliding test; SD is expressed by Equation 5:
where h∞ is the average oil film thickness, and in this study, SD is calculated as h∞ = hi. As the viscosity in this study was calculated on the assumption that the surface tension of the lubricant had not changed due to degradation, the same assumption was made here, and the value of the lubricant before the test was used. The variation in the SD calculated using the measured viscosity and average film thickness with respect to the sliding distance is shown in Figure 8. The results for both rotational speeds show that SD increases monotonically with sliding distance and reaches its life at approximately 6. In addition to the results shown in Figure 8, life tests were conducted twice at 10 rpm and once at 100 rpm, and the SD at the end of life was approximately 6 in these tests. In a small amount of oil lubrication, it is difficult to define the lubrication life because the sliding distance at the end of the life varies depending on the speed. Although it is necessary to confirm this by conducting tests under different test conditions, the SD is expected to be a dimensionless parameter that can be used to determine lubrication life.
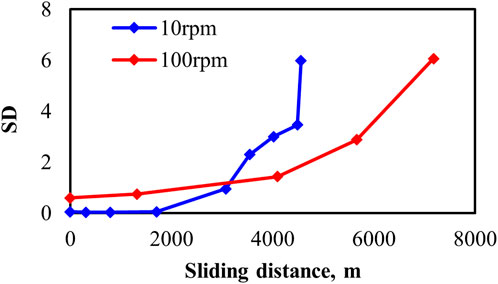
Figure 8. Changes in SD with sliding distance in sliding test of 10 rpm and 100 rpm.
In this study, a method was proposed to calculate the viscosity and oil volume during sliding tests with a small amount of MAC by measuring the meniscus shape. Using this method, the changes in viscosity and oil content of MAC during friction tests in vacuum were measured over the life of the lubricant without breaking the vacuum. Under the test conditions in this study, regardless of the rotating speed, the friction coefficient increased at the beginning of the test, remained at a constant value, and then increased rapidly just before the life of the lubricant, reaching the lubrication life. The magnitude of the friction coefficient was similar, regardless of the rotating speed, indicating that the tests were conducted with boundary lubrication. From the results of sliding tests, the viscosity increases during the MAC sliding test and the lubrication state at the end of its lubrication life were discussed, and the following conclusions were obtained:
• Viscosity gradually increases, and the average film thickness gradually decreases regardless of the rotation speed. Viscosity at the end of its life increases significantly at 10 rpm over that at 100 rpm, and compared to the initial viscosity, it increases by a factor of 90 at 10 rpm and 10 at 100 rpm.
• Past research predicted that the increase in MAC viscosity that occurs during a sliding test would increase as the sliding speed and the sliding distance increase, extending the life of the oil. However, in this study, the viscosity increase was greater for a lower sliding speed and shorter sliding distance until the end of its life. This result indicates that the increase in MAC viscosity is not caused solely by chemical reactions on the nascent surface, and it is necessary to investigate whether the viscosity increase is due to other factors, such as the incorporation of wear particles.
• When MAC reached the end of its lubrication life with a dimensionless inlet distance of less than 1, it entered severe starvation. When the degree of oil starvation was evaluated by SD, regardless of rotating speed, SD increased monotonically throughout the test, and the value was 6 at the end of the lubrication life.
The original contributions presented in the study are included in the article/supplementary material; further inquiries can be directed to the corresponding author.
HS: conceptualization, data curation, investigation, methodology, validation, visualization, and writing–original draft. SO: writing–review and editing and conceptualization.
The author(s) declare that no financial support was received for the research, authorship, and/or publication of this article.
The authors declare that the research was conducted in the absence of any commercial or financial relationships that could be construed as a potential conflict of interest.
The author(s) declare that no generative AI was used in the creation of this manuscript.
All claims expressed in this article are solely those of the authors and do not necessarily represent those of their affiliated organizations, or those of the publisher, the editors and the reviewers. Any product that may be evaluated in this article, or claim that may be made by its manufacturer, is not guaranteed or endorsed by the publisher.
E Cann, P. M., Damiens, B., and Lubrecht, A. A. (2004). The transition between fully flooded and starved regimes in EHL. Tribol. Int. 35, 859–864. doi:10.1016/j.triboint.2004.05.005
Hamrock, B. J., and Dowson, D. (1977a). Isothermal elastohydrodynamic lubrication of point contacts: Part IV—starvation results. ASME J. Lubr. Technol. 99 (1), 15–23. doi:10.1115/1.3452973
Hamrock, B. J., and Dowson, D. (1977b). Isothermal elastohydrodynamic lubrication of point contacts: Part III—fully flooded results. ASME J. Lubr. Technol. 99 (2), 264–275. doi:10.1115/1.3453074
Jansen, M. J., Jones, W. R., Predmore, R. E., and Loewenthal, S. L. (2001). Relative Lifetimes of Several Space Liquid Lubricants Using a Vacuum Spiral Orbit Tribometer (SOT). NASA TM-2001-210966
John, P. J., Cutler, J. N., and Sanders, J. H. (2001). Tribological behavior of a multialkylated cyclopentane oil under ultrahigh vacuum conditions. Tribol. Lett. 9, 167–173. doi:10.1023/a:1018808921623
Johnson, K. L. (1970). Regimes of elastohydrodynamic lubrication. J. Mech. Eng. Sci. 12-1, 9–16. doi:10.1243/jmes_jour_1970_012_004_02
Jones, W. R., and Jansen, M. J. (2000). Space Tribology. NASA TM-2000-209924, 1189–1216. doi:10.1201/9780849377877-42
Lu, R., Minami, I., Nanao, H., and Mori, S. (2007). Investigation of decomposition of hydrocarbon oil on the nascent surface of steel. Tribol Lett 27, 25–30. doi:10.1007/s11249-007-9203-3
Lu, R., Nanao, H., Kobayashi, K., Kubo, T., and Mori, S. (2010). Effect of lubricant Additives on Tribochemical decomposition of hydrocarbon oil on nascent steel surfaces. J. Jpn. Petroleum Inst. 53 (1), 55–60. doi:10.1627/jpi.53.55
Masuko, M., Kishi, K., Suzuki, A., and Obara, S. (2010). The lifetime of boundary lubrication performance of small-quantity-applied liquid lubricants for space mechanisms Evaluated with a vacuum reciprocating tribometer. STLE Tribol. Trans. 53, 75–83. doi:10.1080/10402000903226374
Nogi, T. (2015a). Film thickness and rolling resistance in starved elastohydrodynamic lubrication of point contacts with reflow. ASME J. Tribol. 137, 041502. doi:10.1115/1.4030203
Nogi, T. (2015b). An analysis of starved EHL point contacts with reflow. Tribol. Online 10 (1), 64–75. doi:10.2474/trol.10.64
Van Emden, E., Venner, C. H., and Morales-Espejel, G. E. (2016). Aspects of flow and cavitation around an EHL contact. Tribol. Int. 95, 435–448. doi:10.1016/j.triboint.2015.11.042
Wedeven, L. D., Evans, D., and Cameron, A. (1971). Optical analysis of ball bearing starvation. ASME J. Lubr. Technol. 93 (3), 349–361. doi:10.1115/1.3451591
Keywords: oil degradation, starved EHL, viscosity measurement, lubrication life, vacuum, visualization test
Citation: Shiomi H and Obara S (2025) An in situ experimental method for monitoring the viscosity change and oil amount during the sliding test. Front. Mech. Eng. 11:1522524. doi: 10.3389/fmech.2025.1522524
Received: 04 November 2024; Accepted: 15 January 2025;
Published: 07 March 2025.
Edited by:
Sorin-Cristian Vladescu, King’s College London, United KingdomReviewed by:
Qilong Cheng, Purdue University, United StatesCopyright © 2025 Shiomi and Obara. This is an open-access article distributed under the terms of the Creative Commons Attribution License (CC BY). The use, distribution or reproduction in other forums is permitted, provided the original author(s) and the copyright owner(s) are credited and that the original publication in this journal is cited, in accordance with accepted academic practice. No use, distribution or reproduction is permitted which does not comply with these terms.
*Correspondence: Hiroshi Shiomi, c2hpb21pLmhpcm9zaGlAamF4YS5qcA==
Disclaimer: All claims expressed in this article are solely those of the authors and do not necessarily represent those of their affiliated organizations, or those of the publisher, the editors and the reviewers. Any product that may be evaluated in this article or claim that may be made by its manufacturer is not guaranteed or endorsed by the publisher.
Research integrity at Frontiers
Learn more about the work of our research integrity team to safeguard the quality of each article we publish.