- School of Civil Engineering, Suzhou University of Science and Technology, Suzhou, Jiangsu, China
Based on an orthogonal experimental design, this study introduces rubber powder particle size alongside rubber powder content, aggregate gradation, and cement content as factors. A total of 16 mix proportions were formulated. For each mixture, compaction tests and unconfined compressive strength (UCS) tests were conducted. Using Statistical Product and Service Solutions (SPSS) software, a multifactor variance analysis was performed to determine the influence levels of the four factors on maximum dry density and compressive strength. The optimal mix proportion was selected based on compressive strength. The results indicate that aggregate gradation and rubber powder content significantly affect the maximum dry density of the mixture, with aggregate gradation having the greatest impact. Rubber powder content has the most substantial effect on compressive strength, while rubber particle size has the least influence. The optimal formulation is 7% cement content, 30-mesh rubber powder, 0.5% rubber powder content, and a skeletal dense gradation close to the median.
1 Introduction
With the rapid development of the national economy, China has made remarkable achievements in infrastructure construction. In road construction, most highways in China utilize semi-rigid base courses, among which cement-stabilized crushed stone is widely employed due to its high strength, abundant material sources, and low cost (Ji et al., 2016; Chen et al., 2022). Research shows that cement-stabilized crushed stone materials are used in 90% of pavement base courses (Zheng et al., 2019; Sun and Li, 2018).
Cement-stabilized crushed stone is a cement-based composite material composed of aggregates of various particle sizes, 3%–8% cement, and the optimum water content. The cement’s hydration, hardening, and polymerization processes provide cement-stabilized crushed stone mixtures with sufficient strength. Researchers have identified the interfacial transition zone (ITZ) between the cement paste and aggregate as the most critical interface in cement-based materials, which also represents the weakest link (Lyu et al., 2019). The significant size disparity between cement and aggregate particles causes the aggregates to form distinct “walls,” disrupting the packing of cement particles and resulting in a “wall effect.” This phenomenon introduces an increased concentration of water molecules and air near the aggregates, significantly raising the porosity (Scrivener et al., 2004), which leads to poor bonding between the cement paste and aggregate, thereby hindering the formation and development of strength. The strength of the mixture is influenced by various factors, such as cement content, aggregate gradation, additives, and curing age. Cement hydration increases the bond strength between aggregates, implying that the mixture’s strength increases with higher cement content (Reddy et al., 2020; Zhou et al., 2019). Additionally, research has indicated a near-linear relationship between cement content and compressive strength (Li and Hu, 2020).As a key component of cement-stabilized crushed stone, the gradation and properties of aggregates significantly affect the strength of the mixture. Coarse aggregates provide structural support, while fine aggregates serve as fillers. The gradation of aggregates directly influences the mechanical properties of the mixture, and a proper balance between coarse and fine aggregates can enhance the density and strength of the cement-stabilized crushed stone base course. In certain cases, additives are incorporated to improve other pavement performance characteristics of the mixture. Waste tires are globally recognized as hazardous industrial solid waste, and the issue of recycling and reusing them urgently needs addressing. Recycling waste tires and using them as aggregates in cement concrete can effectively reduce environmental hazards and decrease the exploitation of natural resources (Wang et al., 2023).Rubber powder is a product of waste tire recycling, with widely available raw materials and a mature production process. Incorporating rubber powder into cement-stabilized crushed stone bases can impart some deformation coordination capability to the mixture, providing a better stiffness transition between the subgrade and asphalt mixture surface. Studies have shown that an appropriate rubber particle content can significantly improve the road performance of cement-stabilized crushed stone (Gong et al., 2021). However, rubber powder is also a polymeric organic material, leading to poor adhesion with cement-based materials. Gaps may form in the ITZ, resulting in a decline in the mechanical properties of the mixture. Existing studies indicate that both the particle size and content of rubber powder negatively affect the strength of cement-based materials. With the same particle size, waste rubber powder increases the rate of compressive strength reduction in mixed aggregate concrete. For the same content, the 80-mesh rubber powder shows the highest rate of compressive strength reduction (Wang et al., 2016). The compressive strength of cement-stabilized crushed stone bases containing rubber particles is inversely related to the rubber particle content (Jiao, 2012). Furthermore, the compressive strength of cement-stabilized natural aggregate mixtures is also related to rubber particle size. Smaller rubber particles result in a lower rate of compressive strength loss (Chen et al., 2013; Wu, 2014).
The compressive strength and stability of cement-stabilized crushed stone bases are critical for ensuring road traffic safety, with the 7-day unconfined compressive strength being a key indicator for evaluating subgrade quality. Therefore, this study, based on existing research, considers the characteristics of rubber powder. By employing orthogonal experimental design, we investigate the effects of rubber powder content, rubber particle size, aggregate gradation, and cement content on the 7-day compressive strength of cement-stabilized crushed stone. The goal is to identify the optimal rubber powder content and particle size to maximize the beneficial properties of rubber powder while minimizing its adverse effects. This study aims to contribute to the recycling of waste tires by providing valuable insights and has significant research implications.
2 Raw materials
2.1 Cement
This experiment used Conch brand ordinary Portland cement P·O42.5. The technical performance indicators of the cement are shown in Table 1.
2.2 Aggregate
The aggregates used in this experiment have four specifications: 15–25 mm, 10–20 mm, 5–15 mm, and 0–5 mm, referred to as materials No. 1, No. 2, No. 3, and No. 4, respectively.
According to the Test Methods of Aggregate for Highway Engineering (JTG E2, 2005), the apparent density, water absorption, crushing value, and needle-flake content of the four aggregate specifications were tested. The results are shown in Table 2.
2.3 Rubber powder
The experiment used rubber powder with four particle sizes: 20 mesh, 30 mesh, 40 mesh, and 50 mesh, produced by Zhongjiao Resource Recycling (Suzhou) Co., Ltd. The performance indicators of the rubber powder are shown in Table 3.
3 Experimental methods
3.1 Design of aggregate gradation composition
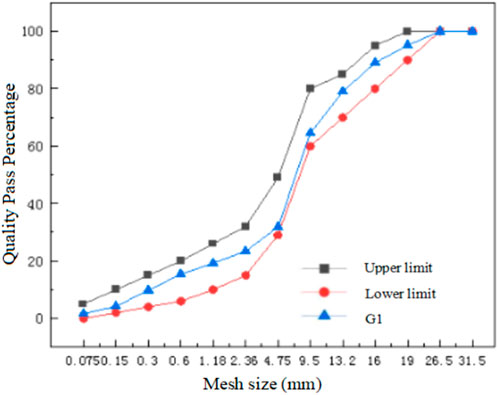
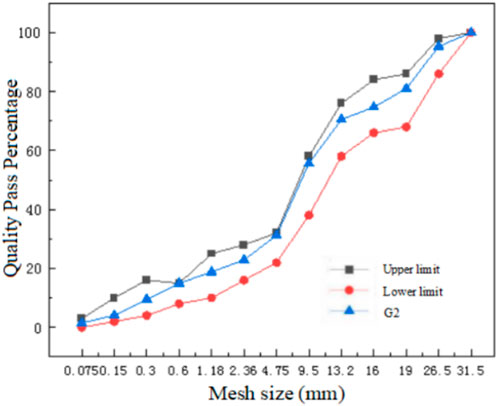
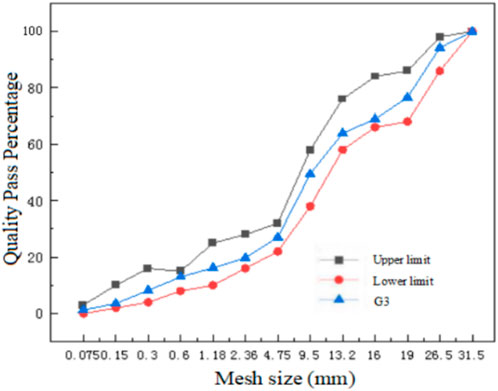
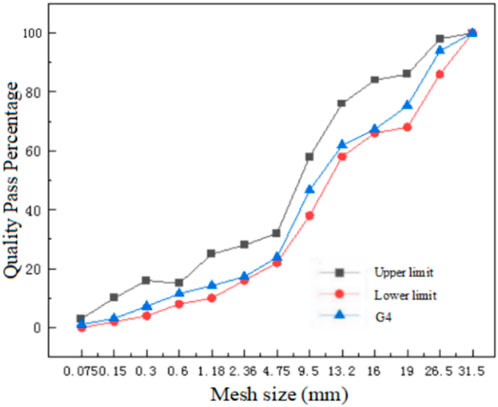
This experiment aims to investigate the influence of gradation on mechanical properties. According to the Technical Guidelines for Construction of Highway Pavement Bases (JTG T-F20, 2015) (2015) and the Specifications for Design of Highway Asphalt Pavement (JTG D50, 2006) (2006), recommended gradation ranges for skeletal dense and suspended dense types are provided for high-grade and first-class highways. Four gradations were designed:
1. Suspended dense type.
2. Skeletal dense type (close to the upper limit).
3. Skeletal dense type (close to the median).
4. Skeletal dense type (close to the lower limit).
These are referred to as G1, G2, G3, and G4, respectively.
3.1.1 Suspended dense type gradation design
Gradation G1 (suspended dense type) uses materials No. 2, No. 3, and No. 4. The composite gradation is shown in Figure 1.
3.1.2 Skeletal dense type gradation design
Gradation G2 (skeletal dense type close to the upper limit) uses materials No. 1, No. 3, and No. 4. The composite gradation is shown in Figure 2.
Gradation G3 (skeletal dense type close to the median) uses materials No. 1, No. 3, and No. 4. The composite gradation is shown in Figure 3.
Gradation G4 (skeletal dense type close to the lower limit) uses materials No. 1, No. 3, and No. 4. The composite gradation is shown in Figure 4.
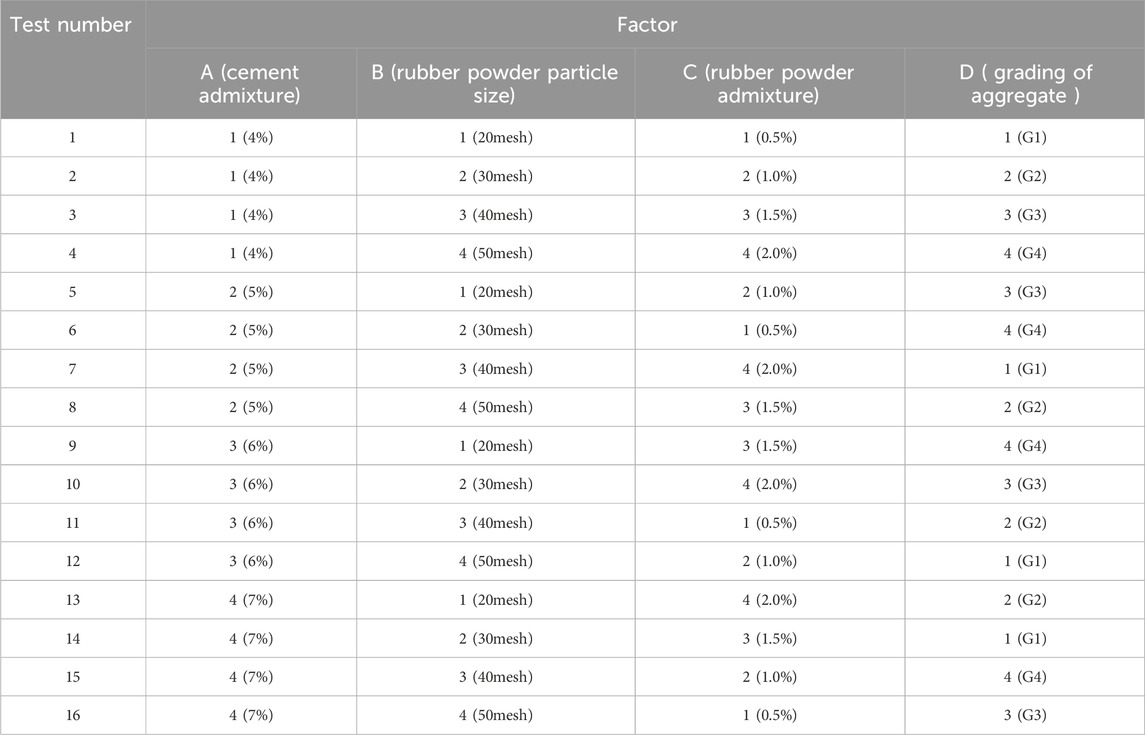
3.2 Orthogonal experimental design
This study uses the orthogonal experimental method to design the experiments. Four influencing factors were determined, each with four levels, so an L16 (4^4) orthogonal array was selected.
Because the rubber powder particle size is small, rubber powder was used to replace an equal mass of material No. 4 (0–5 mm) aggregate. The rubber powder content is determined by the Calculate according to Equation 1:
The proposed factors and levels are shown in Tables 4, 5.
3.3 Compaction test
The Class C compaction method was chosen for this experiment, with the main test parameters shown in Table 6.
Five samples were obtained using the quartering method, each weighing approximately 5.5 kg (oven-dry mass). Five different water contents were selected near the estimated optimal moisture content: 4\%, 4.5\%, 5.0\%, 5.5\%, and 6.0\%. All aggregates were dried to constant weight before use, so the aggregate moisture content need not be considered. Several points should be noted during the test:.
1. After adding water, the sample should be mixed evenly, then placed into a plastic bag for soaking, with a soaking time of not less than 2 h.
2. Considering the losses during the test, water and aggregate should have a 1%–2% compensation.
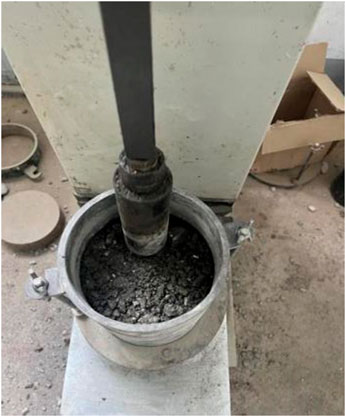
3. After adding cement into the mixture and mixing evenly, compaction should be completed within 1 h. During compaction (Figure 5), material is added in three layers, with the surface of each layer being roughened.
The dry density of each test group is calculated using the following formulas:
First, calculate the wet density of the stabilized material according to Equation 2:
where: ρw—the wet density (g/cm3) of the stable material; Total mass of m1 test cylinder and sample (g); Mass of m2 a test cylinder (g);V1—Volume of the test cylinder (cm3).
Then, calculate the dry density of the stabilized material after each compaction according to Equation 3:
where: ρd—Dry density (g/cm3) of a sample; ω—Water content of one sample (%).
3.4 Unconfined compressive strength test
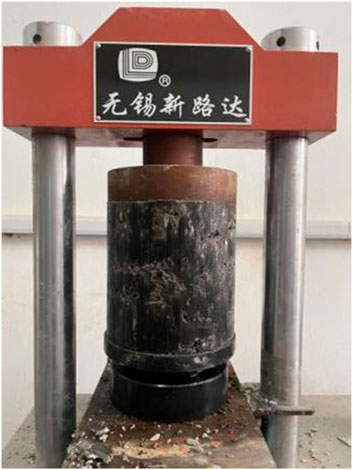
Before the test, cylindrical specimens of size Φ150 mm × 150 mm were prepared and cured in a standard curing chamber for 7 days. On the last day of curing, each group of specimens was soaked in water for 24 h. After soaking, a soft cloth was used to remove surface water, and the mass of each specimen was recorded. The specimen surfaces were checked for flatness to prevent stress concentration during testing. The specimens were placed steadily at the center of the loading plate in the compression testing machine. During loading (Figure 6), a constant loading rate of 1 mm/min was maintained, and the maximum load and stress at specimen failure were recorded.
3.5 Statistical product and service solutions analysis
Using SPSS software, a multifactor variance analysis was performed on the strength results to calculate the significance levels of the four factors affecting strength, further verifying the influence degree of each factor.
3.6 MATLAB software analysis
MATLAB software was used to plot a three-dimensional fitting diagram of cement content, rubber powder content, and unconfined compressive strength.
4 Results and discussion
4.1 Compaction test
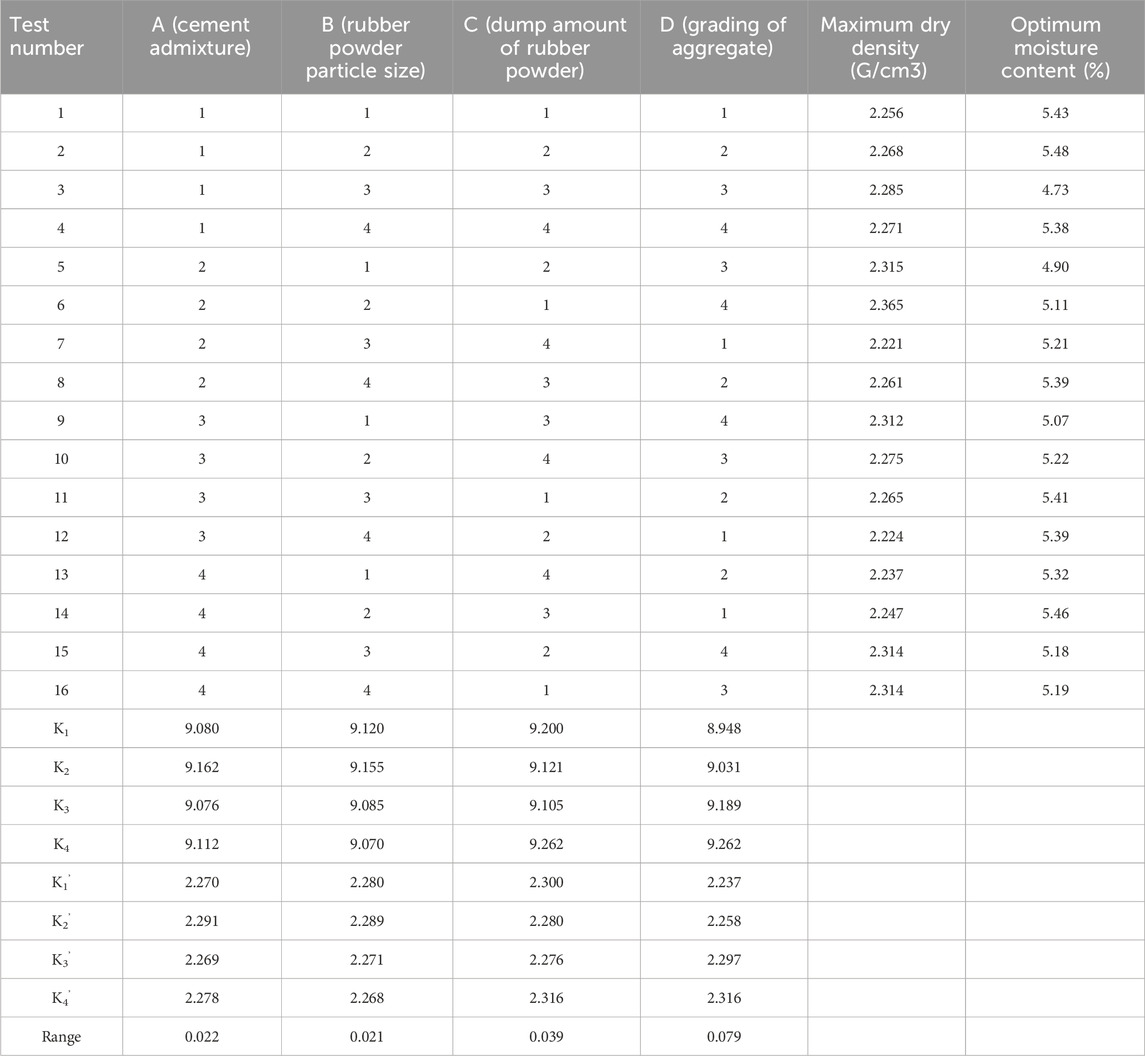
Based on the compaction data, moisture content–dry density relationship curves were plotted for each group. Using the fitting equations, the maximum dry density and optimal moisture content for each group were calculated. The 16 groups of compaction results are organized in Table 7.
In Table 7, the four numbers in the K1 (K2, K3, K4) row represent the sums of the maximum dry density corresponding to the first (second, third, fourth) level of factors A,B, C, and D. K1′, K2′, K3′, K4′ are the average values of the four levels, namely, calculated by dividing K1, K2, K3, and K4 by 4, respectively.
From the range analysis results, the influence degree of the four factors on the maximum dry density of the mixture is approximately D > C > A = B. Cement content and rubber powder particle size have similar, minimal impacts on maximum dry density. Aggregate gradation has the most significant influence, followed by rubber powder content.
The main reason is that the maximum dry density is closely related to the densities of the constituent materials. Aggregates account for the largest proportion in the mixture, and different gradations result in varying interlocking structures, affecting the overall density. Additionally, the apparent density of rubber powder is much lower than that of aggregates, so the mixture’s density changes with rubber powder content. Under the same rubber powder content, particle size has a limited influence on mixture density. The density difference between cementitious materials and aggregates is not particularly significant, so the influence degrees of cement content and rubber powder particle size are minimal and similar.
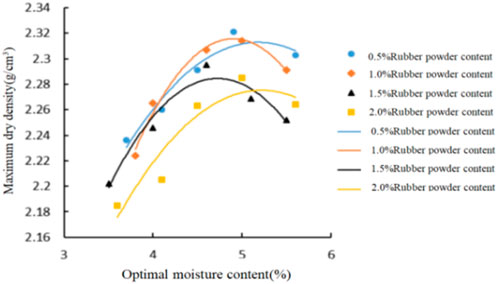
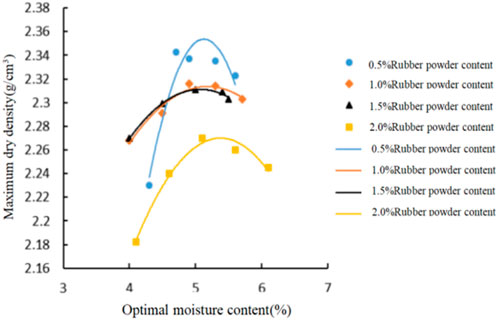
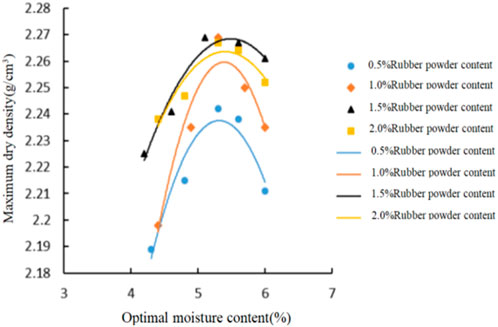
Since cement content and rubber powder particle size have minimal effects on compaction results, and given rubber powder’s high water absorption, the impact of different rubber powder contents on compaction results under the same aggregate gradation was analyzed. The compaction results for gradations G1, G2, G3, and G4 are shown in Figures 7–10.
Comparing the gradation tables of G1 (suspended dense type) and G2 (skeletal dense type close to the upper limit), G2 has more coarse aggregates forming a skeleton structure, while G1 has more fine aggregates. As shown in Figures 7, 8, with increasing rubber powder content, the optimal moisture content of G1 changes little. Rubber powder replaces part of the fine aggregates by equal mass, and its limited content has little effect on moisture content in gradations with more fine aggregates, resulting in minimal changes in optimal moisture content. In contrast, G2’s optimal moisture content is greatly affected by rubber powder content.
Because G1 has fewer coarse aggregates and G2 has more, forming a denser skeleton structure, the maximum dry density in G2 is generally higher than in G1. In both gradations, when rubber powder content reaches 2\%, the maximum dry density decreases significantly compared to 0.5\% content. This may be because rubber powder, being elastic, absorbs some stress generated by aggregate interlock.
Gradations G2 (skeletal dense type close to the upper limit), G3 (close to the median), and G4 (close to the lower limit) are all skeletal dense types, but G3 has a more reasonable aggregate composition, resulting in a higher maximum dry density than G2 and G4.
In G1, G2, and G3, when rubber powder content reaches 2\%, maximum dry density decreases significantly. However, in G4, maximum dry densities at 1.0\%, 1.5\%, and 2.0\% rubber powder contents are higher than at 0.5\%, possibly due to G4’s characteristics of more coarse aggregates and fewer fine aggregates.
4.2 Unconfined compressive strength test
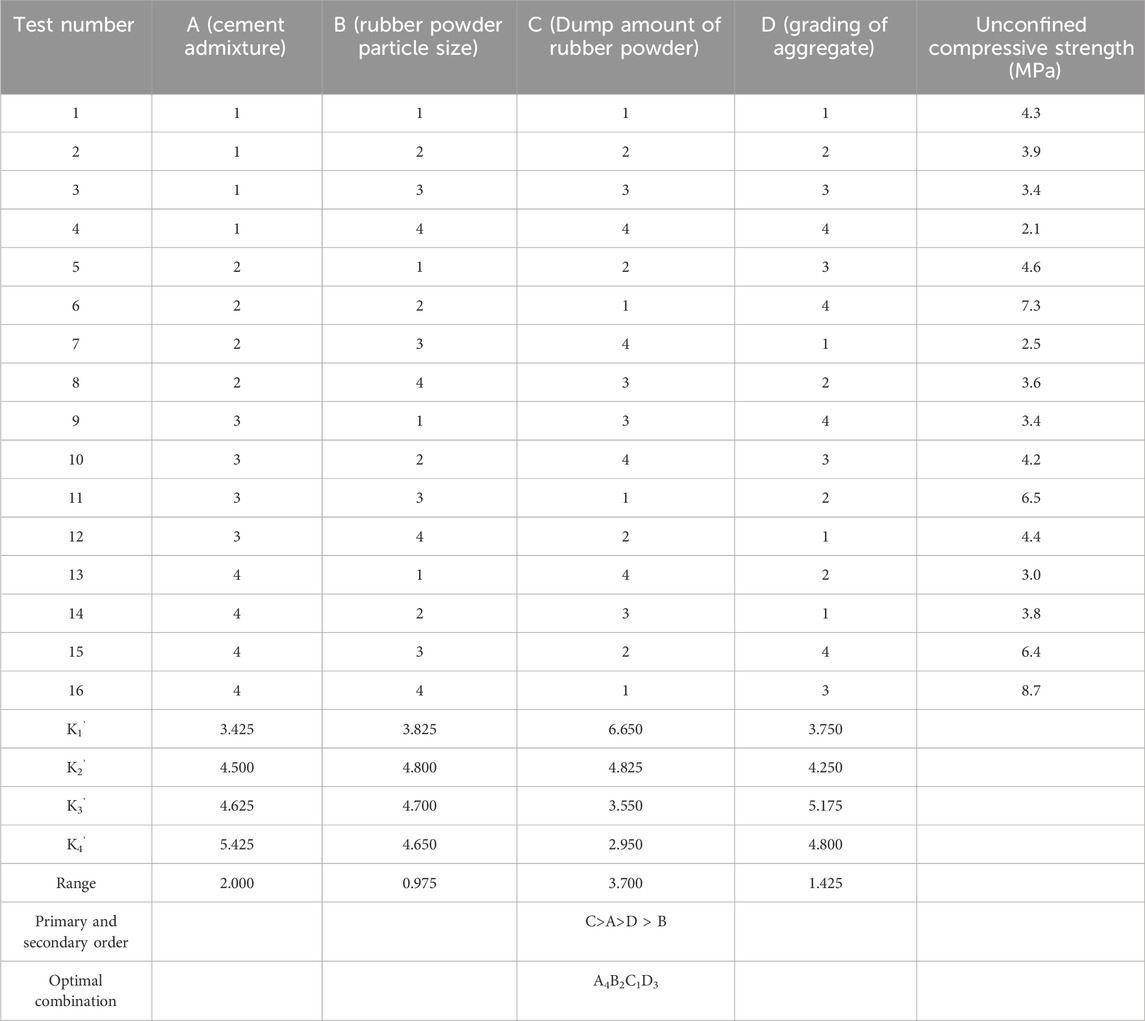
According to the test methods, 16 groups of strength results were obtained (Table 8). To explore the influence degree of the four factors on unconfined compressive strength, K1′, K2′, K3′, and K4′ values were calculated to compute the range.
The calculation results show that the influence order is C > A > D > B, meaning rubber powder content has the greatest influence on strength, followed by cement content and aggregate gradation, while rubber particle size has the least influence.
4.3 Statistical product and Service Solutions analysis
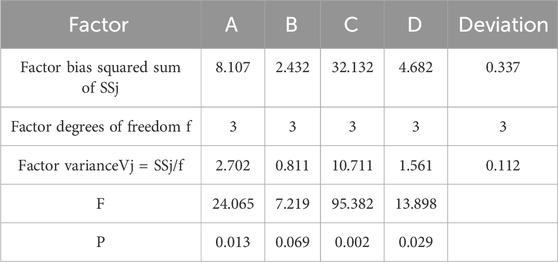
The multifactor variance analysis results indicate that factors A and C are most significant, with (Pc < Pa < Pd < Pb), so the influence degrees are C > A > D > B (Table 9), consistent with the range analysis. For clarity, the variation of 7-day strength with factor changes is plotted (Figure 11).
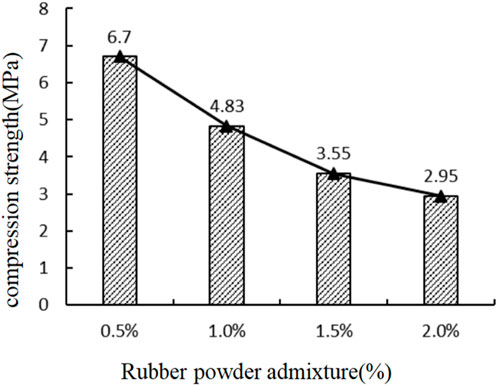
Rubber powder content has the greatest influence on compressive strength. Among the four contents, 0.5\% is optimal. Specimens with 1.0\%, 1.5\%, and 2.0\% rubber powder content showed compressive strength reductions of 27.9\%, 47.0\%, and 56.0\%, respectively, compared to 0.5\%. As content increases, overall strength decreases significantly. At 2.0\% rubber powder content, compressive strength is less than half of that at 0.5\%. This is because rubber powder is an organic polymer, and its unmodified surface has poor adhesion with cementitious materials, leading to decreased mixture strength.
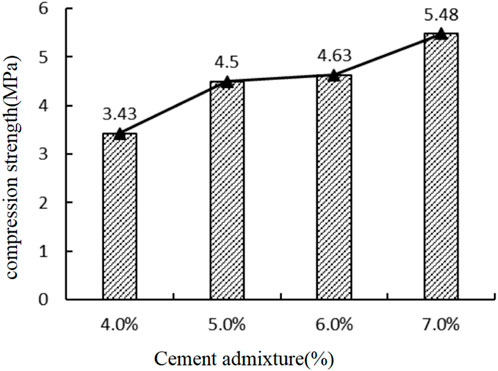
Cement content also significantly impacts strength (Figure 12). Cement provides the binding material; as cement content increases, more binding material is available, and compressive strength rises. At cement contents of 5\% and 7\%, compressive strength increased by 31.2\% and 18.4\%, respectively. From a strength perspective, 7\% cement content is optimal; from an economic standpoint, 5\% can be considered if strength requirements are met.
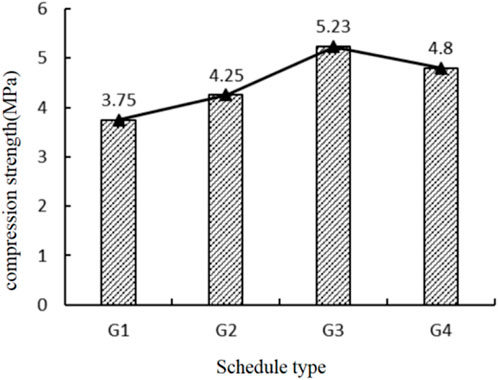
Aggregate gradation also affects compressive strength (Figure 13), though less so than cement and rubber powder content. Gradations G2, G3, and G4 are skeletal dense types with more coarse aggregates forming a skeleton structure, filled by fine aggregates, creating a dense interlocking structure that enhances overall strength. G1 is a suspended dense type with more fine aggregates and fewer coarse aggregates, resulting in lower compressive strength. Among the skeletal dense gradations, G3 showed the highest compressive strength, likely due to its more reasonable aggregate composition. Therefore, G3 (skeletal dense type close to the median) was selected as optimal.
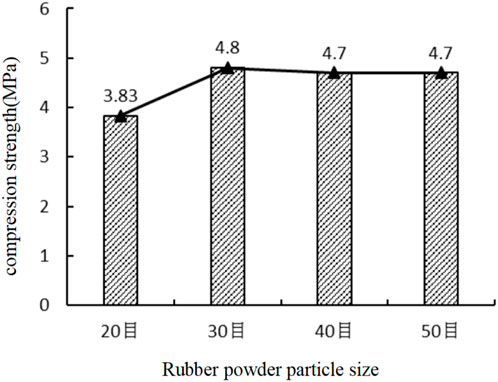
Rubber powder particle size has the least influence on strength (Figure 14). Rubber powders of 30 mesh, 40 mesh, and 50 mesh had similar effects on compressive strength. However, adding 20-mesh rubber powder significantly reduced strength compared to the other sizes, possibly due to poorer bonding with the cement matrix. Therefore, 30–50 mesh rubber powders are preferred in practice.
4.4 MATLAB software analysis
The three-dimensional plot (Figure 15) shows that compressive strength generally increases with cement content and decreases with rubber powder content.
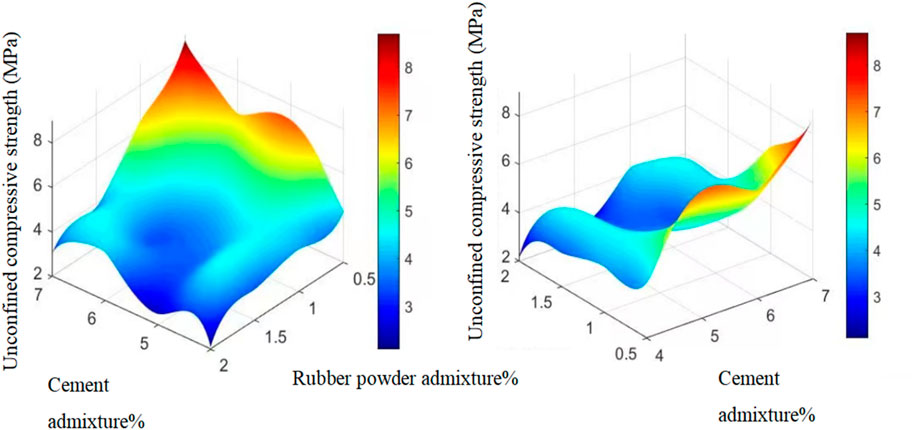
Figure 15. 3 D fit diagram of cement dosage, rubber powder dosage and unconfined compressive strength.
When rubber powder content is less than 1.0\%, its negative impact on compressive strength is minimal. Increasing cement content boosts strength, reaching a peak at 7\% cement content. When rubber powder content exceeds 1.0\%, strength reductions are significant regardless of cement content, and increasing cement content yields variable results, possibly due to influences from aggregate gradation and rubber powder particle size. At fixed cement contents, compressive strength decreases with increasing rubber powder content. With a fixed 7\% cement content, compressive strength reaches its peak regardless of rubber powder content.
5 Conclusion
This study investigated the influence and degree of impact of rubber powder content, rubber powder particle size, aggregate gradation, and cement content on the 7-day compressive strength of cement-stabilized crushed stone. Sixteen mixtures were tested for compressive strength, leading to the following conclusions:
1. The influence degree on maximum dry density is approximately D > C > A = B. Aggregate gradation and rubber powder content significantly affect maximum dry density, with aggregate gradation being the most influential. Cement content and rubber powder particle size have minimal and similar impacts.
2. The influence order on unconfined compressive strength is C > A > D > B, meaning rubber powder content has the greatest impact, followed by cement content and aggregate gradation, while rubber particle size has the least influence. For optimal strength, the best formulation is A4B2C1D3: 7\% cement content, 30-mesh rubber powder, 0.5\% rubber powder content, and gradation G3 (skeletal dense type close to the median).
3. Among the four gradations, G3 has a more reasonable aggregate composition and higher maximum dry density. Rubber powder, being elastic, can reduce the maximum dry density, but patterns may vary with different gradations, requiring specific analysis.
4. The rubber powder used was unmodified. While various surface modification techniques exist with significant improvement effects, they are often costly or complex, unsuitable for large-scale engineering applications. Further research into low-cost, simple treatment methods could enhance rubber powder’s advantages and promote widespread application.
Data availability statement
The original contributions presented in the study are included in the article/supplementary material, further inquiries can be directed to the corresponding author.
Author contributions
FX: Data curation, Writing–original draft, Writing–review and editing. XZ: Writing–review and editing. QG: Supervision, Writing–review and editing.
Funding
The author(s) declare that financial support was received for the research, authorship, and/or publication of this article. This work was supported by Jiangsu Province Graduate Student Practice Innovation Program Project, the number is SJCX22-1587.
Conflict of interest
The authors declare that the research was conducted in the absence of any commercial or financial relationships that could be construed as a potential conflict of interest.
Publisher’s note
All claims expressed in this article are solely those of the authors and do not necessarily represent those of their affiliated organizations, or those of the publisher, the editors and the reviewers. Any product that may be evaluated in this article, or claim that may be made by its manufacturer, is not guaranteed or endorsed by the publisher.
References
Chen, A., Wang, J., and Yang, F. (2013). Experimental study on frost resistance of fiber recycled concrete. J. Concr., vol. 280,no. 2, pp. 39–43. doi:10.3969/j.issn.1002-3550.2013.02.001
Chen, Y., Li, Z., Wang, J., Wang, C., Guan, J., Zhang, L., et al. (2022). Study on road performance of cement-stabilized recycled aggregate base with fiber and rubber. Adv. Civ. Eng. 2022 (1), 4321781. doi:10.1155/2022/4321781
Gong, Y., Chen, P., and Zhang, J. (2021). Technical performance improvement of recycled aggregate mortar by waste rubber particles. J. J. ofSilicate 49 (10), 2305–2312.
Ji, X., Cao, H., and Liu, L. (2016). Study on the performance and influencing factors of cement stabilized recycled aggregate. J. J. Build. Mater. 19 (2), 342–346. doi:10.3969/j.issn1007-9629.2016.02.022
Jiao, J. (2012). Experimental study on recycled aggregate concrete in road engineering. Master’s thesis. Nanjing University of Technology.
Li, Q. F., and Hu, J. (2020). Mechanical and durability properties of cement-stabilized recycled concrete aggregate. Sustainability 12 (18), 7380. doi:10.3390/su12187380
Lyu, K., Garboczi, E. J., She, W., and Miao, C. (2019). The effect of rough vs. Smooth aggregate surfaces on the characteristics of the interfacial transition zone. J. Cem. Concr. Compos. 99, 49–61. doi:10.1016/j.cemconcomp.2019.03.001
Reddy, B., Reddy, G., and Sashidhar, C. (2020). Pavement design of cement treated recycled concrete aggregate bases for low volume roads. J. J. Crit. Rev. 7 (18), 1105–1112.
Scrivener, K. L., Crumbie, A. K., and Laugesen, P. (2004). The interfacial transition zone (itz) between cement paste and aggregate in concrete. J. Interface Sci. 12 (4), 411–421. doi:10.1023/b:ints.0000042339.92990.4c
Sun, Y., and Li, L. H. (2018). Strength assessment and mechanism analysis of cement stabilized reclaimed lime-fly AshMacadam. J.Construction Build. Mater. 166, 118–129. doi:10.1016/j.conbuildmat.2018.01.139
Wang, H. L., Wang, P., Wang, L., and Zhang, K. (2016). Mechanical characteristics effect of waste rubber powder on combined aggregate concrete. J. J. Shandong Univ. Eng. Sci. 46 (6), 89–96. doi:10.6040/j.issn.1672-3961.0.2016.091
Wang, J. Q., Song, G. W., Li, Q., Guo, S. C., and Dai, Q. L. (2023). Rubber-concrete interface modification method and performance enhancement path. J.Chemical Industry Eng. Prog. 42 (S1), 328–343. doi:10.16085/j.issn.1000-6613.2023-0627
Wu, L. (2014). Discussion on gradation design and construction method of cement stabilized macadam drainage base. J. Pavement Eng. 30 (1), 78–82.
Zheng, Y. X., Zhang, P., Cai, Y. C., Jin, Z., and Moshtagh, E. (2019). Cracking resistance and mechanical properties of basalt fibers reinforced cement-stabilized macadam. J. Compos. Part B Eng. 165, 312–334. doi:10.1016/j.compositesb.2018.11.115
Keywords: cement-stabilized crushed stone, rubber powder, gradation, compressive strength, orthogonal experiment
Citation: Xu F, Zhu X and Gao Q (2024) Research on the factors affecting the compressive strength of rubber powder modified cement-stabilized crushed stone based on orthogonal experiments . Front. Mech. Eng. 10:1461374. doi: 10.3389/fmech.2024.1461374
Received: 14 August 2024; Accepted: 16 October 2024;
Published: 25 October 2024.
Edited by:
Anshul Faye, Indian Institute of Technology Bhilai, IndiaReviewed by:
Jahanzaib Israr, University of Engineering and Technology, Lahore, PakistanChitaranjan Pany, Vikram Sarabhai Space Centre, India
Copyright © 2024 Xu, Zhu and Gao. This is an open-access article distributed under the terms of the Creative Commons Attribution License (CC BY). The use, distribution or reproduction in other forums is permitted, provided the original author(s) and the copyright owner(s) are credited and that the original publication in this journal is cited, in accordance with accepted academic practice. No use, distribution or reproduction is permitted which does not comply with these terms.
*Correspondence: Qiju Gao, c2RqdGdAc29odS5jb20=
 Feng Xu
 Xuanxuan Zhu
 Qiju Gao*


