 Kyle Sewak
 Marwan Hassan
 Josef D. Ackerman
- 1Physical Ecology Laboratory, Department of Integrative Biology, University of Guelph, Guelph, ON, Canada
- 2School of Engineering, University of Guelph, Guelph, ON, Canada
Introduction: The capture of suspended particles, which is an important process in many aquatic and terrestrial ecosystems, has been modeled using stationary rigid collectors and, more recently those that move in response to flow-induced vibrations. These models do not, however, account for collector flexibility, despite the fact that many biological collectors, especially aquatic collectors, exhibit flexibility.
Methods: This study examined the effect of collector flexibility (indicated by the Young’s Modulus, E; range = 10–3–102 GPa) on particle capture efficiency (η; flux of captured particles: flux of particles) at different collector Reynolds numbers (Rec where the collector diameter [dc] is the length scale; range = 30–508) in a recirculating flow chamber.
Results: Patterns in η were generally similar for flexible and rigid collectors until moderate Rec (∼374) when higher η were observed on the most flexible collectors. This threshold corresponded to periods of vortex induced motions in which the oscillation frequency of the collector transverse to the flow direction was >4 Hz and the maximum amplitude of the oscillation relative to dc was >60% in the transverse and >100% in the longitudinal direction.
Discussion: Given the range in E examined in this study, it is likely that particle capture on flexible natural collectors has been underestimated using the standard model of a rigid stationary or oscillating collector. The role of collector flexibility should be considered in models and studies of particle capture in natural systems.
1 Introduction
The capture of suspended particles is an important process in many aquatic and terrestrial ecosystem processes including suspension feeding, sexual reproduction and the fate and transport of contaminants (reviews in Niklas, 1985; Shimeta and Jumars, 1991; Ackerman, 2000; Ackerman, 2006; Armitage et al., 2008). For example, aquatic plants capture suspended particles and in doing so retain nutrients in bottom sediments, which affects their production and that of aquatic ecosystems (e.g., Jordan et al., 1986; Leonard et al., 1995). Essentially, the physical process of particle capture includes the encounter, capture and retention of particles suspended within a fluid medium (Vogel, 1994). Five principal mechanisms of particle capture have been characterized (Rubenstein and Koehl, 1977; Spielman, 1977): (1) direct interception in which a particle flowing within a streamline comes into direct contact (i.e., within a particles radius) of the collector and is intercepted; (2) inertial impaction in which denser particles deviate from fluid streamlines moving around the collector, because of their inertia, and thus impact on the collector; (3) diffusional deposition in which Brownian-like motion causes particles of small diameters (<10–6 m) to deviate from streamlines and be intercepted by the collector; (4) gravitational deposition in which particles with excess density settle onto the collector; and (5) electrostatic attraction in which particle and the collector are of opposite electrical charge inducing an attraction that leads to capture by the collector. Typically, larger diameter particles are captured via direct interception and inertial impaction whereas smaller diameter particles are captured through diffusional deposition and electrostatic attraction (Rubenstein and Koehl, 1977).
Axisymmetric cylindrical collectors have been used in particle capture experiments and modeling (Rubenstein and Koehl, 1977; Shimeta and Jumars, 1991; Spielman, 1977; Palmer et al., 2004; Haugen and Kragset, 2010; Gosselin, 2019; Espinosa-Gayosso et al., 2021). The cylindrical shape is analogous to many biological collectors including the siphons and cilia of suspension feeding organisms as well as the stems of aquatic plants (macrophytes; e.g., Shimeta and Jumars, 1991). This shape is also amenable to fluid dynamic characterization using the collector Reynolds number (
where dc is the diameter of the collector, U is the velocity and ν is the kinematic viscosity.
where R is the relative particle diameter (ratio of particle diameter to cylinder diameter; i.e., dp/dc) and s is the specific gravity (ratio of particle density to the density of the fluid; i.e., ρp/ρf). Stk describes the ratio of the particle stopping distance to that of the collector radius. When Stk < 1 particles are integrated into the streamlines (Raju and Meiburg, 1995), whereas when Stk > 1 particles are likely to deviate from the flow, although the magnitude of s may modulate this relationship (Espinosa-Gayosso et al., 2015). Particle capture efficiency (η) is used to determine the effectiveness of the particle capture process and to compare among studies. η is based on the number of particles captured per unit area and time divided by the particle flux that would move through an equivalent rectangular cross-sectional area of the collector in the absence of the collector.
The effects of collector motion on η have been examined using physical modeling and an examination of wind pollination in timothy grass (McCombe and Ackerman, 2018) and numerical modeling of soft coral feeding (Boudina et al., 2021). These studies were motivated by the fact that vortex induced oscillations occur in nature as a result of the shear forces between the fluid and the organisms (de Langre, 2008; de Langre, 2019; Gosselin, 2019) in which vibrations are caused when vortices are shed alternatively downstream, inducing a pressure gradient along the surface of the fluid causing motion of the collector in the transverse direction (e.g., Vandiver and Jong, 1987; Bourguet et al., 2011). McCombe and Ackerman (2018) demonstrated that the effects of oscillatory motion on the η of a rigid collector was substantial (>400 predicted by stationary collectors), varied spatially on the collector, and also varied with Rec. The effect was greatest for collectors moving transversely to the flow direction at large magnitude, which encountered more particles with higher relative momentum with respect to the moving collector. Those results confirmed earlier computational fluid dynamic models (Espinosa- Gayosso et al., 2012; Espinosa- Gayosso et al., 2013; Krick and Ackerman, 2015), as well as the influence of the direction of the motion on η. During transverse oscillations, the momentum of low Stk particles relative to the approaching moving collector is sufficient for the particle to penetrate the boundary layer and be captured by the collector. The effect of collectors moving longitudinally to the flow on η is lower because the increase in relative momentum in the approaching phase of the collector oscillation is lost in the retreating phase of the collector motion (Krick and Ackerman, 2015). Nonetheless, a sixth mechanism of particle capture, entitled collector chasing, was identified for moving collectors in which particle capture occurs when a moving particle is intercepted by a collector in its retreating phase (Krick and Ackerman, 2015).
The influence of flexibility of the motion of the collector and the concomitant effects on η remain unknown empirically despite the large range in mechanical properties of biological materials (Table 1). The purpose of this study is, therefore, to examine the effects of flexibility of the collector on particle capture efficiency, η. We do so by measuring η empirically on polymers of different flexibility indicated by their Young’s moduli in a recirculating flow chamber under differing
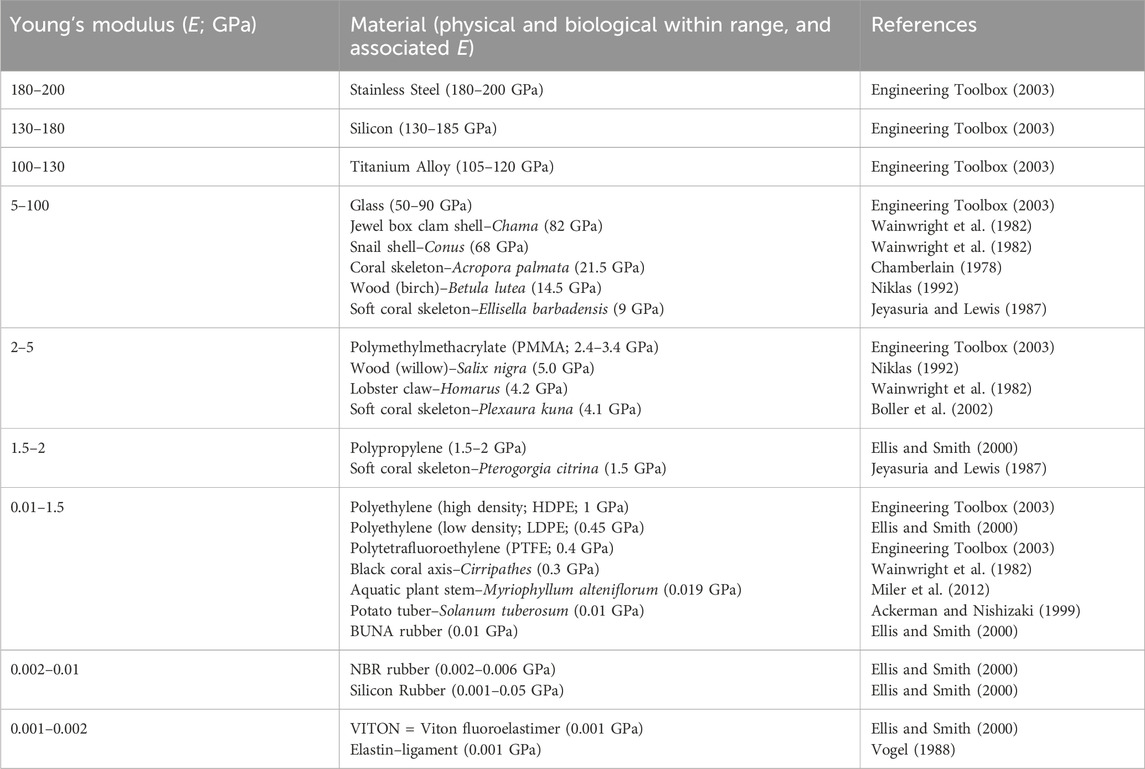
Table 1. Comparison of Young’s modulus (E) of biological collectors and physical materials.
2 Materials and methods
Experiments were conducted in a 14.5-L recirculating flow chamber (test section: 170 cm long × 17 cm wide × 4.5 cm water depth; see vanden Byllaardt and Ackerman, 2014) equipped with three flow straighteners (collimators) placed in the 13-cm long expansion section of the inlet to rectify the flow and one 10 cm upstream of the channel outlet to prevent circulation (Figure 1). The chamber was operated at an average velocity (U) of 2 cm s-1, 10 cm s-1, 20 cm s-1, 25 cm s-1 and 34 cm s-1, which provided turbulent conditions based on flow chamber Reynolds number (Redh) using the hydraulic diameter as the length scale (Table 2). Velocity profiles were taken in the area where the collector was placed (i.e., at x = 143 cm downstream from the last collimator near the inlet) using a 3D side-looking Acoustic Doppler Velocimeter (ADV; Nortek Vectrino+; sampling frequency = 20 Hz, maximum velocity range = 50 cm s-1) to generate velocity profiles at heights of 2.5, 3.5 and 4.0 cm above the bottom, which includes the observation region of the collector used to assess particle capture efficiency. The velocity measurements were generally consistent with theoretical predictions of the 1/7 power law for turbulent flat-plate flow especially at the higher velocities (Supplementary Figure S1). The assessment also indicated that the boundary layer thickness (δ) was greater than the height of the observation region in all cases, and δ > lc (length of the collector) for the three lowest velocities (Figure 1 and Supplementary Figure S1). In other words, the observation region of the collectors was contained within the turbulent boundary layer flow of the chamber.
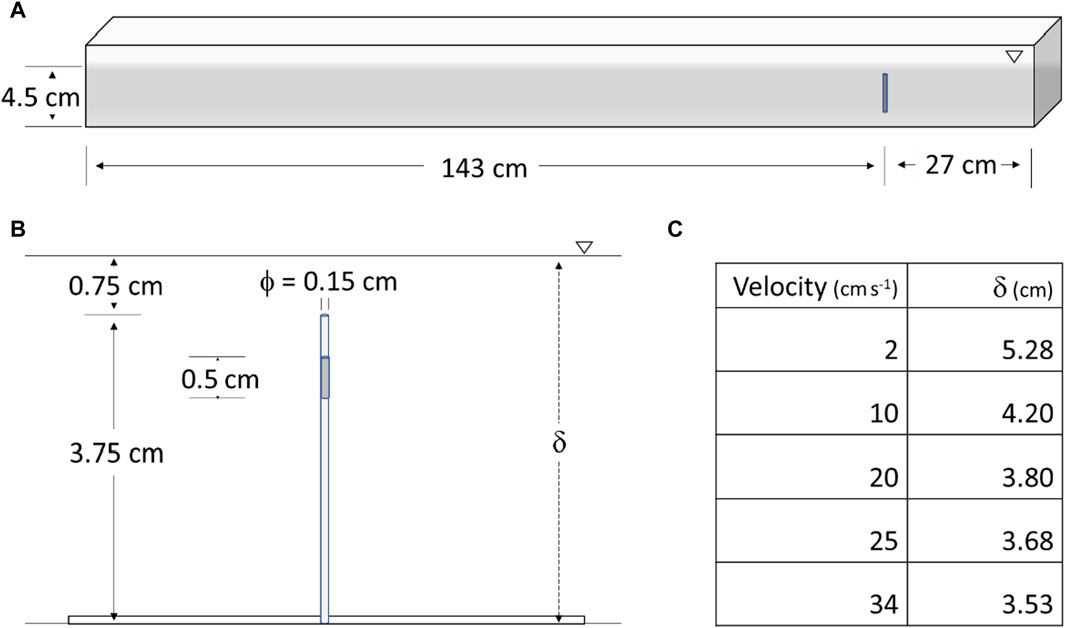
Figure 1. Schematic diagram of the experimental system: (A) side view of the open channel flow chamber with the collector located at x = 143 cm downstream of the last collimator (flow is from left; chamber is 17 cm wide); (B) enlarged image of the collector (length lc = 3.75 cm) with the observation region identified in dark grey (the collector was held on a plexiglass base tacked adhered onto the bottom of the chamber); (C) the relationship between the flow chamber velocity and the thickness of the boundary layer (δ) at x = 143 cm.
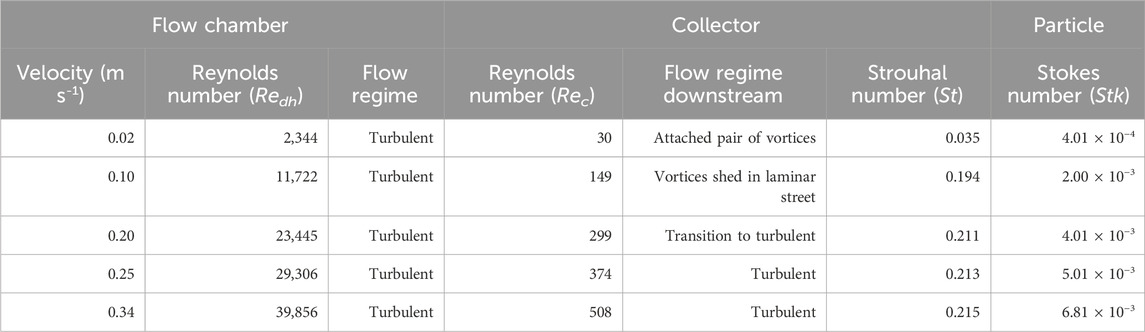
Table 2. Hydrodynamic conditions in the flow chamber, expected around the collector, and for the particles indicated by the chamber Reynolds number (length scale = hydraulic diameter, dh; dh = 0.12 m) and flow regime, the collector Reynolds number (length scale = collector diameter) and flow regimes downstream including the vortex shedding frequency indicated by the predicted Strouhal number, and the particle Stokes number.
Five materials were used to obtain a range of flexibility in the collectors (dc = 1.5 mm diameter and lc = 3.75 cm long) indicated by the Young’s Modulus (E) that spanned the range found in nature (i.e., 10–3 and 102 GPa; Table 1). These included: (1) rigid Stainless Steel encased in a 3M™ black heat-shrink tubing (final dc = 1.5 mm) used as a stationary collector or no-movement control (Young’s modulus, nominal E = 200 GPa and density, ρ = 7.85 × 10³ kg m-3; TW Metals, Hamilton, ON); High Density Polyethylene (HDPE; E = 1.0 GPa and ρ = 0.97 × 10³ kg m-3; eplastics, San Diego, CA); Low Density Polyethylene (LDPE; E = 0.45 GPa and ρ = 0.94 × 10³ kg m-3; eplastics, San Diego, CA); BUNA rubber (BUNA; E = 10–2 GPa and ρ = 1.35 × 10³ kg m-3; BRP Manufacturing, Lima, OH); and Viton fluoroelastimer (VITON; E = 10–3 GPa and ρ = 1.80 × 10³ kg m-3; BRP Manufacturing, Lima, OH). The natural frequency for mode 1 of these collectors in water was 710.3 Hz for stainless steel, 95.2 Hz for HDPE, 67.9 Hz for LDPE, 9.7 Hz for BUNA and 2.8 Hz for VITON based on the closed form solution
where I is the area moment of inertia, q is the total mass per unit length, which includes both the mass of the collector
where ρ is the density (Shukla et al., 2013). Silver-coated, hollow glass spheres (CONDUCT-O-FIL; Potters Industries Inc., Carlstandt, NJ, USA) were used as particles based on their small size (mean diameter ∼13 μm) and density (1.6 g cm-3) and reflective properties that facilitated counting. The experimental parameters given by the relative particle diameter, R (ratio of particle diameter to cylinder diameter; dp/dc = 8.67 × 10⁻³) and the specific gravity, s (ratio of particle density to the density of the fluid, ρf; ρp/ρf = 1.6), were held constant. Conversely, Stk varied from 4.01 × 10⁻⁴ to 6.81 × 10⁻³ as a function of Rec based on the flow chamber velocities (Table 2). This range of Rec represents flow regimes ranging from attached vortices to fully turbulent conditions characterized by flow instabilities, random fluid motion and the presence of a turbulent wake downstream of the collector; this is reflected in the predicted Strouhal number (
Observations of collector motion were made using an iPhone 6 camera (8 megapixels, Apple Inc.) placed on the plexiglass plate supported by the side walls of the flow chamber directly above the collector (240 frames per second). Data from the video recordings, displayed on a computer monitor (30 cm × 45 cm), were digitized manually to characterize collector motion at each Rec. Specifically, these included: (1) the maximum amplitude in the transverse direction relative to dc (%); (2) the maximum deflection in the longitudinal direction relative to dc (%); and (3) the oscillation frequency (f) in the transverse direction (Hz) to determine the observed Strouhal number for the moving collector. Additional 60 s video recordings were made through the side wall of the flow chamber to determine the longitudinal motion of the collector from an orthogonal perspective.
Degassed tap water was carefully added to the recirculating flow chamber before the collector, which was coated with <0.1 mm of silicon grease to retain particles, was placed in the flow chamber at the test location, i.e., at x = 143 cm downstream. A ∼ 15 mL solution of distilled water and 0.5 g of CONDUCT-O-FIL particles was carefully poured into the outlet of the test chamber and time, t = 0 was dictated when the particles reached the collector. Once the experiment concluded (t = 300 s) the model was enclosed in a water-tight plexiglass casing to facilitate removal and photography of its front, back and side portions of the observation region (Figure 1) using a digital camera (Nikon 1 J1; Nikon, Tokyo, Japan) attached to a stereomicroscope (Nikon SMZ-2T). The flow chamber was thoroughly cleaned after each trial to ensure that no residual particles remained in system. A randomized design was used to choose materials and Rec; 5 replicates were obtained.
Images were uploaded into Adobe Photoshop Creative Cloud version 14.0 and overlaid with a transparent counting grid. The number of particles was counted manually, and particles that fell on the dividing lines of the grid were counted in the segment to the right. The particle counts (N) were normalized by the area of the grid (Ac) given by
where H is the height of the grid cell; Ac was used to determine the particle count per unit area (Nc)
The settlement of particles through the 300 s trial was measured directly by determining the particle concentration (via a hemocytometer) in ∼5 mL water samples taken from a depth of ∼1.5 cm at the test location (x = 143 cm downstream) at t = 0, 60, 120, 180, 240 and 300 s for each Rec. Particle settling rates were determined from the slope of the particle concentration vs. time curves at each Rec, which were linear (R2 = 0.91 ± 0.02 [mean ± SE]), ranged between 3 – 4 × 10⁸ particles m-3 s-1 and did not differ among Rec (Analysis of Variance [ANOVA] of particle concentration at t = 300: F4, 10 = 0.55, p = 0.740). Consequently, the measured value of the particle concentration at t = 150 s (C = (1.26 ± 0.08) × 1011 particles m-3; n = 5) was used to determine the particle flux.
Control experiments were conducted to determine whether particle capture varied among collectors, which was necessary because it was not possible to obtain a single material with the range of nominal flexibility used in this research. Experiments were conducted using a 7-cm collector length to facilitate the restriction of its movement using a bulldog clip (1.5 cm wide). The clip was clamped at the top of the collector (above the water surface) and tension was applied (upward) to prevent oscillations from occurring. The data were obtained in the same manner as described above.
2.1 Statistical analysis
Three separate fixed effect Analysis of Covariance (ANCOVA) models were used to examine the effect of collector flexibility (independent variable) on relative amplitude in the transverse direction, the relative deflection in the longitudinal direction, and the oscillation frequency in the transverse direction, respectively (response variable), and using Rec as a covariate. The particle capture data were analyzed using a mixed model ANCOVA to determine the effect of collector flexibility (independent variable) on particle capture efficiency (response variable) using Rec as a covariate. The response variable (particle capture efficiency) was log10 (x2) transformed to meet the assumptions of normality and homogeneity of variance. ANOVA was used to analyze the effect of collector material on particle capture efficiency separately for the control experiments conducted at Rec = 149 and Rec = 508. Tukey’s Honest Significant Difference test was used to examine pairwise differences when significant factors were found. All statistical tests were completed using a probability of error rate, α = 0.05 in SAS (version 9.4).
3 Results
3.1 Collector motion
The flexible collectors moved in response to the flow and this motion generally increased with increasing collector Reynolds number (
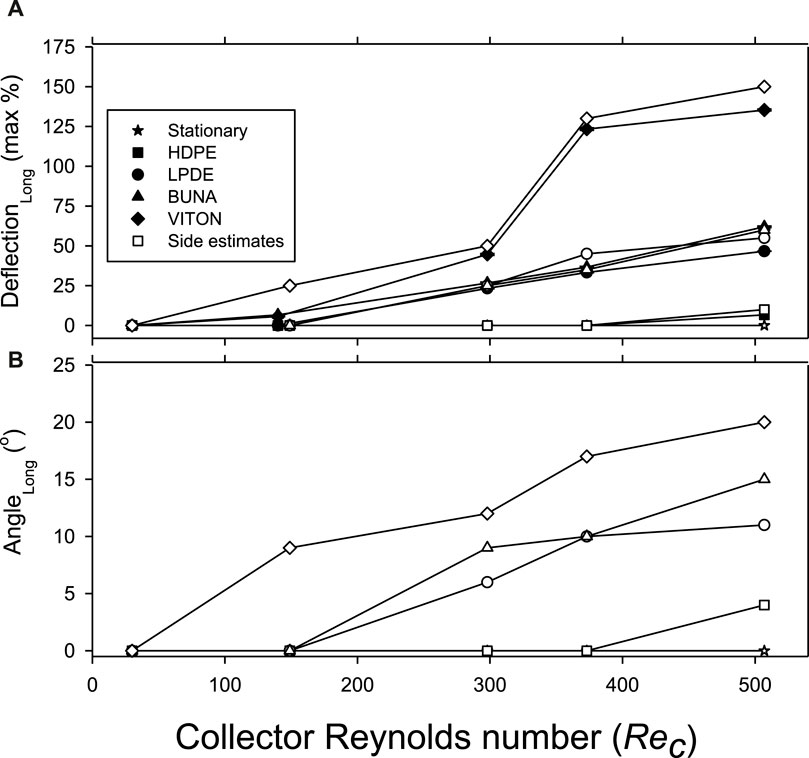
Figure 2. Characteristics of the longitudinal motion of elastic collectors vs. collector Reynolds numbers (Rec): (A) Maximum deflection in the longitudinal direction relative to dc measured from above the collector (solid symbols; mean ± SE, n = 5) and from the side (hollow symbols); and (B) Maximum angle of deflection from the vertical measured from the side. Legend: Stationary collector = stainless steel rod encased in heat-shrink tubing (E = 200 GPa; ρ = 7.85 × 10³ kg m-3); HDPE = High Density Polyethylene (E = 1.0 GPa; ρ = 0.97 × 10³ kg m-3); LDPE = Low Density Polyethylene (E = 0.45 GPa; ρ = 0.94 × 10³ kg m-3); BUNA = BUNA rubber (E = 10–2 GPa; ρ = 1.35 × 10³ kg m-3); and VITON = Viton fluoroelastimer (E = 10–3 GPa; ρ = 1.80 × 10³ kg m-3).
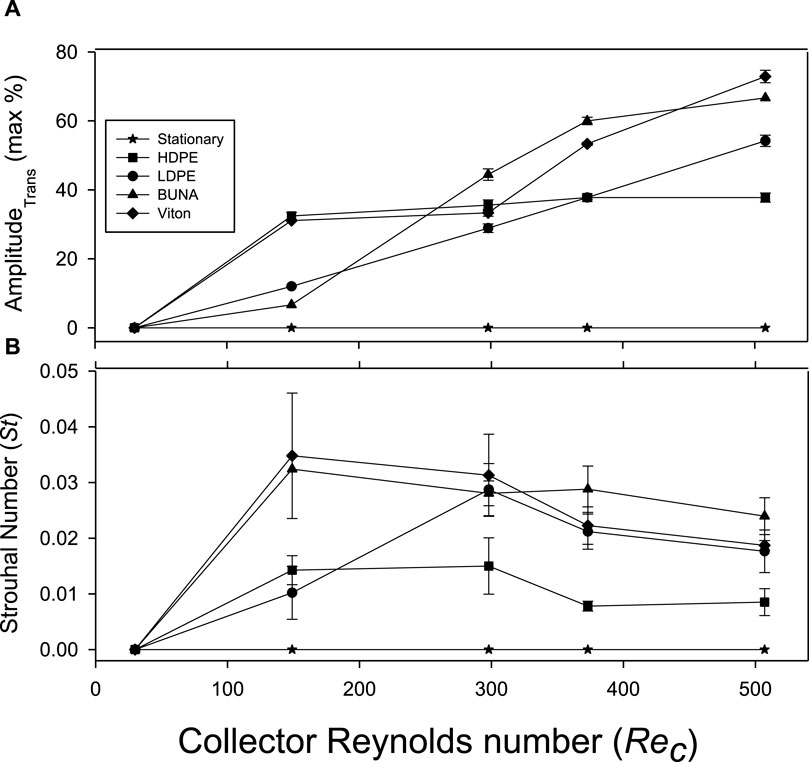
Figure 3. Characteristics of the transverse motion of elastic collectors vs. collector Reynolds numbers (Rec): (A) Maximum amplitude in the transverse direction relative to collector diameter (dc); and (B) observed Strouhal number of the collector oscillation frequency in the transverse direction (mean ± SE, n = 5).
The total deflection of the collector in the longitudinal direction ranged from 0% to >135% relative to the collector diameter (dc) as measured above the collector (Figure 2 and Supplementary Figure S2). The magnitude of the deflection was more pronounced as the flexibility (i.e., lower E) of the collector increased and at higher Rec; i.e., VITON > BUNA > LKPE > HDPE for Rec ≥ 149, and VITON deflected by 135.3% ± 0.6% at Rec = 508 (Figure 2A). The pattern in the magnitude of the deflection measured from the side of the collectors was consistent with this description (compare hollow vs. solid symbols in Figure 2A) as was the angle of the deflection with respect to the vertical (Figure 2B). Statistically significant differences were detected among collectors for flexibility (ANCOVA F4, 19 = 5.19, p = 0.005) and the collector Reynolds number (covariate; F1, 19 = 14.94, p = 0.001). In this case, significant pairwise differences were detected between VITON and HDPE (p = 0.008) and between VITON and the stationary collector (p = 0.007).
The amplitude of the collector deflection in the transverse direction ranged from 0% to >70% relative to dc (Figure 3A). In general, the magnitude of the amplitude of the collectors increased with flexibility (i.e., lower E) and as Rec increased (i.e., VITON > BUNA > LDPE > HDPE for Rec ≥ 299). Statistically significant differences were detected among collectors (F4, 19 = 7.15, p = 0.001) and the covariate was also significant (F1, 19 = 40.04, P = <0.001). Significant pairwise differences were detected between each of the flexible collectors and the stationary collector (p < 0.027). The frequency of oscillation of the flexible collectors expressed as Strouhal number (St) followed a similar pattern to what is reported above in terms of magnitude of the response and relationship with increasing Rec, however the ranking changed with BUNA > VITON > LDPE > HDPE for Rec > 299 (Figure 3B) perhaps due to the greater deflection in VITON. Statistically significant differences were detected among collectors (F4, 19 = 9.11, p = 0.003) and the covariate (Rec) was significant (F1, 19 = 32.05, p = 0.001). Significant pairwise differences were detected in the response between VITON, BUNA and LDPE and the stationary collector (p < 0.009) and between BUNA and HDPE (p = 0.035).
3.2 Collector capture efficiency
The particle capture efficiency (η) declined by an order of magnitude across the range of Rec examined for all types of collectors (i.e., 0.3%–0.6% at Rec = 30 vs. 0.03%–0.06% at Rec = 508; Figure 4A). Whereas the pattern was similar among collectors, HDPE and LDPE had consistently lower η compared to the more flexible collectors (BUNA and VITON) and the stationary collector. Only at the highest Rec did η of BUNA appear to exceed that of the stationary collector. Statistically significant differences among collectors were detected (F4, 119 = 2.46, p = 0.049), and Rec was a significant covariate (F1, 119 = 168, p = 0.001). In this case, significant pairwise differences (p < 0.001) were detected between collectors in the higher η group (BUNA, VITON, and stationary collector) and collectors in the lower η group (HDPE and LDPE). Distinction among the collector types was evident when η was plotted vs. the non-dimensional stiffness (k’) (Figure 4B). In this case, the curves for each collector type were somewhat parallel with clear separation and ranking matching the Young’s modulus of the collector. Two important distinctions were, however, evident: (1) there was overlap among collector curves at given k’ values (e.g., HPDE, LDPE and BUNA at k’ ∼ 10–1); and (2) collector efficiency (η) for BUNA and VITON were greater than those for the stationary collector when Rec > 299–the left-most point in each curve.
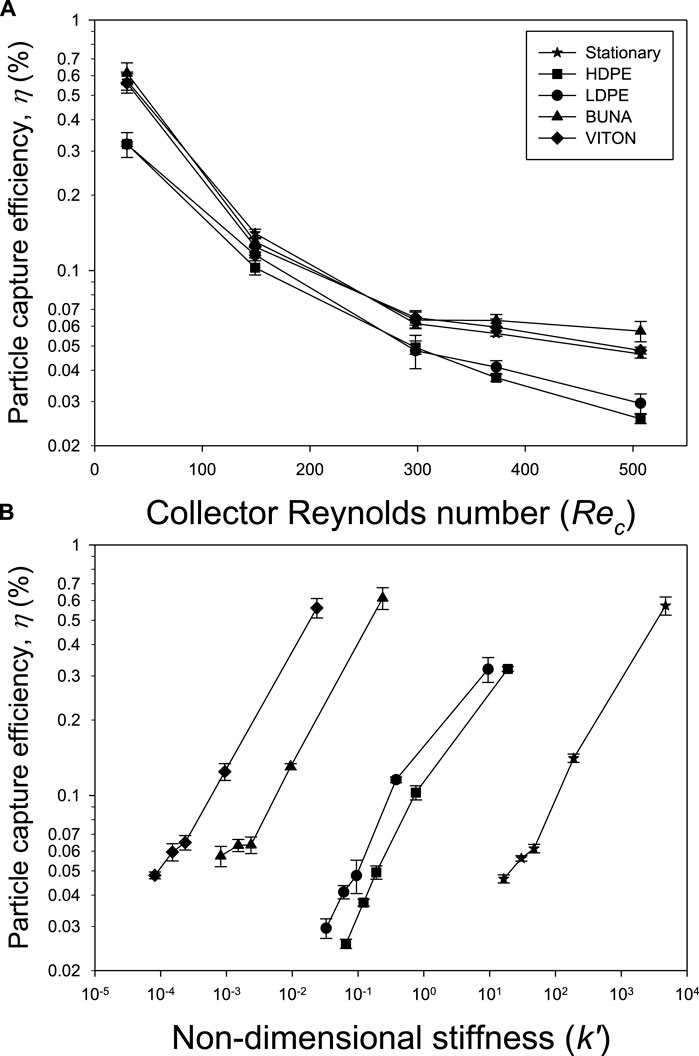
Figure 4. Particle capture efficiency (%) of stationary and flexible collectors measured in a flow chamber versus (A) collector Reynolds number (Rec) and (B) non-dimensional stiffness (k’) (mean ± SE; n = 5).
The spatial pattern of capture (Eqs 5, 6) can provide insight into the mechanism of particle capture. Particles were captured circumferentially around collectors at the lowest Rec = 30 with moderately higher capture at 90° and 270°, i.e., 90° from the stagnation point (=0°), for both the stationary collector and VITON, the most flexible collector (Figure 5). The average particle captured increased by ∼50% at the highest Rec = 508 for both collectors (47% ± 7% and 52% ± 8% for stationary collector and VITON, respectively) but the pattern differed. The increase in particle capture on the stationary collector was larger restricted to the upstream and to a lesser extent on the downstream sides, whereas particle capture on VITON also increased at 90° on either side of the stagnation point (i.e., 90° and 270°; Figure 5). Similarity on these patterns were observed on the other collectors depending somewhat on their flexibility (data not provided).
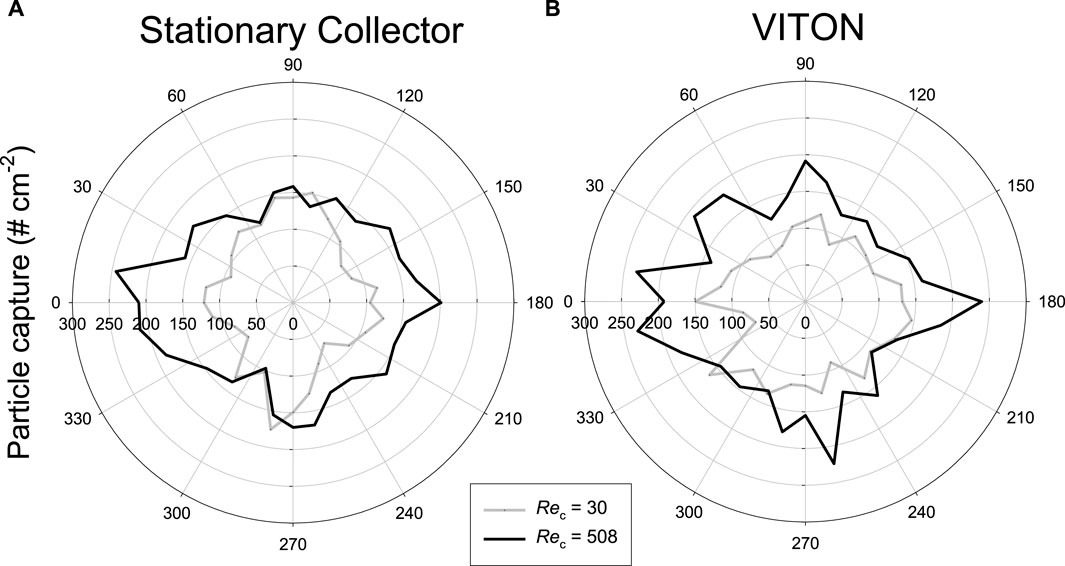
Figure 5. Spatial pattern of the distribution of particle capture on the circumference of collectors at the lowest and highest Rec for (A) stationary and (B) VITON–the most flexible collector. Flow is from the left and 0° is the stagnation point with the angle increasing to the right.
No-movement control experiments, in which collectors were held rigid within the flow chamber, were used to determine if the differences among the two groups of collectors identified above were due to material properties of the collectors that may have affected particle capture or particle identification in images. Particle capture efficiency was not uniform among the collectors at Rec = 149 even though they were stationary in orientation (Figure 6). Rather η were higher and more similar on VITON, BUNA and the stationary collector than on the two polyethylene collectors (Figure 6A). Significant differences in η were found among collectors (ANOVA F2, 12 = 7.92, p = 0.006) and pairwise differences were found between the stationary collector and the HDPE and LDPE collectors (p = 0.023 and p = 0.008, respectively). Similar results in which η was lower on HDPE and LDPE were obtained at Rec = 508, but in this case the comparison involved the two polyethylene and stationary collector (Figure 6B). Statistically significant differences in η were detected among collectors (F2, 11 = 0.0166, p < 0.001) and pairwise differences were found between the stationary collector and HDPE and LDPE (p = 0.001, p = 0.003, respectively). On average the HDPE collector captured particles 13.9% ± 0.8% less efficiently relative to the stationary collector and the LDPE collector captured particles 17.4% ± 0.5% less efficiently. These correction factors were used when calculating the relative capture efficiencies between flexible and stationary collectors.
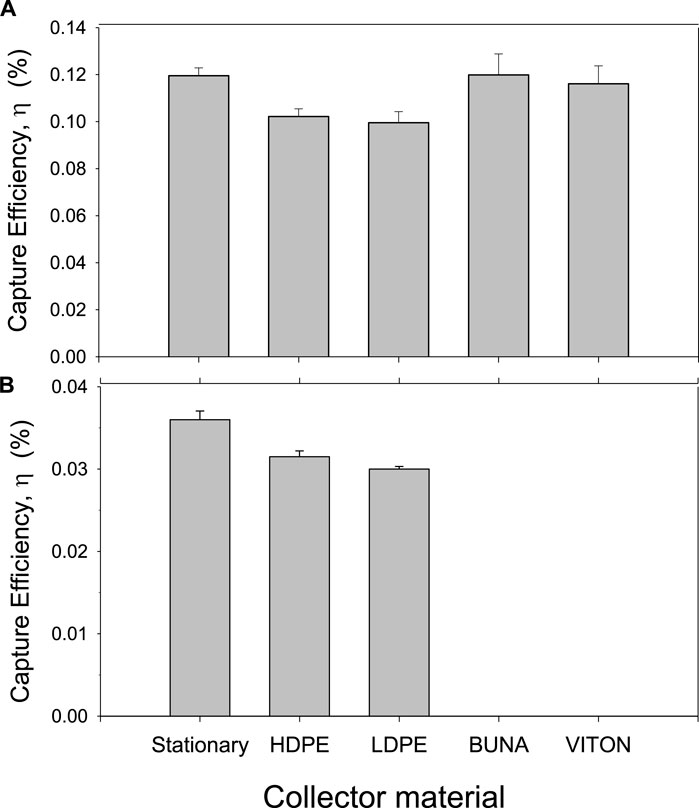
Figure 6. Comparison of the effects of the material of rigidly held collectors on particle capture efficiency (mean ± SE): (A) All material examined at Rec = 149 (n = 5); and (B) subset of materials that differed from stationary examined at Rec = 508 (n = 3).
4 Discussion
The results of this study demonstrate that the flexibility of a collector (indicated by the Young’s modulus, E) affects the capture efficiency (η) of suspended particles from a fluid medium at ecologically relevant Reynolds numbers (Eq. 1), i.e., 30 < Rec < 500. Specifically, η appears to be related to the dimensionless stiffness (k’; Eq. 4), which is somewhat comparable to the reciprocal of the Cauchy number (Ca, ratio of inertial forces: compressible [elastic] forces; de Langre, 2008). Capture efficiency declined from Rec = 30 to 299 but remained somewhat higher for the stiffer collector (Figure 4B), which was more perpendicular to the flow (Figure 2A; longitudinal deflection α 1/k’). At higher Rec (i.e., >299), however, the flexible collectors had η that were up to 23% higher (BUNA at Rec > 508) than the rigid stationary collector because flexible collectors experienced larger transverse amplitudes (Figure 3A; transverse amplitude α 1/k’) that resulted in additional particles captured on the sides perpendicular to the flow (Figure 5). These higher Rec corresponded to periods when the most flexible collectors had large transverse oscillation frequencies (>4 Hz), and a large relative amplitude (>60% in the transverse direction and >100% in the longitudinal). It is relevant to note that 4 Hz exceeds the natural frequency (fn; Eq. 3) of the most flexible collector in water. Given these observations, it is likely that the capture efficiency of flexible collectors has been underestimated at ecologically relevant Rec using the standard model of a rigid stationary collector.
The material properties of the collector also affect η as was determined in the control experiments. It is likely that part of this difference was due to the difficulty of visualizing bright particles on the polyethylene surfaces, which were white in color relative to the darker grey/black and brown colors of the BUNA, VITON, and stationary collectors, respectively. It is relevant to note that the η measured on the stationary collector were similar to those reported elsewhere (Figure 7). Overall, η of the rigid collector in this study ranged from 0.57% to 0.046% across the Rec and these values fall within the range reported in other empirical and computational studies (Figure 7). In general, η increases with the relative particle diameter, R, at these Rec (Palmer et al., 2004). The correspondence between our values for rigid stationary collectors (R = 0.087) and consistent observations using R values similar to ours are indicated by grey colored symbols in Figure 7. Our observations appear to be reasonable within this range, although the value for Rec = 30 is at the higher end of the range than has been reported elsewhere.
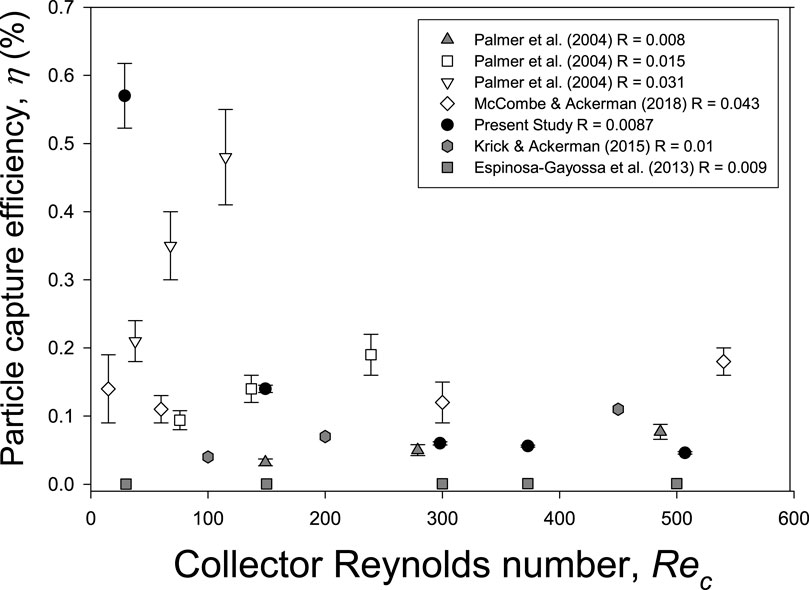
Figure 7. Comparison of particle capture efficiency (η) measured on rigid collectors at different collector Reynolds numbers (Rec) in empirical (Palmer et al., 2004; McCombe and Ackerman, 2018) and computational studies (Espinosa-Gayosso et al., 2013; Krick and Ackerman, 2015). Capture efficiency, η, generally increases with the relative particle diameter, R, which is indicated in the legend. Observations using R similar to the present study are indicated by grey colored symbols.
To the best of our knowledge, this is the first empirical examination of the effects of flexible moving collectors on particle capture (Figure 8). Capture efficiency declined rapidly with Rec in the laminar regime, but the rate of decline decreased for rigid and flexible collectors that experienced motion at higher and turbulent Rec relative to stationary rigid collectors. Specifically, the movement of the collector through higher frequency oscillations lead to increased η in the case of mechanical actuation of rigid collectors (McCombe and Ackerman, 2018) or in terms of both static drag reconfiguration and flow-induced vibration of flexible collectors examined empirically in the present study and modeled previously for a soft coral (Boudina et al., 2021). An estimate of the static drag contribution to deflection was made through the calculation of the drag force on the collector from the quadratic drag equation and using this is determine the deflection of a uniformly loaded cantilever beam. This technique could only be applied to the LDPE collector because it was the only linearly-elastic material with a response. In this case, the maximum observed deflection (% dc) increased from 23%, 33% and 47% at 20, 25 and 34 cm/s, respectively vs. 6%, 9% and 15% increases for the calculated static drag. In other words, an average of 28% ± 2% of the deflection observed on LDPE between 20 and 34 cm/s was estimated to be due to static drag reconfiguration. These empirical studies build on the insight obtained through direct numerical simulations (DNS; Espinosa-Gayossa, 2012; Espinosa-Gayossa, 2013; Espinosa-Gayossa, 2015) and computational fluid dynamic models (CFD; Krick and Ackerman, 2015), respectively. Those models investigated the effects of vortex induced vibrations on particle capture efficiency, however they did not include Young’s modulus of the collector (i.e., flexibility) as an experimental parameter. The present study demonstrates that flexibility affects the motion of a collector at each Rec, which is especially important as the flow region downstream of the collector becomes turbulent (Rec > 299) when vortex induced vibrations are more likely to occur.
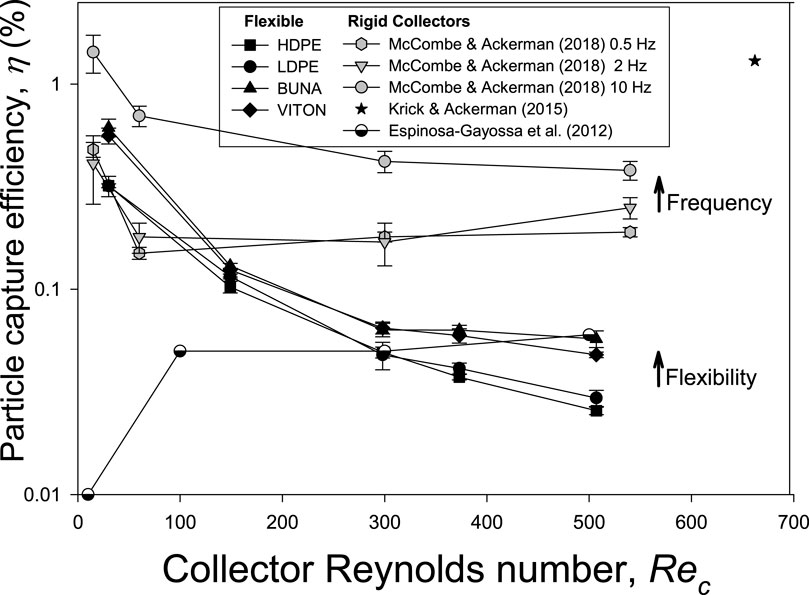
Figure 8. Comparison of particle capture efficiency (η) measured on moving collectors at different collector Reynolds numbers (Rec) including flexible ones examined in this study and rigid ones measured (McCombe and Ackerman, 2018) or modeled previously (Espinosa-Gayosso et al., 2012; Krick and Ackerman, 2015). Note that increasing the movement of the collector through higher frequency oscillations leads to increased η in the case of mechanical actuation of rigid collectors or in terms of flow induced vibration of flexible collectors.
The difference in η across E may also be understood through the particle Stokes number (Stk; Eq. 2). When Stk was low (i.e., 10–4) the particles did not have enough momentum to penetrate the collector boundary layer to be captured. At intermediate Rec (Rec = 149 and 299) the Stk increased to 10–3 and the relative difference in η between the most flexible and less flexible collector decreased. This was likely due to increased relative momentum of the particles with respect to the collector and subsequent penetration of the collector boundary layer caused by collector motion. Flow-induced collector motion leading to oscillations in the transverse direction adds additional momentum to the system making capture more likely at higher Rec. When the system becomes turbulent (Rec = 374 and Rec = 508), the oscillation frequency of the BUNA collector exceeded 5 Hz and most particles were captured on the upstream surface of the collector. In the case of the VITON, the oscillation frequency was ∼4 Hz and the relative amplitude exceeded >60% in the transverse direction and >100% in the longitudinal, leading to more particle capture on the side surfaces of the collector. These results are consistent with those of McCombe and Ackerman (2018) who found that transversely oscillating collectors capture more particles on the downstream and sides of the collector. These results are also supported by the CFD model by Krick and Ackerman (2015), who identified the ‘collector chasing’ capture mechanism in which a moving collector overtakes a particle. This mechanism is likely responsible for capture on the sides and downstream portion of the collector in this study. Moreover, particles caught in vortices leeward of the collector have high residence times and, therefore, have a higher probability of being captured (i.e., on the downstream side; Shimeta and Jumars, 1991). Higher turbulence (high Rec) and Stokes number (i.e., Stk > 10–1) may lead to higher η through increased encounter rates, but increased relative momentum of such particles would not be relevant because they already have sufficient inertia to penetrate collector boundary layers (Krick and Ackerman, 2015).
There are limitations of this study that may affect the interpretation of the results. Most notable among these is the short length of the collectors used because of the size limitations of the flow chamber. Specifically, the chamber was designed to provide suitable conditions for benthic mass transport studies (e.g., low volume, flow conditioning and entrance length for boundary layer development and fully developed flow, large width to depth ratio to minimize secondary flows [i.e., >3.5], and minimal flow obstruction of channel by the subject of interest; Nowell and Jumars, 1987; Ackerman, 1999). Consequently, a collector length of 3.75 cm (lc = 0.0375 m) was used. This limited the fn of the collectors to relatively large values, which decline non-linearly with increases in lc (i.e.,
5 Conclusion
The results of this study indicate that the flexibility of a collector affects its ability to capture suspended particles once the flow regime around the collector leads to larger-scale hydromechanical responses. Specifically, enhanced particle capture efficiency, η, occurs once turbulent flow leads to a collector oscillation frequency transverse to the flow direction >4 Hz along with a relative amplitude >60% of the collector diameter in the transverse and >100% in the longitudinal direction. A variety of mechanisms are responsible for particle capture in nature including direct interception, inertial impaction as well as capture on lateral surfaces and collector chasing due to flow induced vibrations. These results should provide a better understanding of how freely moving flexible collectors capture particles due to vortex induced vibrations at ecologically relevant collector Reynolds numbers. Ultimately it should be possible to better understand the complexity of biological collectors and hence particle capture processes in aquatic and terrestrial environments.
Data availability statement
The original contributions presented in the study are included in the article/Supplementary Material, further inquiries can be directed to the corresponding authors.
Author contributions
KS: Data curation, Formal Analysis, Investigation, Methodology, Visualization, Writing–original draft, Writing–review and editing. MH: Methodology, Validation, Writing–review and editing. JDA: Conceptualization, Formal Analysis, Funding acquisition, Methodology, Project administration, Resources, Supervision, Validation, Writing–original draft, Writing–review and editing.
Funding
The author(s) declare financial support was received for the research, authorship, and/or publication of this article. Funding for this project was provided by NSERC Discovery Grant to JDA.
Acknowledgments
The authors acknowledge the support of Shaylah Tuttle-Raycraft, Chris Farrow, Katherine Tran, Natalie Perrin, and Dori McCombe from the Ackerman Lab.
Conflict of interest
The authors declare that the research was conducted in the absence of any commercial or financial relationships that could be construed as a potential conflict of interest.
Publisher’s note
All claims expressed in this article are solely those of the authors and do not necessarily represent those of their affiliated organizations, or those of the publisher, the editors and the reviewers. Any product that may be evaluated in this article, or claim that may be made by its manufacturer, is not guaranteed or endorsed by the publisher.
Supplementary material
The Supplementary Material for this article can be found online at: https://www.frontiersin.org/articles/10.3389/fmech.2024.1411361/full#supplementary-material
SUPPLEMENTARY FIGURE S1 | Characteristics of the hydrodynamic conditions in the flow chamber at the location at which the collector was placed. Flow profiles are based on the 1/7th power law solution for a turbulent flat plate boundary layer. Symbols represent measured values obtained at heights of 2.5, 3.5 and 4 cm above the bottom at 5, 10 and 25 cm s-1 (data were not obtained at the other chamber velocities).
SUPPLEMENTARY FIGURE S2 | Drawing of the maximum longitudinal deflection of collectors at different collector Reynolds numbers as viewed from the side of the flow chamber (flow is from left to right). The neutral position of the collector is indicated by dashed lines. Collectors are 0.15 cm in diameter (dc = 1.5 mm).
References
Ackerman, J. D. (1999). Effect of velocity on the filter feeding of dreissenid mussels (Dreissena polymorpha and Dreissena bugensis): implications for trophic dynamics. Can. J. Fish. Aquatic Sci. 56, 1551–1561. doi:10.1139/f99-079
Ackerman, J. D. (2000). Abiotic pollen and pollination: ecological, functional, and evolutionary perspectives. Plant Syst. Evol. 222, 167–185. doi:10.1007/978-3-7091-6306-1_9
Ackerman, J. D. (2006). “Sexual reproduction of seagrasses: pollination in the marine context,” in Seagrasses: biology, ecology and conservation. Editors A. W. D. Larkum, J. J. Orth, and C. M. Duarte (Dordrecht: Springer), 89–109.
Ackerman, J. D., and Nishizaki, M. T. (1999). How stiff is a French fry? – Teaching biomechanics to biology students. J. Biol. Educ. 34, 36–40. doi:10.1080/00219266.1999.9655681
Armitage, J. M., Franco, A., Gomez, S., and Cousins, I. T. (2008). Modeling the potential influence of particle deposition on the accumulation of organic contaminants by submerged aquatic vegetation. Environ. Sci. Technol. 42, 4052–4059. doi:10.1021/es702439u
Boller, M. L., Swain, T. D., and Lasker, H. R. (2002). Skeletal morphology and material properties of a fragmenting gorgonian coral. Mar. Ecol. Prog. Ser. 228, 131–141. doi:10.3354/meps228131
Boudina, M., Gosselin, F. P., and Étienne, S. (2021). Vortex-induced vibrations: a soft coral feeding strategy? J. Fluid Mech. 916, A50. doi:10.1017/jfm.2021.252
Bourguet, R., Karniadakis, S., and Triantafyllou, M. S. (2011). Vortex induced vibrations of a long flexible cylinder in shear flow. J. Fluid Mech. 667, 342–382. doi:10.1017/jfm.2011.90
Chamberlain, J. A. (1978). Mechanical properties of coral skeleton: compressive strength and its adaptive significance. Paleobiology 4, 419–435. doi:10.1017/s0094837300006163
de Langre, E. (2008). Effects of wind on plants. Annu. Rev. Fluid Mech. 40, 141–168. doi:10.1146/annurev.fluid.40.111406.102135
de Langre, E. (2019). Plant vibrations at all scales: a review. J. Exp. Bot. 70, 3521–3531. doi:10.1093/jxb/erz209
Ellis, B., and Smith, R. (2000). Polymer database- A property database: web version. Boca Raton, FL: Chapman and Hall/CRC Press. Available at: https://poly.chemnetbase.com/intro/index.jsp#prop (Accessed October 31, 2015).
Engineering ToolBox. (2003). Young’s modulus - tensile and yield strength for common materials. Available at: https://www.engineeringtoolbox.com/young-modulus-d_417.html (Accessed August 09, 2018).
Espinosa-Gayosso, A., Ghisalberti, M., Ivey, G. N., and Jones, N. L. (2012). Particle capture and low-Reynolds-number flow around a circular cylinder. J. Fluid Mech. 710, 362–378. doi:10.1017/jfm.2012.367
Espinosa-Gayosso, A., Ghisalberti, M., Ivey, G. N., and Jones, N. L. (2013). Particle capture by a circular cylinder in the vortex-shedding regime. J. Fluid Mech. 733, 171–188. doi:10.1017/jfm.2013.407
Espinosa-Gayosso, A., Ghisalberti, M., Ivey, G. N., and Jones, N. L. (2015). Density-ratio effects on the capture of suspended particles in aquatic systems. J. Fluid Mech. 783, 191–210. doi:10.1017/jfm.2015.557
Espinosa-Gayosso, A., Ghisalberti, M., Shimeta, J., and Ivey, G. N. (2021). On predicting particle capture rates in aquatic ecosystems. PLOS ONE 16, e0261400. doi:10.1371/journal.pone.0261400
Gosselin, F. P. (2019). Mechanics of a plant in fluid flow. J. Exp. Bot. 70, 3533–3548. doi:10.1093/jxb/erz288
Haugen, N. E. L., and Kragset, S. (2010). Particle impaction on a cylinder in a cross flow as function of Stokes and Reynolds numbers. J. Fluid Mech. 661, 239–261. doi:10.1017/s0022112010002946
Jeyasuria, P., and Lewis, J. C. (1987). Mechanical properties of the axial skeleton in gorgonians. Coral Reefs 5, 213–219. doi:10.1007/bf00300967
Jordan, T., Pierce, J., and Correll, D. (1986). Flux of particulate matter in the tidal marshes and subtidal shallows of the rhode river estuary. Estuaries 9, 310–319. doi:10.2307/1351410
Krick, J., and Ackerman, J. D. (2015). Adding ecology to particle capture models: numerical simulations of capture on a moving cylinder in crossflow. J. Theor. Biol. 368, 13–26. doi:10.1016/j.jtbi.2014.12.003
Leonard, L. A., Hine, A. C., and Luther, M. E. (1995). Surficial sediment transport and deposition processes in a Juncus-roemerianus marsh, west-central Florida. J. Coast. Res. 11, 322–336.
McCombe, D., and Ackerman, J. D. (2018). Collector motion affects particle capture in physical models and in wind pollination. Am. Nat. 192, 81–93. doi:10.1086/697551
Miler, O., Albayrak, I., Nikora, V., and O’Hare, M. (2012). Biomechanical properties of aquatic plants and their effects on plant–flow interactions in streams and rivers. Aquat. Sci. 74, 31–44. doi:10.1007/s00027-011-0188-5
Niklas, K. J. (1985). The aerodynamics of wind pollination. Botanical Rev. 51 (3), 328–386. doi:10.1007/bf02861079
Nowell, A. R. M., and Jumars, P. A. (1987). Flumes: theoretical and experimental considerations for simulation of benthic environments. Oceanogr. Mar. Biol. Annu. Rev. 25, 91–112.
Palmer, M. R., Nepf, H. M., Pettersson, T. J., and Ackerman, J. D. (2004). Observations of particle capture on a cylindrical collector: implications for particle accumulation and removal in aquatic systems. Limnol. Oceanogr. 49, 76–85. doi:10.4319/lo.2004.49.1.0076
Raju, N., and Meiburg, E. (1995). The accumulation and dispersion of heavy particles in forced two-dimensional mixing layers. Part 2: the effect of gravity. Phys. Fluids 7, 1241–1264. doi:10.1063/1.868581
Rubenstein, D. I., and Koehl, M. A. R. (1977). The mechanisms of filter feeding: some theoretical considerations. Am. Nat. 111 (981), 981–994. doi:10.1086/283227
Shimeta, J., and Jumars, P. A. (1991). Physical mechanisms and rates of particle capture by suspension-feeders. Oceanography and Marine Biology. Annu. Rev. 29, 191–257.
Shukla, S., Govardhan, R. N., and Arakeri, J. H. (2013). Dynamics of a flexible splitter plate in the wake of a circular cylinder. J. Fluids Struct. 41, 127–134. doi:10.1016/j.jfluidstructs.2013.03.002
Spielman, L. A. (1977). Particle capture from low speed laminar flows. Annu. Rev. Fluid Mech. 9, 297–319. doi:10.1146/annurev.fl.09.010177.001501
Sumer, B. M., and Fredsøe, J. (2006). Hydrodynamics around cylindrical structures. Revised Edn. Singapore: World Scientific.
Vanden Byllaardt, J., and Ackerman, J. D. (2014). Hydrodynamic habitat influences suspension feeding by unionid mussels in freshwater ecosystems. Freshw. Biol. 59, 1187–1196. doi:10.1111/fwb.12339
Vandiver, K. J., and Jong, Y. J. (1987). The relationship between in-line and cross-flow vortex-induced vibration of cylinders. J. Fluids Struct. 1, 381–399. doi:10.1016/s0889-9746(87)90279-9
Wainwright, S. A., Biggs, W. D., Currey, J. D., and Gosline, J. M. (1982). Mechanical design in organisms. Princeton: Princeton University Press.
Keywords: particle capture efficiency, elasticity, collector, collector Reynolds number, flexibility, Cauchy number
Citation: Sewak K, Hassan M and Ackerman JD (2024) Fluid-structure interaction of flexible collectors affects particle capture efficiency at ecologically relevant collector Reynolds numbers. Front. Mech. Eng 10:1411361. doi: 10.3389/fmech.2024.1411361
Received: 13 April 2024; Accepted: 01 July 2024;
Published: 02 August 2024.
Edited by:
Marco Ghisalberti, University of Western Australia, AustraliaReviewed by:
Shi Tao, Dongguan University of Technology, ChinaFrederick Gosselin, Polytechnique Montréal, Canada
Copyright © 2024 Sewak, Hassan and Ackerman. This is an open-access article distributed under the terms of the Creative Commons Attribution License (CC BY). The use, distribution or reproduction in other forums is permitted, provided the original author(s) and the copyright owner(s) are credited and that the original publication in this journal is cited, in accordance with accepted academic practice. No use, distribution or reproduction is permitted which does not comply with these terms.
*Correspondence: Josef D. Ackerman, YWNrZXJtYW5AdW9ndWVscGguY2E=