 Yang-Yuan Chen
 Jeng-Haur Horng
- Department of Power Mechanical Engineering, National Formosa University, Yunlin, Taiwan
The generation of third particles and change in viscosity lead to the gradual degradation of the performance of the machine interface. The generation of third particles may come from wear debris or environmental particles, which form a three-body contact system at the contact interface. The viscosity of the lubricant will also change with the long-term operation of the components. This paper uses a three-body lubrication model to study the influence and interaction of lubricant viscosity change and the presence of third particles on the contact characteristics, including the real contact area, the particle contact area ratio, the solid load percentage, the film thickness, and the evolution of the lubrication regime. The results show that when the interface is in a three-body mixed lubrication regime, the dimensionless total real contact area increases with the increase in particle size and density at the same lubricant viscosity, while the trend is the opposite in dry contact and boundary lubrication interfaces. When viscosity decreases, a three-body contact interface is more prone to entering boundary lubrication than a two-body contact interface, resulting in surface damage. Regardless of surface roughness, particle size, and dry or lubricated contact conditions, the turning point of the contact area (TPCA) phenomenon is usually when the ratio of particle size to surface roughness is 0.8–1.3. Under the same ratio of particle size to surface roughness, the critical load of the TPCA phenomenon increases with the increase in third-particle size and surface roughness, but decreases with the increase in lubricant viscosity and particle density.
1 Introduction
The performance of any lubrication unit, such as gears and bearings, gradually deteriorates over time, primarily due to changes in lubricant viscosity and an increase in particle contaminants. Moreover, as time progresses, the accumulation of particles increases, resulting in a greater disparity between viscosity values and initial viscosity. At this point, the contact interface transitions from two-body (2-body) to three-body contact (3-body) due to the presence of particles (Popov, 2018). The third-body approach (TBA), or interface approach, was initially proposed by Godet (1984). TBA is based on the concept that the entirety of the debris (third particle) is detached from the relative motion of the bodies and behaves as a dynamic screen trapped in the contact interface (Godet, 1984). Furthermore, the lubrication characteristics of this type of contact interface represent a significant tribological issue currently awaiting resolution (Greenwood, 2020). Due to the influence of particles on interface separation, lubricant viscosity affects the characteristic change of mixed and boundary lubrication in 3-body contact similarly or significantly differently than 2-body contact. This is one of the objectives of clarification in this paper. However, in the past, research on third bodies has primarily focused on the fluid dynamics of lubricants and their physical and chemical interactions with surfaces. There has been little emphasis on the mixed and boundary lubrication of solid third particles existing between interfaces, including their effects on parameters such as film thickness, lubrication regime, real contact area, surface separation, and the ratio of particle-to-surface contact area in the context of the tribological performance of 3-body contact interfaces. Wang et al. (2022) modeled 3-body microcontact in mixed EHL based on the Greenwood and Tripp model and studied the influence of solid particles on point contact mixed lubrication. However, they did not consider elastic-plastic deformation during contact, and the model is only applicable to relatively mild mixed lubrication, not to more severe mixed and boundary lubrication (Wang et al., 2022).
The influence of third bodies on the tribological performance of lubricated interfaces is often overlooked in research. This is because researchers often do not consider the force balance at the 3-body interface. This neglect can lead to discrepancies between the load-sharing ratios (fluid, surface, and particle) observed in these studies and the actual scenario. Specifically, existing studies typically focus on 3-body dry wear conditions and do not consider the micro-contact characteristics of the third particle under lubricated wear conditions. This means that they cannot verify the friction and wear characteristics of the three bodies. For example, in the case of 3-body dry wear, Torrance proposed a mechanical model that accounts for the different effects of the material abrasive wear rate on its mechanical properties during the abrasion process, in order to determine wear under specific conditions and measure material performance under conditions similar to wear (Torrance, 2005). Horng et al. proposed a 3-body microcontact model for rough surfaces to understand the influence of particles between surfaces on contact characteristics. Based on the simplification of this model, a 2-body microcontact simulation transitioning from surface-to-surface and particle-to-surface can be obtained (Horng et al., 2006). Zambrano et al. analyzed the running-in period during abrasive wear processes of austenitic stainless steel AISI 316L and Hadfield (15%Mn–1.5%C) steel using a testing pin (flat-ended) –abrasive paper wear configuration. They evaluated the influence of normal load, abrasive size, and material type (Zambrano et al., 2020). Koulocheris et al. demonstrated that when a particle’s size exceeds the thickness of a lubricating film, material removal deforms the bearing raceway and leads to severe wear. Even if broken into smaller pieces, these particles continue to induce wear as they circulate within the lubricant to different areas (Koulocheris et al., 2013). Miftakhova et al. considered the contact problem of a system of particles rolling on a viscoelastic layer bonded to a rigid half-space. Their results demonstrated that the coefficient of friction, calculated using the 3-body model, decreases when the rolling of particles is taken into account (Miftakhova et al., 2019).
In addition, some studies conducted purely experimental research to investigate the friction and wear characteristics under 3-body dry or lubricated contact conditions. However, this approach cannot elucidate the evolutionary mechanism of features such as real contact area and load sharing at the interface. Gheisari and Polycarpou investigated the influence of coating hardness and surface topography under 3-body abrasive conditions. They found that bearing surfaces with a lower hardness exhibited better surface finish than surfaces with rougher morphology and higher hardness (Gheisari and Polycarpou, 2018). Gopaul et al. conducted simulations and experimental verifications on chute systems. By considering the material hardness and angles of chute, they found it is possible to predict the wear rate, flow rate, and service life of the chute system (Gopaul et al., 2022). Li et al. employed flat-on-flat contact between bearing steel (100Cr6) pins and discs, along with Al2O3-based slurries as the interface medium. Their experiments indicated that velocity-dependent fluid dynamic effects can lead to a 14% increase in film thickness and a reduction of approximately 2/3 in frictional force (Li et al., 2023). Jensen and Aghababaei studied interface wear between stainless steel and rubber in a slurry environment. Their results indicate that the wear of both the metal and rubber pads increases exponentially with sliding velocity (Jensen and Aghababaei, 2023). Wang et al. studied the effect of particle type and size on the processing of β-Ga2O3(100) substrates through friction and polishing experiments. Their results indicate that particle size significantly influences the friction, wear, and polishing effects on the substrate. The use of fine particles effectively suppresses the formation of cleavage pits and scratches (Wang et al., 2024). Devo et al. utilized an existing pad-on-rotating disc tribometer to simulate frictional contact in conditions akin to the emergency landing of wheels. Their results indicate that the third body protects the disc structure based on its nature and dimensions. It partially bears the load and restricts the diffusion of frictional heat to the disc (Devo et al., 2024). Bukvić et al. analyzed the research outcomes of using nanotubes in lubricating oils, such as enhancing machinery friction performance and reducing power losses. They demonstrated the adverse effects of nanoparticles on the environment and human health, as well as the cost associated with applying certain types of such particles (Bukvić et al., 2024). These studies, when subjected to theoretical analysis, could have broader applications.
Another portion of the research investigates the contact performance of 2-body dry/lubricated contact interfaces without considering the presence of the third particle using either theoretical or experimental methods. For example, Ghanbarzadeh et al. developed a new contact mechanics model that considers normal and tangential forces in boundary lubrication while also accounting for the mechanical and thermal activation of tribochemical reactions and tribofilm removal. This model enables the observation of in-situ tribofilm thickness and surface coverage, facilitating a better understanding the true mechanisms of wear (Ghanbarzadeh et al., 2016). Terwey et al. enhanced the existing energy-based wear model proposed by Archard and Fleischer to account for mixed lubrication conditions. Based on the obtained pressure and shear stress distributions, the formation of microcracks within the loaded volume can be described. After determining the critical load cycle number for each asperity, local analytical wear coefficients can be derived and local wear depths can be calculated (Terwey et al., 2020). Ali conducted two-dimensional numerical simulations of subsurface stress fields in Hertzian contacts under pure sliding conditions at different velocities and friction coefficients. These results indicate that pure sliding leads to the maximum von Mises stress to migrate towards the surface, and this effect increases with increasing friction coefficient in contact (Ali, 2020). Liang et al. conducted real-time measurements of frictional force and real contact area during the normal loading and unloading stages in a 2-body dry contact experiment. Their experimental results indicate that the friction force is roughly proportional to the normal load and the real contact area during the loading process (Liang et al., 2021). Abass and Mahdi proposed a mathematical model based on the Reynolds equation and conducted a numerical study on the influence of microridges on the performance of three-lobe journal bearings, considering the compressibility of lubricant and cavitation effects. Their results revealed that, compared to smooth surfaces, the pressure and load of three-lobe journal bearings with microridges significantly enhanced, while the friction coefficient decreased by 15% (Abass and Mahdi, 2023). Brhane and Mekonone employed discretized continuum 2D finite element methods to investigate the parameter contact effects of rolling–sliding contact in a steel twin-disc system under various surface friction and comprehensive load conditions. Their results show that as the load increases, both stress and contact width also increase; when friction decreases, stress decreases and extends below the surface (Brhane and Mekonone, 2023). However, 2-body contact is the ideal condition for mechanical interfaces, occurring only at the moment when the sliding interface starts to operate. Subsequently, due to debris, microparticles in the lubricant, or environmental particles, the relative motion interface becomes a 3-body lubricated contact. To address this issue, more in-depth research is needed. Only then can more accurate results be obtained.
In addition to problems stemming from inadequate or excessive lubrication during the lubrication process, lubricant degradation can also lead to reduced tribological functionality, thereby causing premature wear. One of the reasons for the change in a lubricant’s viscosity is its degradation. Lubricant viscosity changes are caused not only by molecular breakdown during operation but also by factors such as water, particles (foreign particles and debris), and oxidation. High temperatures and metal particles also contribute to the oxidation of lubricants (Soltanahmadi et al., 2017). Gamonpilas et al. investigated the tribological measurements of corn syrup solutions with varying viscosities under normal loads. For low-viscosity fluids, only boundary lubrication regimes can be observed. As the viscosity of the fluid increases, both boundary and mixed lubrication regimes can be observed, indicating that the fluid generates sufficient hydrodynamic lift to partially separate the rough contact surfaces (Gamonpilas et al., 2022). Sun et al. investigated the effects of lubricant viscosity on the vibration and temperature rise of silicon nitride full ceramic angular contact ball bearings under different axial loads and speeds. Their results indicate that at the optimal viscosity value of 32 grade, the vibration and temperature rise of the bearings can be minimized to the greatest extent, with no apparent wear on the contact surfaces (Sun et al., 2022). Hei et al. evaluated the friction characteristics of the compression ring-cylinder liner conjunction in engines using lubricating oils of different viscosities. Their results indicate that lower viscosity lubricant results in higher wear loads on the compression ring surface while reducing friction power loss (Hei et al., 2023). The research findings of Zhang et al. indicate that low rotational speeds and low viscosity are detrimental to the formation of oil films. Properly increasing the speed and viscosity can prevent the rupture of boundary films and direct metal-to-metal contact (Zhang et al., 2023). These studies show that viscosity is a critical factor in the tribological performance of lubricated interfaces. Simultaneously, it is also one of the causes of tribological failures such as pitting (Winter and Weiss, 1981; Oila and Bull, 2005) and scuffing (Peterson and Winer, 1980; Horng et al., 1995). Recently, new methods have achieved lower friction and wear, such as the manipulation and control of friction through self-organization, manifested in both selective transfer of material and superlubricity. The task of reducing friction and wear through controlled impact on the contact body can save energy and materials, protect the environment, and enhance ecological sustainability, reliability, and quality (Assenova and Vencl, 2022). Kandeva et al. added varying concentrations of metal additives to rapeseed oil. Their experimental results indicated that the inclusion of metal additives in rapeseed oil indeed reduces the friction coefficient, operating temperature and wear (Kandeva et al., 2022). Vanossi et al. outlined emerging research directions, which find that the friction-related physics of hard 2D layered atomic materials and that of optically and topographically trapped soft microscopic systems, such as cold ions and colloids, do indeed exhibit structural superlubricity. The synergistic combination of “soft–hard” experimental approaches, along with modeling and numerical simulations, can address the significant scientific and practical challenges related to the complex nature of friction phenomena (Vanossi et al., 2020). From the analysis in this paper, we can observe that the variation in lubricant viscosity leads to significantly different changes in the real contact area and lubrication regime between 2-body and 3-body lubricated contacts. This is another key point that the paper aims to clarify.
Previous studies have discussed the influence of velocity parameters, surface parameters, and particle size and concentration on the characteristics of the 3-body lubrication interface. Horng et al. (2022) also noted that film parameter is not a suitable indicator for distinguishing lubrication regimes in 3-body contact systems. Various operating conditions influence TPCA in 3-body dry contact conditions (Chern et al., 2022). Various foreign particles influence the contact characteristics of 3-body dry contact interfaces and validate the feasibility of the theory through four-ball experiments (Horng et al., 2023). In recent years, although there have been studies on the effect of different lubricant viscosities on surface friction (Vanossi et al., 2020) and wear (Tsai, 2024), most studies have focused on 2-body contact conditions. The main focus in this paper is to investigate the effects of variations in lubricant viscosity, particle size, and concentration on the characteristics of lubricated contact interfaces (contact mode, lubrication regime, oil film thickness, and real contact area) under the conditions of force balance and the presence of the third particle, especially regarding their interaction when they coexist simultaneously, along with the detailed transition process of contact modes and lubrication regimes. This lays the foundation for further research. Previous studies have discovered the occurrence of the TPCA phenomenon under dry contact conditions. Therefore, this paper also investigates the influence of TPCA under lubricated contact conditions.
2 Theoretical analysis
2.1 Three-body lubrication analysis
In a three-body (3-body) contact tribology system, which contains (1) surface 1, (2) surface 2, and (3) particles and lubricant (Figure 1), the normal load (Ft) is the sum of the load of fluid lubricant (Ff) and load of solid (Fs):
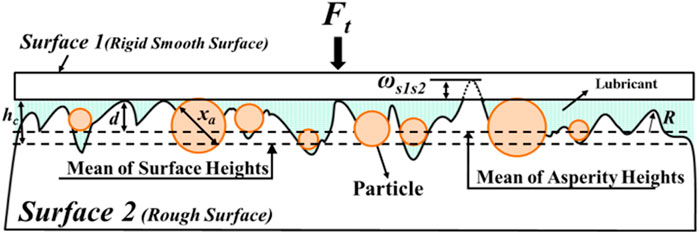
Figure 1. Schematic representation of the 3-body tribology system.
2.2 3-Body microcontact analysis
This study applies the 3-body microcontact model to analyze the real contact areas and loads of solid. Here, the load for solid includes contact between surface 1 and 2 (Fss), as well as between particle and surface 1 (Fsa). Similarly, the real contact area of solids (At) also comprises the contact area between surface 1 and 2 (Ass) and between the particle and surface 1 (Asa).
When particles are present between the relative motions of rough surfaces in mechanical components, it is assumed that the particles, due to work hardening during operation, do not deform when in contact with surface 1 or 2. The 3-body dry contact model can be employed to calculate the relationship between the real contact area, surface separation, and the normal load. The normal load of solid, Fs, and total contact area of solid, At, are given by the following equations for the 3-body micro-contact model (Horng et al., 2022):
where Fss and Ass are calculated according to the previous 2-body contact model (Zhao et al., 2000). Fss-sa and Ass-sa are the contact load of surface 1 with surface 2 and the contact area between surface 1 with surface 2 minus the particle effects, respectively. d is mean separation between two surfaces. x is mean diameter. Hs1 and Hs2 are the hardness of surfaces 1 and 2, respectively; ηa is particle density, xmax is maximum particle size, xmin is minimum particle size. An is the apparent contact area at the interface; Esa and Ess are the equivalent elastic modulus between particle and surface, and the equivalent elastic modulus between surfaces 1 and 2, respectively; he is the maximum distance of the particle deducted from the contact interference with surface 1 and the contact interference with surface 2. The probability density function of summit heights, ϕ(z), and particle size, ϕa(x), are given as follows:
where σs is the standard deviation of the summit height and σa is the standard deviation of the particle size.
2.3 Film thickness analysis
The separation of relative surfaces can not only obtain the load percentage of solids, but also distinguish the lubrication regime of the contact interface. According to Masjedi and Khonsari (2015), the central oil film thickness is expressed thus:
where the W, U, G, σ*, V, and κ are dimensionless load, speed, material, surface roughness, surface hardness, and ellipticity parameter, respectively. The above dimensionless parameters are as follows.
where Rx is the curvature radii of the summit in x directions, μ0 is the ambient lubricant viscosity, u is the rolling speed, α is the pressure–viscosity coefficient, σ is the equivalent root mean square roughness of surfaces 1 and 2, vh is the Vickers hardness of softer material, and a and b are the contact half-length and half-width of surface, respectively. This study combines the calculation of lubricant film thickness with the 3-body micro-contact model and constructs a 3-body lubrication contact model based on the concept of force balance. The analysis results provide information on the film thickness, contact area of the solid, and fluid-borne and solid-borne loads under 3-body contact conditions.
3 Results and discussion
This paper primarily investigates the impact of changes in lubricant kinematic viscosity (v) resulting from operating temperature variations or oil degradation on contact characteristics (real contact area, film thickness, and load percentage of solid) under 3-body lubrication contact conditions. The theoretical analysis incorporates material mechanical properties, operating conditions, and lubricant properties (Tables 1 and 2).
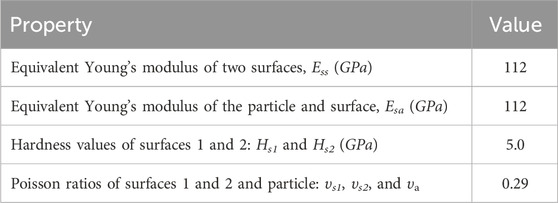
Table 1. Mechanical properties of material.
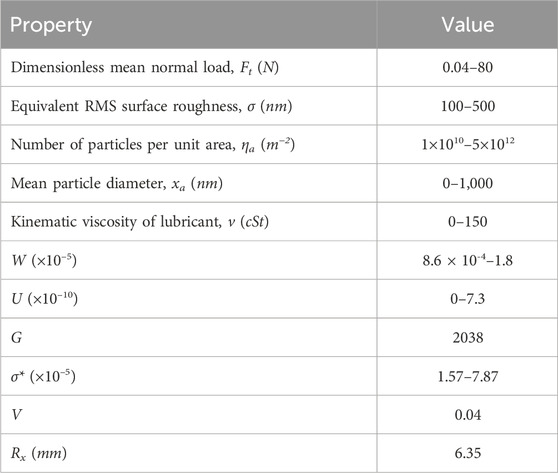
Table 2. Operating conditions.
3.1 Classification of lubrication regime
The fluid- and solid-borne loads obtained from this theoretical analysis can be expressed under 3-body lubrication contact conditions based on the relationship in Eq. 1:
In accordance with Zhu et al. (2012), Zhu and Wang (2013) and Masjedi and Khonsari (2015), the research indicates that the load percentage of solid (Ls) can be utilized to assess the lubrication regime at the contact interface, defined as follows. When Ls is greater than 90%, the lubrication regime is in the boundary lubrication (B.L.). When Ls is less than 3%, the lubrication regime is in the full-film lubrication (F.L.) (Horng et al., 2022). When Ls falls between 3% and 90%, the lubrication regime is in the mixed lubrication (M.L.).
3.2 Classification of 3-body contact mode
When lubricants contain added micro/nano particles, or when components generate debris after a certain period of operation, a 3-body tribology system will be formed at the contact interface. To elucidate the role of the third particle at the 3-body contact interface, this paper utilizes the contact area ratio of the third particle to determine the three contact modes at the 3-body contact interface. The contact area ratio of particle and surface, Asa,t*, and contact area ratio of surface 1 and surface 2, Ass,t*, are defined as follows:
Under different conditions, the relationship between the three contact modes and the Asa,t* are observed (Horng et al., 2023), as shown in Figure 2. Figure 2A shows the surface-to-surface 3-body contact mode (s-s mode). The particles with relatively smaller sizes and the majority of the normal load are borne by the contact between surfaces 1 and 2, expressed as At ≅ Ass and Asa,t*< 0.05. Figure 2B shows the particle-to-surface 3-body contact mode (p-s mode). The particle sizes and concentrations are relatively larger. The normal load is almost borne by the contact points between the particles and surface 1, expressed as At ≅ Asa and Asa,t* > 0.95. Figure 2C shows the hybrid 3-body contact mode (hybrid mode). The load is simultaneously supported by the surface-to-surface contact and particle-to-surface contact, expressed as At = Asa + Ass, 0.05 < Asa,t* < 0.95. If no particles are at the lubricated contact interface, then only the contact between surfaces 1 and 2 occurs, expressed as At = Ass and is referred to as the 2-body contact mode (2-body mode). Therefore, these three 3-body contact modes, in the presence of lubricating oil, belong to mixed and boundary lubrication regimes.
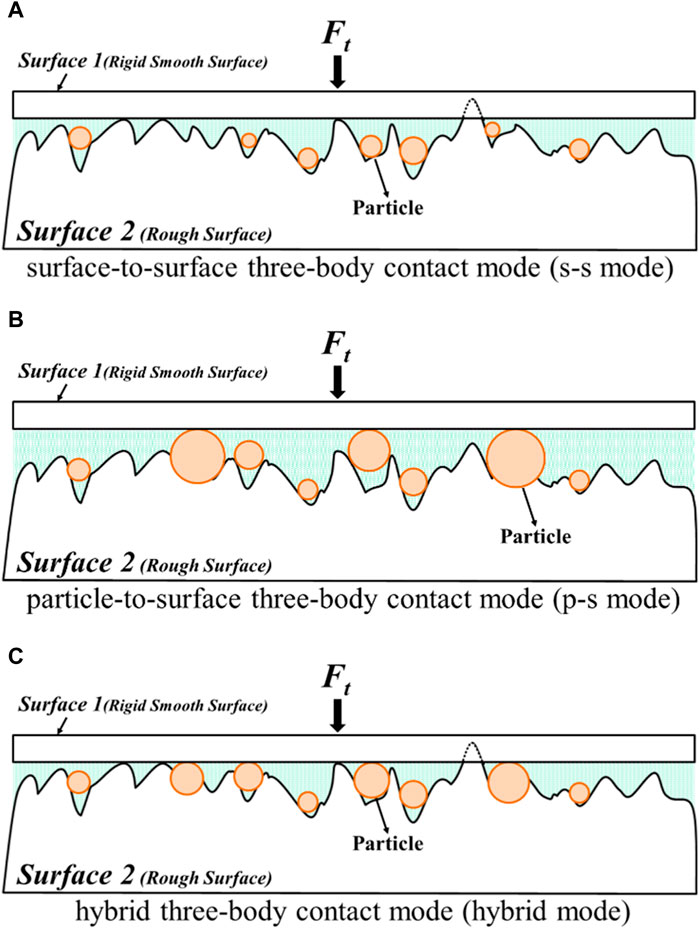
Figure 2. Classification of 3-body contact modes: (A) s-s mode, (B) p-s mode, and (C) hybrid mode.
3.3 Discussion
Figure 3 shows dimensionless area vs dimensionless normal load at various particle diameters: (A) contact area ratio of particle (Asa,t*); (B) dimensionless total contact area (At*) under dry contact condition for σ = 100 nm, ηa = 1011m-2. This explains the evolution of three contact modes occurring at contact interfaces of particles larger than 300 nm as the dimensionless normal load increases: the p-s mode first transitions to the hybrid mode, and then to the s-s mode. As depicted in Figure 3A, xa = 1,000 nm, Asa,t* = 1.0 indicates that the contact interface is in the p-s mode. xa = 0 nm, Asa,t* = 0 indicates that the contact interface is in the s-s mode, representing the traditional 2-body contact value. Figure 3B shows that the At*-Ft* relationship forms a straight line of maximum value for xa = 0 nm (2-body contact) and a line of minimum value for xa = 1,000 nm. These two lines form upper and lower boundary lines; when particles are present at the interface, their corresponding At* values are all smaller than that of a pure 2-body contact surface. The larger the particles, the smaller the At*. As Ft* increases, the At* of the 3-body contact interface gradually rises between the approximate upper and lower limit lines to the upper limit value (2-body contact interface). Therefore, Figure 3 shows that the transition of the contact mode from p-s to hybrid as the normal load increases as the same particle size and slope of At* increases. With the transition of the contact mode from hybrid to s-s, At* also gradually approaches the curve of xa = 0 nm. The evolution of the three contact modes at the 3-body contact interface under different operating conditions has been detailed in previous study (Chern et al., 2022).
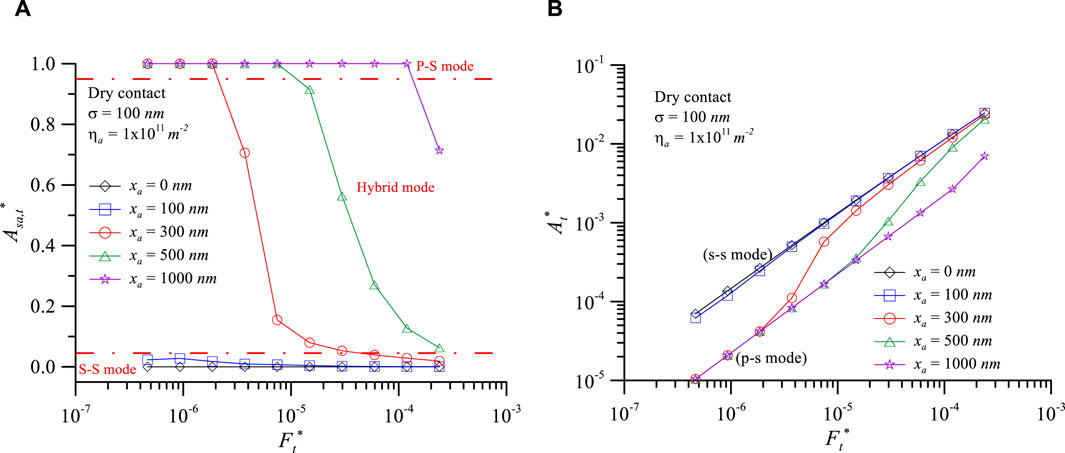
Figure 3. Dimensionless area of dry contact vs. dimensionless normal load at various particle diameters: (A) contact area ratio of particle and (B) dimensionless total contact area for σ = 100 nm and ηa = 1011m-2.
In the situation of 3-body lubrication contact interfaces, their contact behavior differs from dry contact. Figure 4 shows contact characteristics vs dimensionless normal load at various kinematic viscosities (v) of the lubricant (A) contact area ratio of particle, Asa,t* (B) dimensionless contact area, At* (C) load percentage of solid, Ls (D) film thickness, Hc for σ = 300 nm, and ηa = 1011m-2, xa = 500 nm. Figure 3 indicates that the contact mode of the interface can be determined by Asa,t*. Therefore, as shown in Figure 4A, when v < 90 cSt, there will be, with the increase of dimensionless normal load, an evolution three contact modes at the interface. However, when v > 90 cSt, it will only transition from p-s to hybrid mode. Figure 4B shows that when v < 50 cSt, the value of At* almost overlaps with that of 3-body dry contact, indicating that it has little impact on the interface contact characteristics. When v < 70 cSt, as the load increases to a certain critical value (Ft* = 1.5 × 10⁻⁵), the slope of At* with respect to the dimensionless normal load will decrease, and the critical load decreases with increasing viscosity. This is due to higher viscosity resulting in a smaller load required generating hydrodynamic pressure. At the same dimensionless normal load, as the viscosity increases, the hydrodynamic pressure increases, resulting in a decrease in At*. The reason for this phenomenon is explained in Figure 4C.
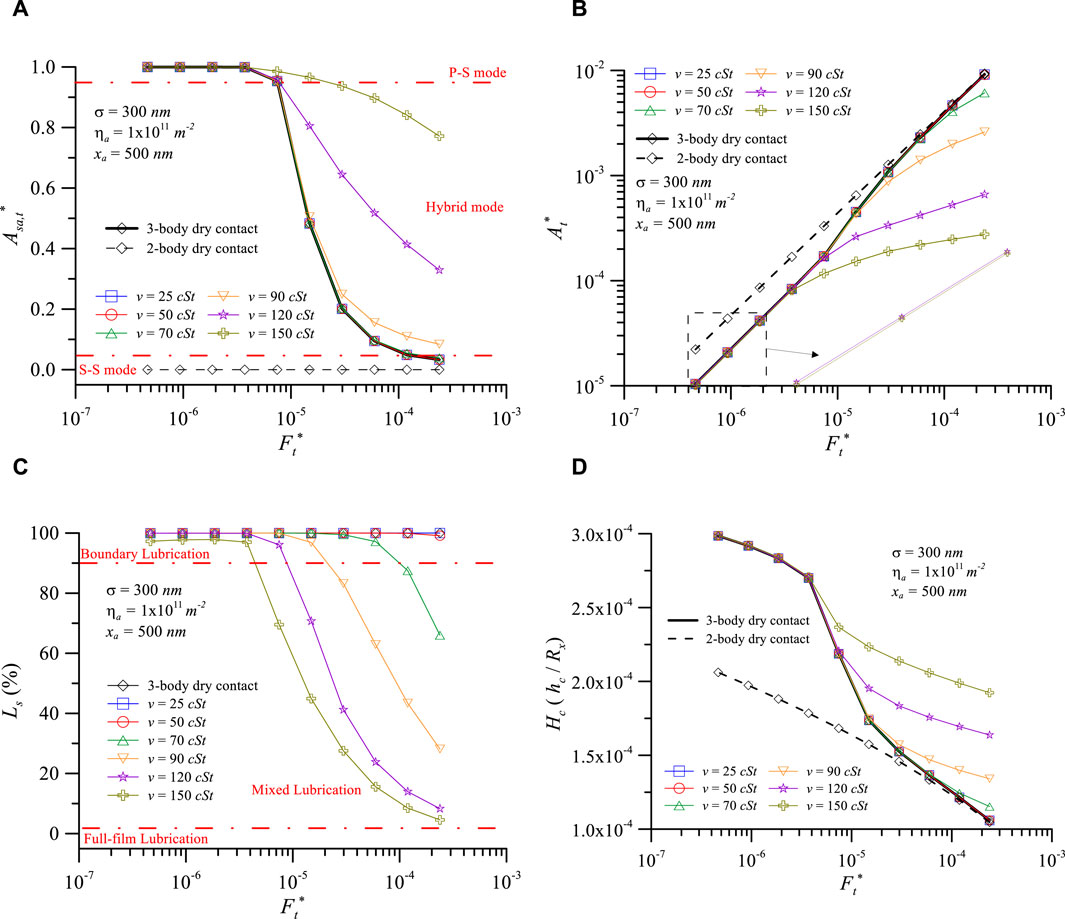
Figure 4. Contact characteristics vs. dimensionless normal load at various viscosities of lubricant: (A) contact area ratio of particle, (B) dimensionless contact area, (C) load percentage of solid, and (D) film thickness for σ = 300 nm, ηa = 1011m-2, xa = 500 nm.
Figure 4C shows that for the interface of v < 50 cSt and dry contact, Ls is 100% under all dimensionless normal loads, indicating that the contact interface is in the boundary lubrication regime. When v > 70 cSt, Ls decreases with the increasing Ft*. Ls decreasing to less than 90% indicates a transition in the lubrication regime from boundary to mixed. A further increase in the load, causing Ls to decrease to less than 3%, will transition the lubrication regime from mixed to full-film. Additionally, Ls decreases with increasing viscosity at the same dimensionless normal load. The higher the viscosity, the smaller the dimensionless normal load required for the transition from boundary to mixed lubrication and from mixed to full-film lubrication. Corresponding to Figures 4B,C, when the interface at lubricated condition and Ls = 100%, its At* coincides with dry contact. When Ls decreases with increasing load to 90% (the lubrication regime transitions from boundary to mixed), its critical dimensionless load is approximately the same as the critical load where the slope of At* decreases. As Ls decreases with the increasing dimensionless normal load, although the slope of At* decreases, the value of At* continues to increase. This indicates that the real solid-borne load continues to increase as the rate at which it increases with normal load decreases, while the rate at which the load borne by fluid increases with normal load increases. Therefore, the decrease in the slope of At* is primarily caused by the transition in lubrication regime induced by the lubricant rather than by changes in the solid contact mode. When v = 90 and 120 cSt, Ls decreases from 100% to 90% (transitioning from boundary to mixed lubrication), their At* decreases by approximately 14.9% and 21.0% compared to the 3-body dry contact. When Ls decreases to 50%, At* decreased by approximately 53.7% and 65.0% compared to the 3-body dry contact.
Figure 4D shows that the Hc value of the 3-body dry contact is significantly larger than that of the 2-body dry contact under medium to low dimensionless normal loads. The interface transitions into the hybrid mode with increasing dimensionless normal load, resulting in a decrease in the Hc value until it reaches a similar value to the 2-body contact. When the lubricant is present at the interface and under lower dimensionless normal loads, the curves of Hc at different viscosities overlap with that of the 3-body dry contact, indicating that the system is currently in the boundary lubrication regime. The Hc gradually deviates from and becomes larger than the curve of the 3-body dry contact as the dimensionless normal load increases, indicating that the lubricant at the contact interface forms a fluid film, leading the interface into a mixed lubrication regime. The results in Figure 4 demonstrate the evolution of the lubricated interface with increasing load, taking v = 90 cSt as an example: from boundary lubrication in the p-s 3-body contact mode → boundary lubrication in the hybrid 3-body contact mode → mixed lubrication in the hybrid 3-body contact mode → mixed lubrication in the s-s 3-body contact mode → full-film lubrication in the s-s 3-body contact mode (if the load further increases). Our analysis provides references for selecting lubricant viscosity under different operating conditions, and third particle sizes are provided for various types of components.
Figure 5 illustrates the load percentage of solid versus dimensionless normal load at various equivalent root mean square surface roughness (σ) under the same operating conditions as Figure 4. Figure 5A shows that for σ = 100 nm, when v = 10 cSt, the Ls approaches 90% at higher dimensionless normal loads. For Figure 5B with σ = 500 nm, a viscosity greater than 70 cSt is required to transition the lubrication regime of contact interface from boundary to mixed. The integration of Figure 4 and Figure 5 reveals that as the equivalent root mean square surface roughness of the component decreases, a lower viscosity lubricant is sufficient to transition the 3-body contact interface from a boundary to mixed lubrication regime.
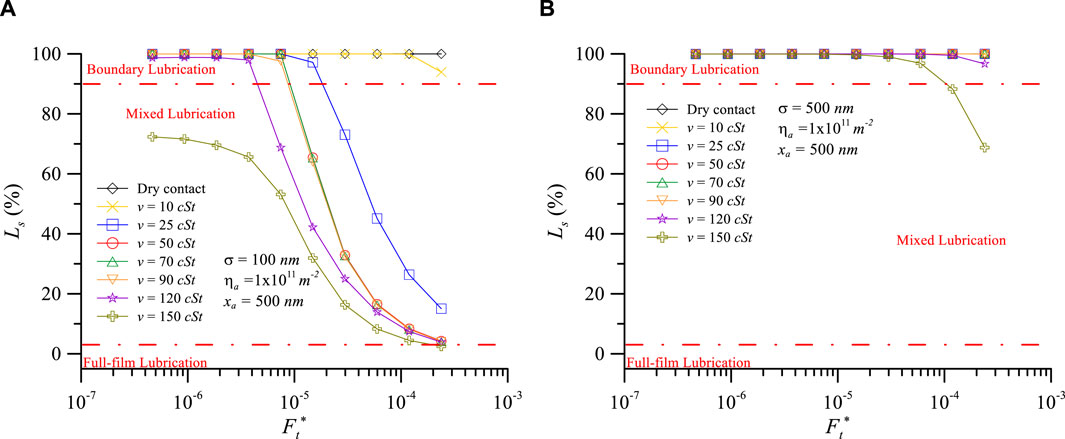
Figure 5. Load percentage of solid vs. dimensionless normal load at various viscosities of lubricant: (A) σ = 100 nm and (B) σ = 500 nm for xa = 500 nm, ηa = 1011m-2.
According to the results from Figure 4, when v = 90 cSt, the contact interface potentially encompasses three contact modes and three lubrication regimes (if the load further increases) with increasing load. Therefore, Figure 6 selects v = 90 cSt and considers the differences between lubricated contact and dry contact under different particle sizes. It is particularly important to note that when lubricating oil forms a film between the interfaces, the sequence of effects on At* due to changes in particle size is the opposite for lubricated contact compared to dry contact, which is explained as follows. The dry contact curve (dashed line) in Figure 6A shows that At* decreases with increase in the third particle size. This is because larger particles are more likely to separate the surfaces, with the load only borne by a few larger particles, resulting in At* being smaller than when xa = 0 nm. Figure 4A shows that as At* of the lubricated interface begins to decrease and move away from At* of dry contact, the interface enters the mixed lubrication regime. Therefore, as shown in Figure 6A, after the interface enters the mixed lubrication regime, At* increases with the particle size at higher loads (approximately Ft* > 5.96 × 10⁻⁵). As depicted in Figure 6B, Ls of dry contact (dashed line) remains 100% for all particle sizes. In lubricated contact, Ls decreases as the dimensionless normal load increases, and smaller particles require only a smaller load to transition the contact interface to the mixed lubrication regime. At a dimensionless normal load, Ls increases with particle size. When the interface of all particle sizes enters mixed lubrication (approximately Ft* > 10−4), a larger Ls implies more solid contact, resulting in Figure 6A transitioning to At* increasing with particle size at higher loads. Figure 6C illustrates that the Asa,t* of oil lubrication and dry contact almost overlap for Ls = 100%. The Asa,t* of lubrication contact is larger than dry contact when the interface enters mixed lubrication. This difference arises because the oil film supports the surfaces, reducing the contact of surface asperities as the load is shared by the oil film and most of the particles. This is also a reason why nanoparticles are added to lubricants to help surfaces asperities share the load and reduce surface wear.
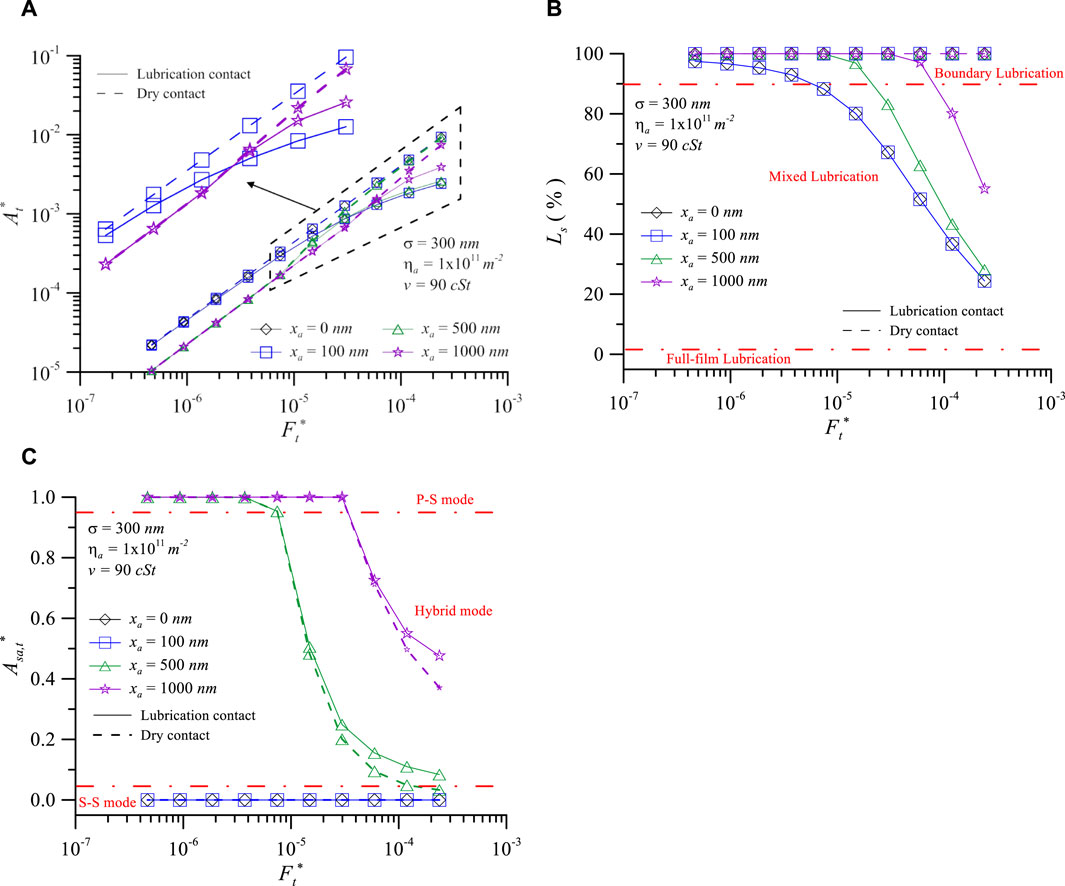
Figure 6. Contact characteristics vs, dimensionless normal load at various particle diameters: (A) dimensionless real contact area, (B) load percentage of solid, and (C) contact area ratio of particle for σ = 300 nm, ηa = 1011m-2, and v = 90 cSt.
The concentration of wear debris on the interface or concentration of added micro/nano particles in the lubricant will both affect the contact characteristics. Therefore, Figure 7 discusses the effect of particle density (ηa) on contact characteristics. Figure 7A shows that the At* of lubricated contact is similar to that of dry contact under small and medium dimensionless normal loads, and it decreases with increasing particle density. When Ft* > 5.0 × 10⁻⁵, At* transitions to increase with increasing particle density. It can be seen from Figure 7B that this change is caused by the transition of the lubrication regime from boundary to mixed. Figures 7B, C demonstrate that Ls and Asa,t* decrease with increasing dimensionless normal load, while they increase with increasing particle density.
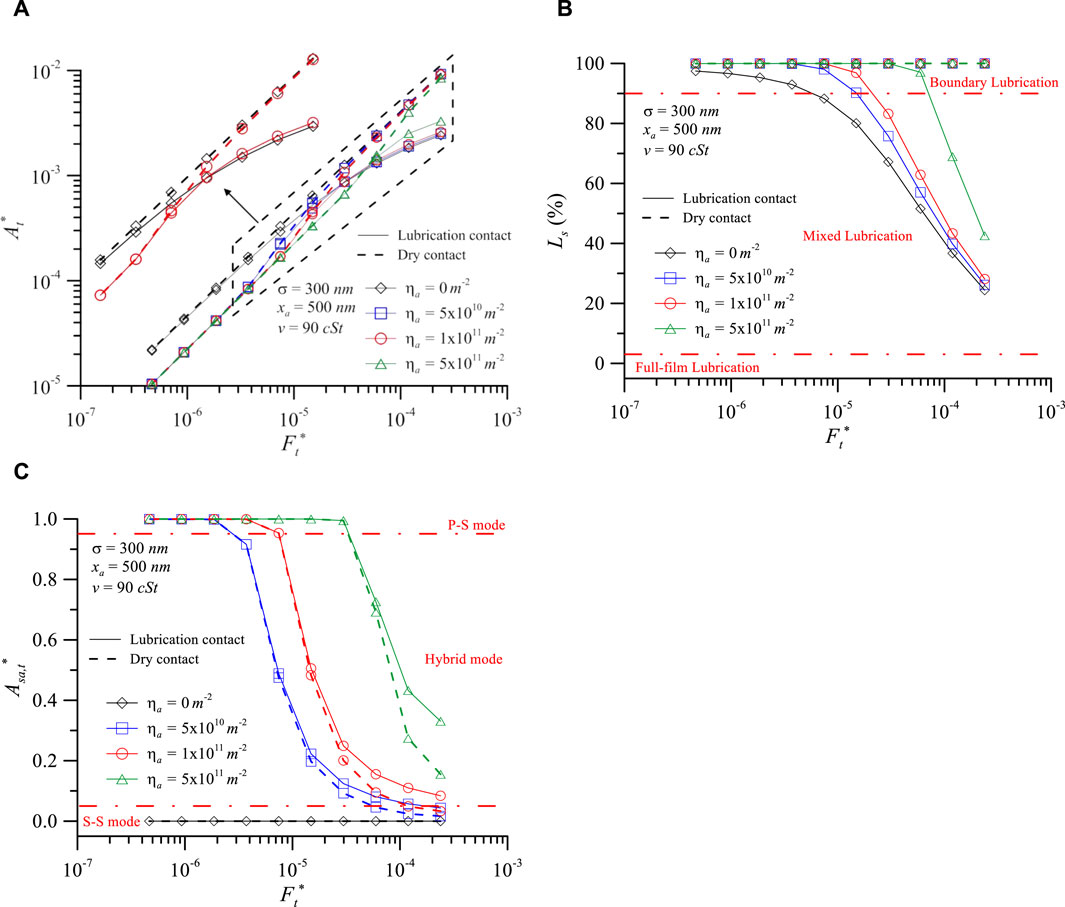
Figure 7. Contact characteristics vs. dimensionless normal load at various particle densities: (A) dimensionless real contact area, (B) load percentage of solid, and (C) contact area ratio of particle for σ = 300 nm, xa = 500 nm, v = 90 cSt.
Combining the results from Figures 4 and 7 in lubricated contact interfaces, whether it is water content, particle size, or concentration causing lubricant degradation, particularly with larger particle sizes and concentrations, it tends to transition the interface into 3-body boundary lubrication p-s mode. These result in a reduced total real contact area and increased particle contact pressure and temperature, leading to pitting and wear or causing excessive interface gaps; this can result in unstable precision during component operation. When particle sizes are too small and particle densities are too low, insufficient lubrication at the interface can lead to it being in the s-s mode. This results in excessive contact of surface asperities on the components, leading to even more wear. The total real contact area increases with increasing particle size and density when the lubricated interface is in a 3-body mixed lubrication regime. It is noteworthy that this exhibits a contrasting trend compared to previous studies conducted under dry contact (Chern et al., 2022) and boundary lubrication conditions. Additionally, in lubricated contact analysis, the percentage of solid load decreases with increased total normal load and exhibits a similar trend to the analysis of Masjedi and Khonsari (2015).
Figure 8 discusses the influence of surface roughness on interface contact characteristics, particularly the turning point of contact area (TPCA) phenomenon. Figure 8A shows that for all equivalent root mean square surface roughness, the At* of lubricated contact overlaps with that of dry contact at smaller loads. The reason for this is evident from Figure 8B, where it can be observed that the Ls values are 100% for all cases. Under dry contact conditions, when the interface is in the p-s mode, At* increases with increased surface roughness. However, as the interface mode transitions to near s-s mode with increasing load, At* decreases with increased surface roughness. Under lubricated contact conditions, when the interface is in mixed lubrication and approaching the s-s mode, the trend is opposite to that observed when in the s-s mode under dry contact conditions (Figure 8A∼C). Additionally, from Figure 8C for σ = 500 nm, it is apparent that Asa,t* exhibits a rise followed by a decrease as the load increases. This phenomenon is called “turning point of contact area” (TPCA) (Chern et al., 2022). The operating conditions under which TPCA occurs will be explored in Figures 9–13.
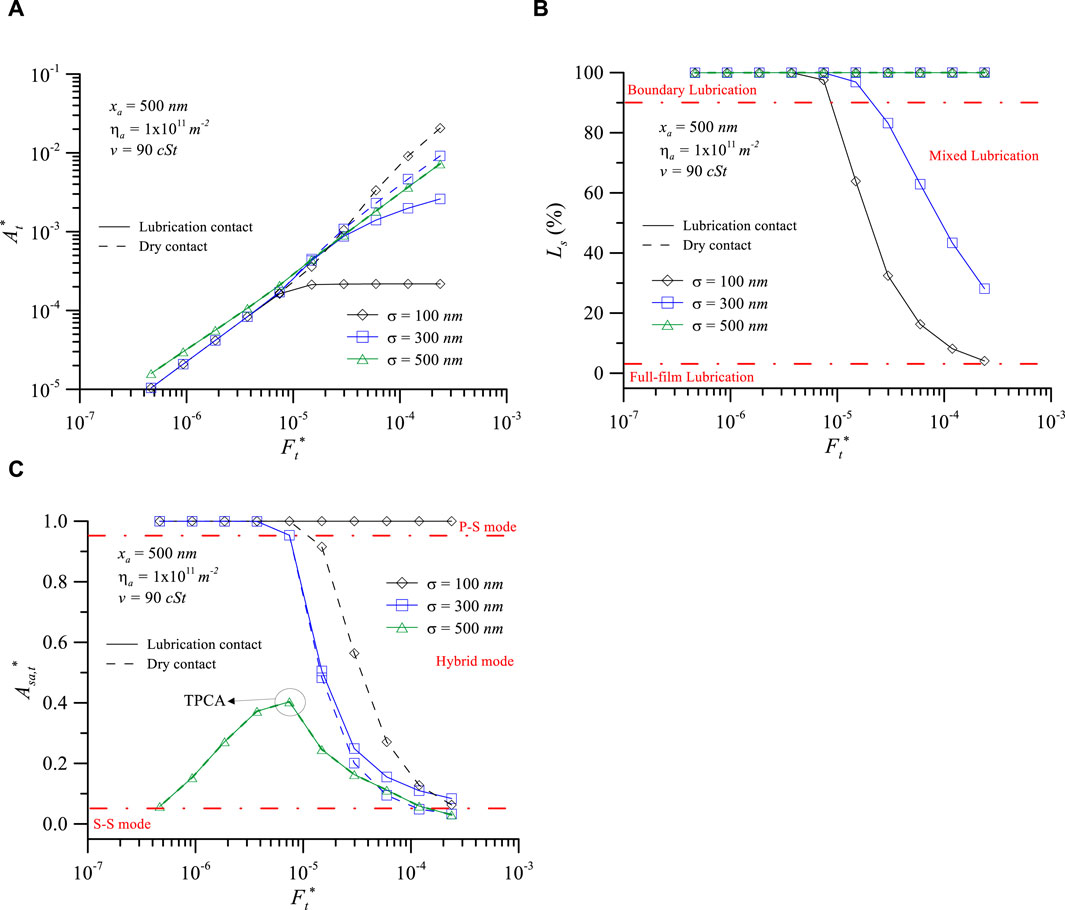
Figure 8. Contact characteristics vs. dimensionless normal load at differing surface roughness: (A) dimensionless real contact area, (B) load percentage of solid, and (C) contact area ratio of particle for xa = 500 nm, ηa = 1011m-2, v = 90 cSt.
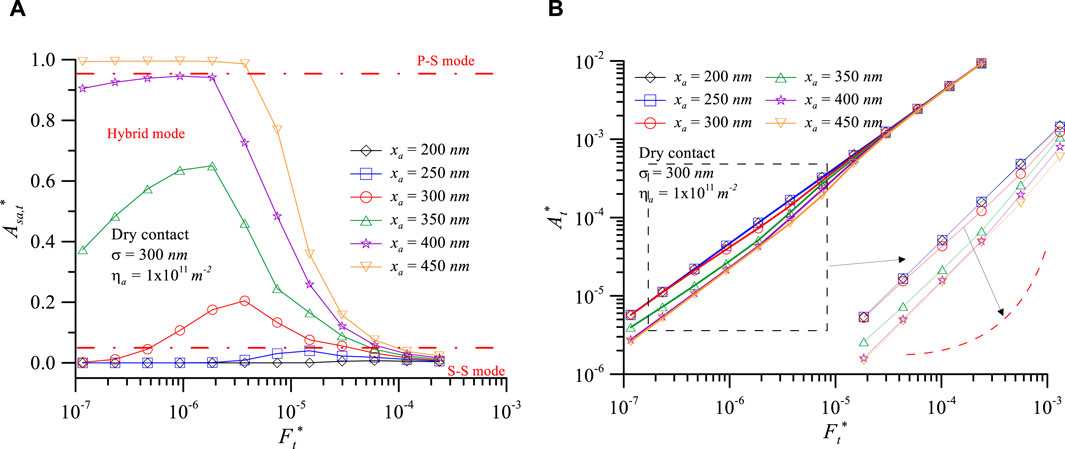
Figure 9. (A) Contact area ratio of particle and (B) dimensionless contact area vs. dimensionless normal load at various particle diameters under dry contact conditions for σ = 300 nm and ηa = 1011m-2.
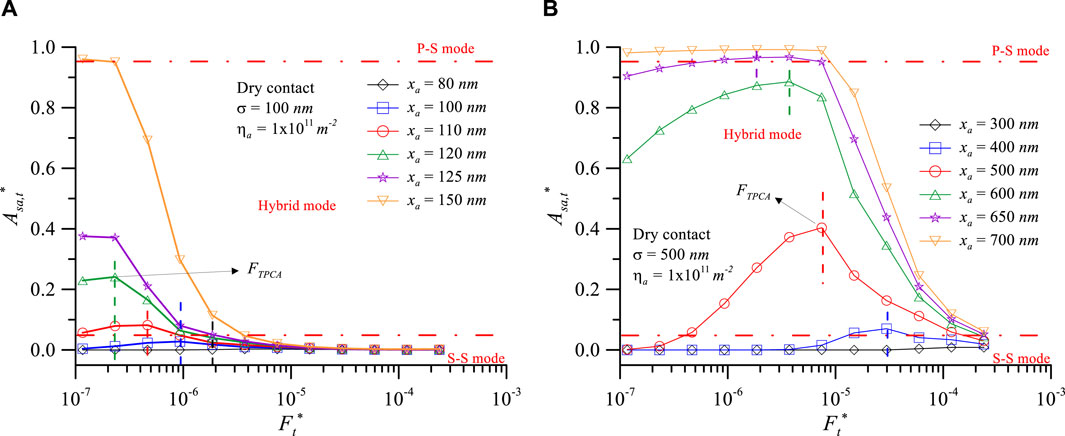
Figure 10. Contact area ratio of particle vs. dimensionless normal load at various particle diameters under dry contact conditions: (A) σ = 100 nm and (B) σ = 500 nm for ηa = 1011m-2.
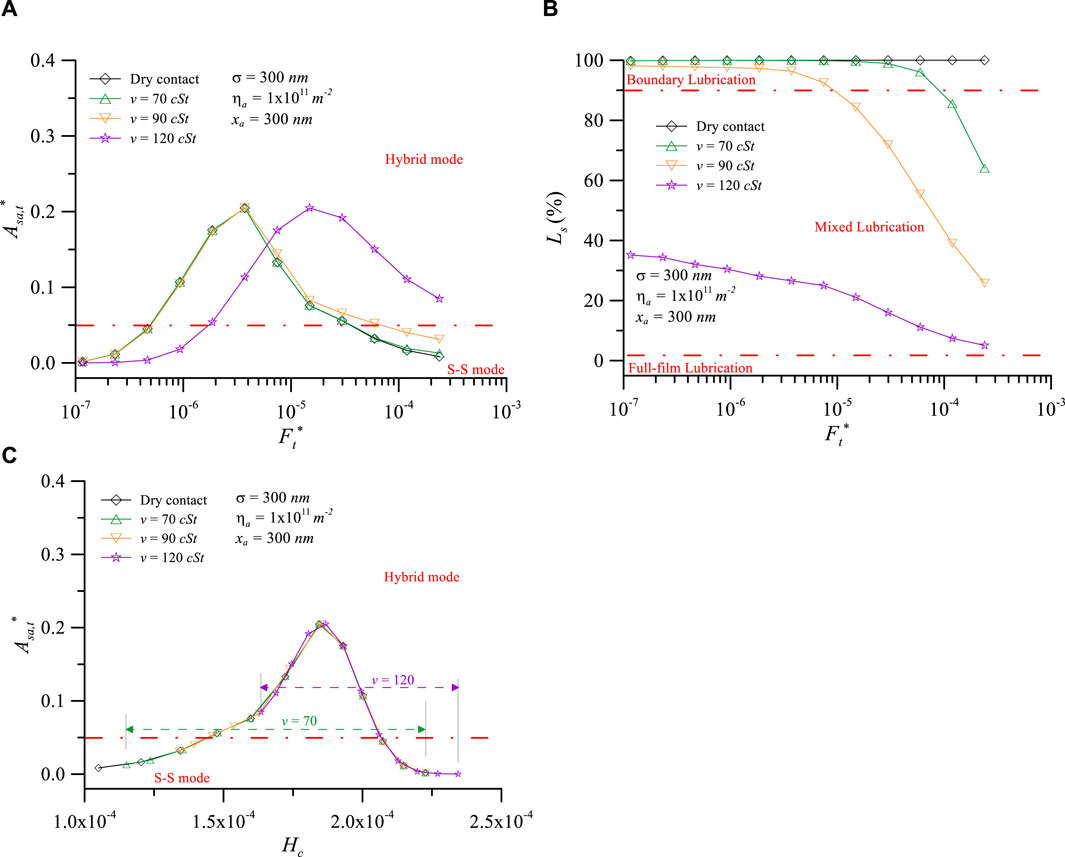
Figure 11. Contact characteristics vs. dimensionless normal load and dimensionless film thickness at various viscosities of lubricant: (A) contact area ratio of particle, (B) load percentage of solid, and (C) contact area ratio of particle for σ = 300 nm, xa = 300 nm, and ηa = 1011m-2.
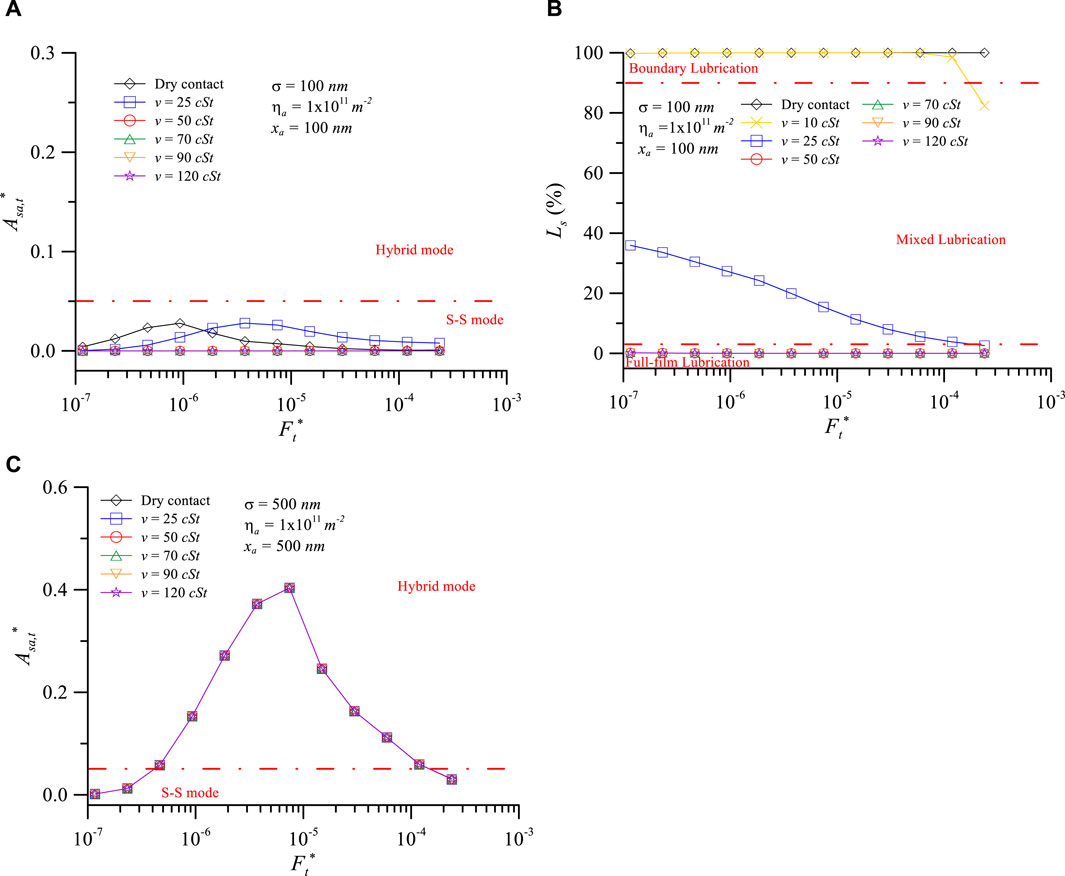
Figure 12. Contact characteristics vs. dimensionless normal load at various viscosities of the lubricant: (A) contact area ratio of particle, (B) load percentage of solid for σ = 100 nm, xa = 100 nm, and (C) contact area ratio of particle for σ = 500 nm, xa = 500 nm.
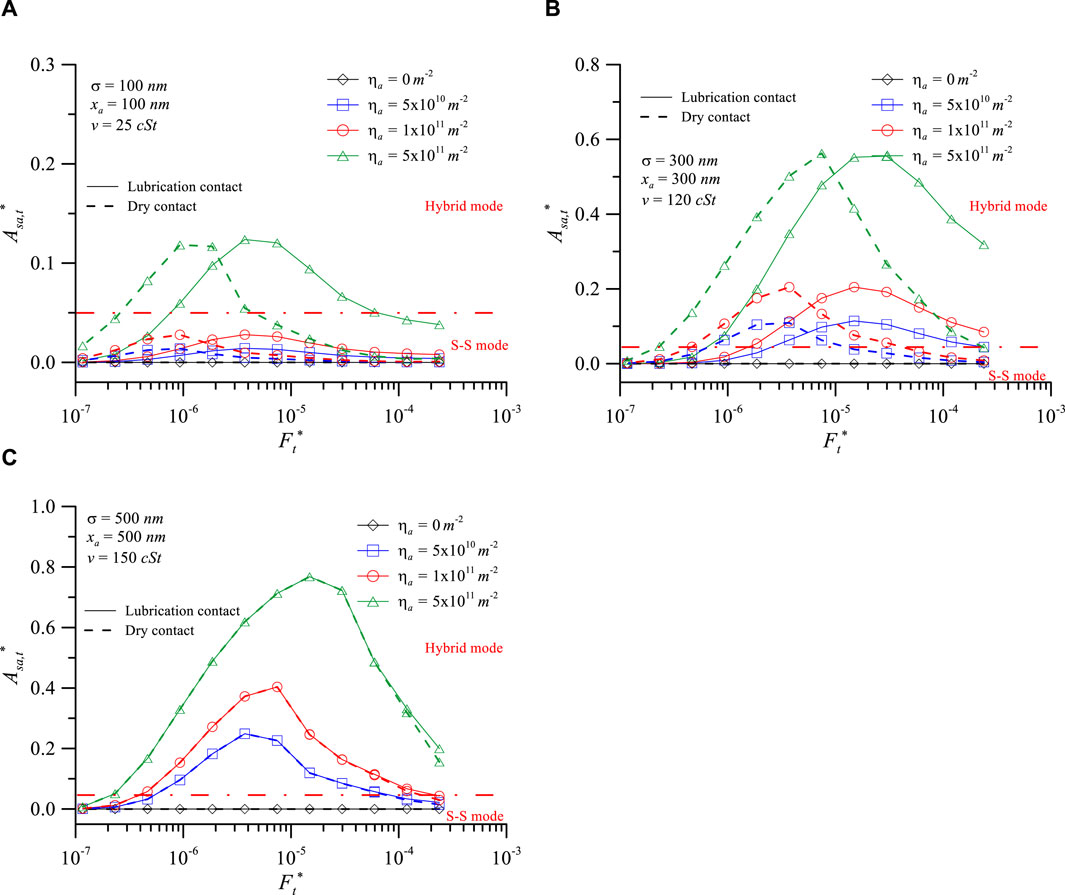
Figure 13. Panel contact area ratio of particle vs. dimensionless normal load at various particle densities: (A) σ = 100 nm, xa = 100 nm, v = 25 cSt, (B) σ = 300 nm, xa = 300 nm, v = 120 cSt, and (C) σ = 500 nm, xa = 500 nm, v = 150 cSt.
Figure 8 shows that the TPCA phenomenon occurs at xa = 500 nm and σ = 500 nm (xa/σ = 1.0). Therefore, Figure 9 investigates the range of xa/σ values where TPCA occurs for dry contact with σ = 300 nm. Figure 9A shows that the TPCA phenomenon occurs for particle sizes ranging from approximately 250–400 nm. Figure 9B illustrates that when the interface experiences TPCA, At* exhibits a variation characterized by an initial decrease followed by an increase with increasing dimensionless normal load, as indicated by the red dashed line in the figure. If the interface does not experience TPCA, it will enter the p-s contact mode at low dimensionless normal loads (e.g., xa = 350 nm). The results from Figure 9 indicate that the occurrence of the TPCA phenomenon occurs approximately within the range of xa/σ = 0.83–1.33 under σ = 300 nm and ηa = 1011 m-2. This phenomenon helps maintain the contact mode of the interface primarily in the hybrid mode, and the load is shared between the particles and the surface. This prevents the transition of the contact mode to the p-s mode, which would result in a relatively small At* and consequent excessively high real contact pressures in the contact area.
Figure 10 investigates the influence of different surface roughness on the xa/σ range for the occurrence of TPCA under dry contact conditions. Figure 10A shows that the TPCA phenomenon occurs approximately in the range of xa/σ = 0.80–1.20 when σ = 100 nm; for σ = 500 nm, it occurs in the range of xa/σ = 0.80–1.30 (Figure 10B). From Figures 9 and 10, it is apparent that TPCA occurs approximately in the range of xa/σ = 0.8–1.3, and the critical dimensionless normal load for TPCA (FTPCA*) decreases with the increase of xa/σ. Although the range of xa/σ values for TPCA occurrence is the same, the FTPCA* varies for differing surface roughness and particle sizes even when the xa/σ values are the same. Therefore, to achieve optimal load sharing between particles and surfaces in actual situations, it is still necessary to coordinate surface roughness to control the size of debris or micro/nanoparticles.
Figure 11 investigates the influence of lubricant kinematic viscosity on TPCA when xa = 300 nm and σ = 300 nm (xa/σ = 1.0). Under these conditions, the contact characteristic curves for v = 25 and 50 cSt overlap with dry contact and are therefore not shown in there. Figure 11A shows that when v < 90 cSt, FTPCA* is almost the same (FTPCA* = 3.27 × 10⁻⁶). Ls can be observed as the interface is in the boundary lubrication regime at this critical load (Figure 11B), indicating that viscosity has little effect on TPCA at this stage. The FTPCA* = 1.49 × 10⁻⁵ when v = 120 cSt; the interface has entered mixed lubrication at this viscosity. These results indicate that when the interface enters the mixed lubrication regime, a larger dimensionless normal load is required to induce TPCA. Furthermore, it can be observed from Figure 11A that viscosity does not affect the maximum value of Asa,t*. The maximum value of Asa,t* remains approximately 0.20 across all viscosities. The reason for this can be observed from Figure 11B, where at v = 120 cSt with FTPCA* = 1.49 × 10⁻⁵, Ls = 21.1%. The real dimensionless normal load borne by the solid (1.49 × 10−5 × 21.1% = 3.14 × 10⁻⁶) is comparable with that of dry contact (FTPCA* = 3.27 × 10⁻⁶). Furthermore, as depicted in Figure 11C, different viscosities and total loads result in different Hc values (for v = 70 cSt, Hc = 1.15 × 10⁻⁴-2.23 × 10⁻⁴; for v = 120 cSt, Hc = 1.63 × 10⁻⁴-2.34 × 10⁻⁴). However, it is evident that Asa,t* values remain on the same curve. This illustrates that the occurrence of the TPCA phenomenon is primarily determined by the real load borne by the solid. As long as the total load increases to make the real load borne by the solid equivalent to that in dry contact, the increase in lubricant viscosity will still lead to the occurrence of TPCA at the interface.
Figure 12 shows the contact characteristics versus dimensionless normal load at various viscosities of lubricant (A) Asa,t* (B) Ls for σ = 100 nm, xa = 100 nm (C) Asa,t* for σ = 500 nm, xa = 500 nm. Figure 12A demonstrates that as the viscosity increases, larger loads are required for the occurrence of TPCA, like in Figure 11. However, Asa,t* equals 0 after the viscosity reaches 50 cSt, so the TPCA phenomenon is no longer observed. This is primarily evident from Figure 12B, where Ls drops to 0% after viscosity reaches 50 cSt, indicating that the interface has entered the full-film lubrication regime with no solid contact at all. In Figure 12C for σ = 500 nm and xa = 500 nm, it can be clearly observed that regardless of the viscosity variation, the values of Asa,t* almost overlap, and the FTPCA* values are the same. The reason for this is evident from the Ls values under the same conditions in Figure 5B, where it can be observed that when the dimensionless normal load is less than 6 × 10⁻⁵, the Ls values are all 100% for all viscosities. Therefore, viscosity does not affect the occurrence of TPCA under these conditions.
Influence of particle density on TPCA at xa/σ = 1.0. In the analyses of Figures 13A, 13B, and 13C, different lubricant kinematic viscosities of 25, 120, and 150 cSt are, respectively, employed, primarily considering the more significant variations in Asa,t* caused by lubricant viscosity under different surface roughness conditions. Figure 13A shows that for σ = 100 nm, ηa has little effect on the FTPCA* value, which remained approximately 4 × 10⁻⁶ for different viscosities. Figure 13B shows that for σ = 300 nm, the FTPCA* value increases from 1.5 × 10⁻⁵ to 3.0 × 10⁻⁵ when ηa increases to 5 × 10¹¹ m–2. Figure 13C clearly shows that for σ = 500 nm, the FTPCA* value increases with increasing ηa. The results from Panel indicate that as σ increases, the trend of FTPCA* increases with increasing ηa becoming more pronounced. The analysis results from Figures 9–13 collectively indicate that FTPCA* decreases with increasing xa but increases with increasing v and ηa. Under the same xa/σ ratio, both Asa,t* and FTPCA* values increase with increasing σ.
4 Conclusion
Particles existing at the lubricated contact interface are typical in the actual operating conditions of moving components. As operating time increases, lubricant degradation leads to changes in viscosity. We studied the interfacial contact characteristics (load percentage of solid, film thickness, and real contact area) of 3-body lubricated surfaces under various lubricant viscosities, surface roughness, particle sizes, and concentrations. The conclusions drawn from this study are as follows:
1. In the three-body mixed lubrication interface, the dimensionless total real contact area increases with increased particle size and density at the same lubricant viscosity. However, the trend is opposite in the dry contact and boundary lubrication interfaces. This is because larger particles are more likely to separate the surfaces, with the load only borne by a few larger particles. Therefore, the total real contact area will change to decrease with the increase in particle size and density.
2. In a 3-body contact interface, the reduction in lubricant viscosity more readily transitions the interface into boundary lubrication than 2-body contacts.
3. The larger the particle size and concentration, the more likely the interface will enter the boundary lubrication p-s 3-body contact mode. This will result in more wear on the contact interface.
4. If the load percentage of solid to lubricant is used to define the lubrication regime and the initial interface is boundary lubrication in the p-s 3-body contact mode, then with increasing load, the evolution of the lubrication interface is thus: boundary lubrication in the p-s 3-body contact mode → boundary lubrication in the hybrid 3-body contact mode → mixed lubrication in the hybrid 3-body contact mode → mixed lubrication in the s-s 3-body contact mode → full-film lubrication in the s-s 3-body contact mode.
5. The TPCA phenomenon typically occurs at xa/σ = 0.8–1.3 and contributes to maintaining the contact mode of the interface primarily in the hybrid mode. In both dry and lubricated contact conditions, if the interface can be controlled within this range, the interface will be in a hybrid or mixed lubrication hybrid mode. The load is shared among particle-to-surface, surface-to-surface, and fluid. It prevents the transition of the contact mode to the p-s mode, which would result in a relatively small contact area and consequent excessively high real contact pressures in the contact area. This will help reduce wear on the surface asperities of components, extending their service life. Therefore, to achieve optimal load sharing between particles and surfaces in actual situations, it is still necessary to coordinate surface roughness to control the size of debris or micro/nanoparticles.
6. TPCA is primarily determined by the real normal load borne by the solid. When the viscosity of the lubricant increases, as long as the total load increases to the point where the real normal load borne by the solid reaches the critical load for TPCA to occur, TPCA will still occur at the interface.
7. FTPCA* decreases with increasing particle size but increases with increasing lubricant viscosity and particle density. Under the same xa/σ ratio, both contact area ratio between surface with particles and FTPCA* values increase with increasing RMS surface roughness.
Theoretical analysis, in this paper, suggests that if relevant parameters (such as lubricant viscosity, particle size, and concentration) can be captured by online monitoring and analyzed, there could be real-time understanding of the component’s contact interface condition. This can help prevent unexpected damage and downtime, which can lead to decreased productivity and increased costs. It also allows for adjusting appropriate oil change intervals based on the system’s condition, reducing wastage of lubricating oil.
Influence of particle density on TPCA at xa/σ = 1.0. In the analyses of Panel A, 13B, and 13C, different lubricant kinematic viscosities of 25, 120, and 150 cSt are, respectively, employed, primarily considering the more significant variations in Asa,t* caused by lubricant viscosity under different surface roughness conditions.
Data availability statement
The raw data supporting the conclusion of this article will be made available by the authors, without undue reservation.
Author contributions
Y-YC: data curation, formal analysis, investigation, methodology, project administration, software, validation, visualization, writing–original draft, and writing–review and editing. JH: conceptualization, formal Analysis, funding acquisition, investigation, project administration, resources, supervision, writing–original draft, and writing–review and editing.
Funding
The author(s) declare that financial support was received for the research, authorship, and/or publication of this article. This research was supported by the National Science and Technology Council, Taiwan (R.O.C.), under grants MOST 110-2221-E-150-015-MY3 and NSTC 112-2622-E-150-010-, as well as National Formosa University, Taiwan (R.O.C.).
Conflict of interest
The authors declare that the research was conducted in the absence of any commercial or financial relationships that could be construed as a potential conflict of interest.
Publisher’s note
All claims expressed in this article are solely those of the authors and do not necessarily represent those of their affiliated organizations, or those of the publisher, the editors, and the reviewers. Any product that may be evaluated in this article, or claim that may be made by its manufacturer, is not guaranteed or endorsed by the publisher.
References
Abass, B. A., and Mahdi, M. A. (2023). Effect of microridges on the performance of three-lobe journal bearing considering cavitation and lubricant compressibility. Tribol. Mater. 2 (4), 189–200. doi:10.46793/tribomat.2023.016
Ali, F. (2020). Numerical study on subsurface stress in Hertzian contacts under pure sliding conditions. J. Appl. Comput. Mech. 6, 1098–1106. doi:10.22055/jacm.2019.31511.1882
Assenova, E., and Vencl, A. (2022). Tribology and self-organization in reducing friction: a brief review. Tribol. Mater. 1 (1), 35–41. doi:10.46793/tribomat.2022.005
Brhane, A. G., and Mekonone, S. T. (2023). Numeric simulation of steel twin disc system under rolling-sliding contact. Tribol. Mater. 2 (4), 181–188. doi:10.46793/tribomat.2023.019
Bukvić, M., Gajević, S., Skulić, A., Savić, S., Ašonja, A., and Stojanović, B. (2024). Tribological application of nanocomposite additives in industrial oils. Lubricants 12 (1), 6. doi:10.3390/lubricants12010006
Chern, S. Y., Chen, Y. Y., Liu, W. L., and Horng, J. H. (2022). Contact characteristics at interface in three-body contact conditions with rough surfaces and foreign particles. Lubricants 10, 164. doi:10.3390/lubricants10070164
Devo, T., Beaurain, A., Deletombe, E., and Desplanques, Y. (2024). Study of the wear process in an experimental simulation of a fuselage/runway rubbing contact. Tribol. Mater. 3(1):1–14. doi:10.46793/tribomat.2024.003
Gamonpilas, C., Benyajati, C., Sritham, W., Soparat, J., Limprayoon, N., Seetapan, N., et al. (2022). Roles of viscosity, applied load and surface wettability on the lubrication behaviour of model liquid/semi-solid foods: measurements with a bespoke tribo-cell fixture and rotational rheometer. Curr. Res. Nutr. Food Sci. 5, 57–64. doi:10.1016/j.crfs.2021.12.009
Ghanbarzadeh, A., Wilson, M., Morina, A., Dowson, D., and Neville, A. (2016). Development of a new mechano-chemical model in boundary lubrication. Tribol. Int. 93, 573–582. doi:10.1016/j.triboint.2014.12.018
Gheisari, R., and Polycarpou, A. A. (2018). Three-body abrasive wear of hard coatings: effects of hardness and roughness. Thin Solid Films 666, 66–75. doi:10.1016/j.tsf.2018.07.052
Godet, M. (1984). The third-body approach: a mechanical view of wear. Wear 100 (1-3), 437–452. doi:10.1016/0043-1648(84)90025-5
Gopaul, K., Venkanna, S., and Dauhoo, M. Z. (2022). Wear and flow rate problems on chutes in a rock crushing plant. Tribol. Mater. 1 (4), 128–137. doi:10.46793/tribomat.2022.016
Greenwood, J. A. (2020). Metal transfer and wear. Front. Mech. Eng. 6, 62. doi:10.3389/fmech.2020.00062
Hei, D., Zheng, M., Liu, C., Jiang, L., Zhang, Y., and Zhao, X. (2023). Study on the frictional properties of the top ring-liner conjunction for different-viscosity lubricant. Adv. Mech. Eng. 15 (2), 168781322311550–13. doi:10.1177/16878132231155002
Horng, J. H., Lee, J. S., and Du, D. C. (2006). Three-body microcontact model of rough surfaces and its application on polishing of wafer. Mater. Sci. Forum. 505-507, 445–450. doi:10.4028/www.scientific.net/MSF.505-507.445
Horng, J. H., Lin, J. F., and Li, K. Y. (1995). Effect of surface roughness on steel roller scuffing. Wear 184 (2), 203–212. doi:10.1016/0043-1648(94)06574-8
Horng, J. H., Yu, C. C., and Chen, Y. Y. (2022). Tribological characteristics and load-sharing of point-contact interface in three-body mixed lubrication. J. Tribol-T ASME 144, 052201. doi:10.1115/1.4052964
Horng, J. H., Yu, C. C., and Chen, Y. Y. (2023). Effect of third-particle material and contact mode on tribology contact characteristics at interface. Lubricants 11, 184. doi:10.3390/lubricants11040184
Jensen, J. S. K., and Aghababaei, R. (2023). Experimental investigation of three-body wear for rubber seals in abrasive slurry environment. Wear 534-535, 205131–535. doi:10.1016/j.wear.2023.205131
Kandeva, M., Kalitchin, Z., Zadorozhnaya, E., and Vencl, A. (2022). Performance characteristics of lubricant based on rapeseed oil containing different amounts of metal-containing additive. Ind. Lubr. Tribol. 74 (3), 309–315. doi:10.1108/ILT-07-2021-0259
Koulocheris, D., Stathis, A., Costopoulos, Th., and Gyparakis, G. (2013). Comparative study of the impact of corundum particle contaminants size on wear and fatigue life of grease lubricated ball bearings. Mod. Mech. Eng. 3, 161–170. doi:10.4236/mme.2013.34023
Li, Y., Schreiber, P., Schneider, J., and Greiner, C. (2023). Tribological mechanisms of slurry abrasive wear. Friction 11, 1079–1093. doi:10.1007/s40544-022-0654-1
Liang, X. M., Xing, Y. Z., Li, L. T., Yuan, W. K., and Wang, G. F. (2021). An experimental study on the relation between friction force and real contact area. Sci. Rep. 11, 20366. doi:10.1038/s41598-021-99909-2
Masjedi, M., and Khonsari, M. M. (2015). On the effect of surface roughness in point-contact EHL: formulas for film thickness and asperity load. Tribol. Int. 82 (A), 228–244. doi:10.1016/j.triboint.2014.09.010
Miftakhova, A., Chen, Y. Y., and Horng, J. H. (2019). Effect of rolling on the friction coefficient in three-body contact. Adv. Mech. Eng. 11 (9), 168781401987230–9. doi:10.1177/1687814019872303
Oila, A., and Bull, S. J. (2005). Assessment of the factors influencing micropitting in rolling/sliding contacts. Wear 258 (10), 1510–1524. doi:10.1016/j.wear.2004.10.012
Peterson, M. B., and Winer, W. O. (1980). Wear control handbook. American Society of Mechanical Engineers.
Popov, V. L. (2018). Is tribology approaching its golden age? Grand challenges in engineering education and tribological research. Front. Mech. Eng. 4, 16. doi:10.3389/fmech.2018.00016
Soltanahmadi, S., Morina, A., van Eijk, M. C. P., Nedelcu, I., and Neville, A. (2017). Tribochemical study of micropitting in tribocorrosive lubricated contacts: the influence of water and relative humidity. Tribol. Int. 107, 184–198. doi:10.1016/j.triboint.2016.11.031
Sun, J., Yang, J., Yao, J., Tian, J., Xia, Z., Yan, H., et al. (2022). The effect of lubricant viscosity on the performance of full ceramic ball bearings. Mater. Res. Express 9, 015201. doi:10.1088/2053-1591/ac4881
Terwey, T. J., Fourati, M. A., Pape, F., and Poll, G. (2020). Energy-based modelling of adhesive wear in the mixed lubrication regime. Lubricants 8 (2), 16. doi:10.3390/lubricants8020016
Torrance, A. A. (2005). Modelling abrasive wear. Wear 258 (1-4), 281–293. doi:10.1016/j.wear.2004.09.065
Tsai, F. C. (2024). An investigation into the grinding characteristics and wear evolution of micro-elastic composite grinding pads. J. Manuf. Sci. Eng. 146 (4), 041005. doi:10.1115/1.4064627
Vanossi, A., Bechinger, C., and Urbakh, M. (2020). Structural lubricity in soft and hard matter systems. Nat. Commun. 11, 4657. doi:10.1038/s41467-020-18429-1
Wang, G., Wang, W., Zhang, Y., Shen, J., Xu, J., and Liu, K. (2022). A solution for mixed elastohydrodynamic lubrication modeling considering effects of solid particles and surface roughness. Proc. Inst. Mech. Eng. J-J. Eng. Tribol. 236 (11), 2272–2282. doi:10.1177/13506501221077777
Wang, T., Yan, Q., Xiong, Q., Lin, J., Lu, J., and Pan, J. (2024). Effect of abrasive on tribological behavior and polishing effect of β-Ga2O3(100) substrate. Mater. Sci. Semicond. Process. 172, 108059. doi:10.1016/j.mssp.2023.108059
Winter, H., and Weiss, T. (1981). Some factors influencing the pitting, micro-pitting (frosted areas) and slow speed wear of surface hardened gears. J. Mech. Des. 103 (2), 499–505. doi:10.1115/1.3254945
Zambrano, O. A., Muñoz, E. C., Rodríguez, S. A., and Coronado, J. J. (2020). Running-in period for the abrasive wear of austenitic steels. Wear 452-453, 203298. doi:10.1016/j.wear.2020.203298
Zhang, S., Yan, Z., Liu, Z., Jiang, Y., Sun, H., and Wu, S. (2023). Experimental and numerical study of the mixed lubrication considering boundary film strength. Materials 16, 1035. doi:10.3390/ma16031035
Zhao, Y., Maietta, D. M., and Chang, L. (2000). An asperity microcontact model incorporating the transition from elastic deformation to fully plastic flow. J. Tribol-T ASME 122 (1), 86–93. doi:10.1115/1.555332
Zhu, D., Wang, J., Ren, N., and Wang, Q. J. (2012). Mixed elastohydrodynamic lubrication in finite roller contacts involving realistic geometry and surface roughness. J. Tribol-T ASME 134 (1), 011504. doi:10.1115/1.4005952
Zhu, D., and Wang, Q. J. (2013). On the lambda ratio range of mixed lubrication. Proc. Inst. Mech. Eng. J-J. Eng. Tribol. 226 (12), 1010–1022. doi:10.1177/1350650112461867
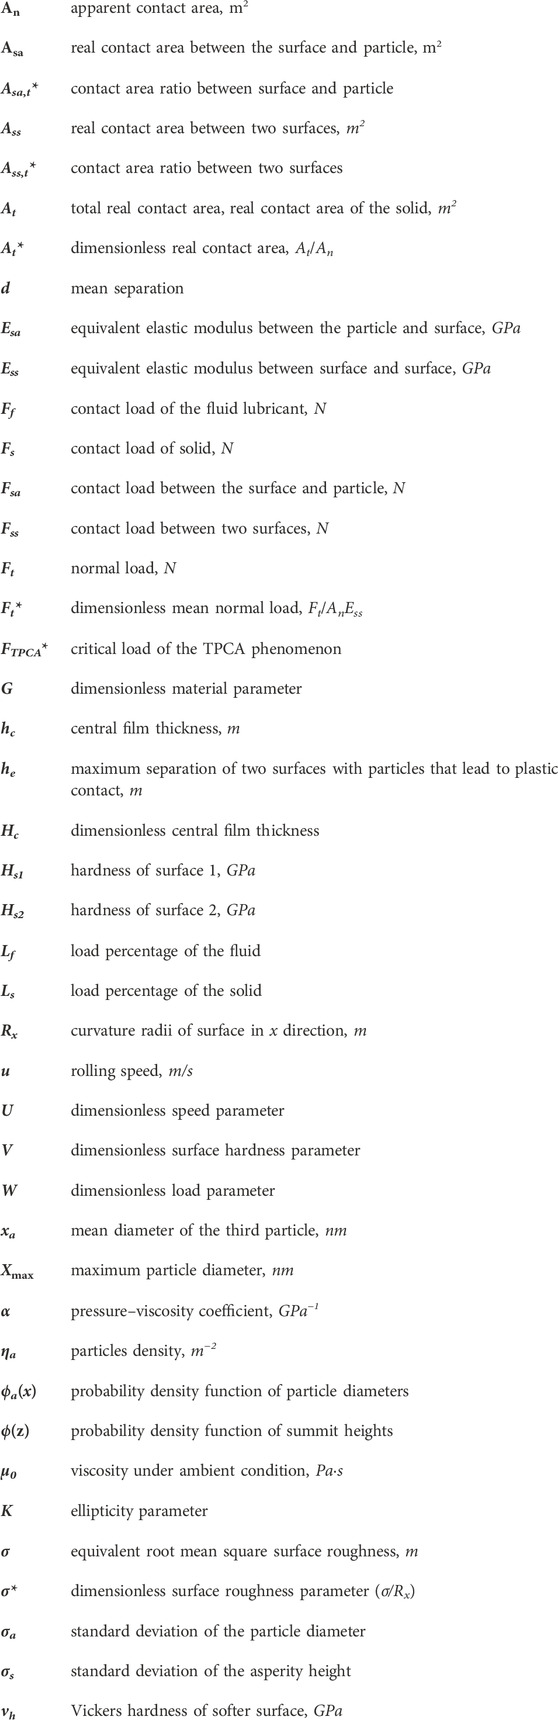
Nomenclature
Keywords: third particle, three-body contact, real contact area, solid load percentage, film thickness
Citation: Chen Y-Y and Horng J-H (2024) Investigation of lubricant viscosity and third-particle contribution to contact behavior in dry and lubricated three-body contact conditions. Front. Mech. Eng 10:1390335. doi: 10.3389/fmech.2024.1390335
Received: 23 February 2024; Accepted: 04 April 2024;
Published: 07 May 2024.
Edited by:
Blaža Stojanović, University of Kragujevac, SerbiaReviewed by:
Milan Bukvic, University of Kragujevac, SerbiaAleksandar Vencl, University of Belgrade, Serbia
Copyright © 2024 Chen and Horng. This is an open-access article distributed under the terms of the Creative Commons Attribution License (CC BY). The use, distribution or reproduction in other forums is permitted, provided the original author(s) and the copyright owner(s) are credited and that the original publication in this journal is cited, in accordance with accepted academic practice. No use, distribution or reproduction is permitted which does not comply with these terms.
*Correspondence: Jeng-Haur Horng, amhob3JuZ0BnbWFpbC5jb20=