 Zhe Liu
94% of researchers rate our articles as excellent or good
Learn more about the work of our research integrity team to safeguard the quality of each article we publish.
Find out more
ORIGINAL RESEARCH article
Front. Mech. Eng. , 20 June 2024
Sec. Fluid Mechanics
Volume 10 - 2024 | https://doi.org/10.3389/fmech.2024.1372010
Introduction: As an advanced agricultural technology equipment, the functional integration design and appearance aerodynamic characteristics of hexacopter agricultural UAV are significant for improving the efficiency of agricultural production.
Methods: Firstly, the study carried out the functional integration design of the hexacopter agricultural UAV, and completed the matching analysis and selection of the relevant components of the power system. Then, the numerical simulation method of computational fluid dynamics was used to analyze the aerodynamic characteristics of the UAV. Finally, the role of different propeller pitch on important parameters such as lift and range time of the UAV was verified.
Results and discussion: The results showed that in the XY section of the UAV, namely, the surface parallel to the flight direction, the areas with high streamline velocity were mainly concentrated at the intersection of the airflow with the landing gear and the motor. The streamlines in the front of the UAV were tightly and neatly distributed, while those in the rear were sparser. The motor force efficiencies of the UAVs with different propeller pitches ranged from 7.05 to 7.25 g/w. At a flight speed of 5 m/s, the motor force effect of the UAV with a pitch of 260 mm reached 7.25 g/w, which was the highest value among all models. Meanwhile, it had the longest endurance time of 19.14 min, indicating the best performance. The results suggested that it not only promoted the modernization of agricultural UAVs but also effectively enhanced the efficiency of agricultural production.
Unmanned aerial vehicle (UAV) technology has been advancing steadily along with science and technology’s constant advancement, and the use of UAVs in agriculture has been growing recently (Zhu et al., 2020). Due to its straightforward design, excellent stability, and large load capacity, the hexacopter unmanned aerial vehicle (HUAV) is one type of UAV that is frequently utilized in the agricultural industry (Wang et al., 2021). Therefore, analyzing and studying the functionally integrated design (FID) of hexacopter agricultural unmanned aerial vehicle (HAUAV) and its appearance aerodynamic characteristics (AC). It is important for improving the efficiency and quality of agricultural production. Traditional HAUAV design methods are usually based on empirical design and simulation experiments. Designers usually evaluate and design the structure, function and performance of UAVs based on mission requirements and actual application scenarios (Ko and Lee, 2021). Nevertheless, the conventional HAUAV design approach has found it challenging to keep up with the demands of contemporary agriculture due to the ongoing advancements in science and technology as well as the growth of UAV application fields (Didane et al., 2022). To solve this problem, the study introduces computational fluid dynamics (CFD) and uses this method to numerically simulate and analyze the aerodynamic performance of the UAV in order to find out the optimal aerodynamic layout scheme. The study is divided into four main sections. The first section provides a summary of the rotorcraft’s AC and CFD techniques. The second section analyzes the FID of HAUAV and its appearance AC. Among them, the overall FID of HAUAV is presented in Section 1. In Section 2, the CFD method is introduced for numerical simulation and the Renormalization Group k-ε model in Reynolds number averaging, referred to as RNG k-ε, is used as turbulence models (TM), and the iterative method employs the SIMPLE algorithm. Part III analyzes the numerical simulation on the AC of UAV. Part IV summarizes and discusses the experimental results and presents the future outlook.
The study of AC is important for the optimal design of rotorcraft. To solve the complex flow problem of helicopter tail rotor under low-speed side winds, researchers such as Verma and Baloni (2022) conducted numerical simulation studies on helicopters with culvert fan tail rotor systems. The findings demonstrated that, while having more directional stability, the main rotor and left-wing wake flow have a greater impact on the aerodynamic performance of the culvert fan tail rotor. Ignatkin et al. (2020) addressed the problem of flow field characterization of a quadrotor in helicopter mode by using the CFD method of unstructured mesh sliding mesh technique and the experimental method of aerodynamic interference. The results showed that the interference between the front and rear rotors was insignificant, but the interference between the rotor and the wing was large. To better solve the complex interference problem between the front and rear rotors of a longitudinal helicopter, researchers such as MAKEEV et al. (2021) proposed a numerical study method based on the momentum source model and the N-S equations with the choice of the k-ω SST two-equation TM and the implicit pressure-based solver. The results indicated that the rotor performance of both the front and rear rotors decreased during hovering, and the rear rotor had a greater effect on the front rotor performance. Jinghui et al. (2019) used numerical methods to calculate the AC of rigid co-axial rotor in typical states for a high-speed helicopter in hovering and forward flight. The findings demonstrated that, in the forward flying state, the rotor lift-to-drag ratio rises and then falls in tandem with increases in the advanced ratio and lift bias. Additionally, an increase in lift bias causes a corresponding rise and then fall in the lift-to-drag ratio. Ma et al. addressed the problem of the effect of synthetic jet control on rotor AC by proposing the use of special blades with frame-covered structures and synthetic jet actuators. The results showed that the jet closer to the leading edge and the jet angle of 90° are favorable to improve the AC.
CFD has several uses in the realm of UAVs, and it can assist designers in optimizing their designs to enhance control accuracy and performance. Lei and Cheng (2020) suggested using CFD to create a CFD model that predicts the downwash airflow inside the canopy of UAV sprayers in response to the paucity of study on this topic. The findings demonstrated that while none of the five parameters alone can control airflow velocity inside the canopy, they all have a significant impact. ElGhazali and Dol (2020) proposed a numerical simulation method to investigate the effects of aerodynamic performance, wake structure and sound pressure level for the problem of rotor interaction of a multi-rotor vehicle in hovering condition. The results showed that as the rotor pitch decreases, the mean thrust decreases significantly and the thrust fluctuation increases significantly. The flight performance of a small multi-rotor UAV can be affected by wind disturbances, as discovered by Park et al. (2021). They studied wind simulation techniques using power spectral density function, CFD, and probabilistic modeling by means of generating wind disturbances in simulation. The findings demonstrated that the suggested method’s investigation can significantly enhance the multirotor small UAV’s flying performance. Pinti et al. (2022) addressed the spray drift problem of multi-rotor UAVs in plant protection applications by proposing to study the effect of downwash airflow through CFD simulation. A discrete phase model was used to simulate the motion of droplet particles and the simulation was analyzed using actual repeated experimental parameters. The results showed that the downwash distribution below the rotor varies depending on the flight inclination. Vijayanandh’s team proposed a method that combines experimental data with CFD modeling for the evaluation of rotor thrust and power curves for small multicopter unmanned UAV systems (Vijayanandh et al., 2022).
In summary, researchers and scholars, both domestic and foreign, have conducted numerous studies on the AC of rotary-wing UAV and the application of CFD methods. However, few studies have utilized CFD methods to analyze the AC of rotary-wing UAVs. Therefore, this study introduces the CFD method for numerical simulation analysis of HAUAV and adopts the corresponding turbulence model and iterative method to analyze the AC. The study aims to provide a reference for UAV design. The contribution of this study lies in the introduction of CFD, an advanced method, to analyze the aerodynamic characteristics of a six rotor agricultural drone. Taking into account various factors such as flight speed, fairing, lift coefficient, and pull coefficient, a comprehensive evaluation of the flight performance of drones and optimization of design parameters can help improve their flight efficiency and stability. It is expected to promote the development of drone technology in the agricultural field.
In this chapter, the overall design objectives are firstly set for the FID of HAUAV, and the matching analysis and selection of power system related components are completed. Then the CFD method is introduced for numerical simulation, and the RNG k-ε model in Reynolds number averaging is used as the TM, and the iterative method is calculated by the simple algorithm in order to realize the AC analysis of the UAV.
As a kind of large-load agricultural equipment, HUAV needs to meet the corresponding requirements and principles. Among the design objectives of HUAV, firstly, it needs to meet a certain working load and take-off weight. Secondly, it needs to ensure a certain full load endurance time and no-load hovering endurance time. In addition, the disturbance loss of the power system cannot exceed 10% of the theoretical maximum lift. The design principles include reliability, light weight and convenience. Among other things, reliability requires reliable material strength and quality, and safety margins for major load-bearing and connecting components. The power supply system should also be reliable to meet the demands of complex working conditions. Lightweighting should use lightweight materials to reduce the weight of the UAV, reduce energy consumption, and increase range time. Convenience should reduce the wheelbase of the whole machine and make it easy to be transported to the operation site (Girdwood et al., 2020). The block diagram of FID requirements and principles of HUAV is shown in Figure 1.
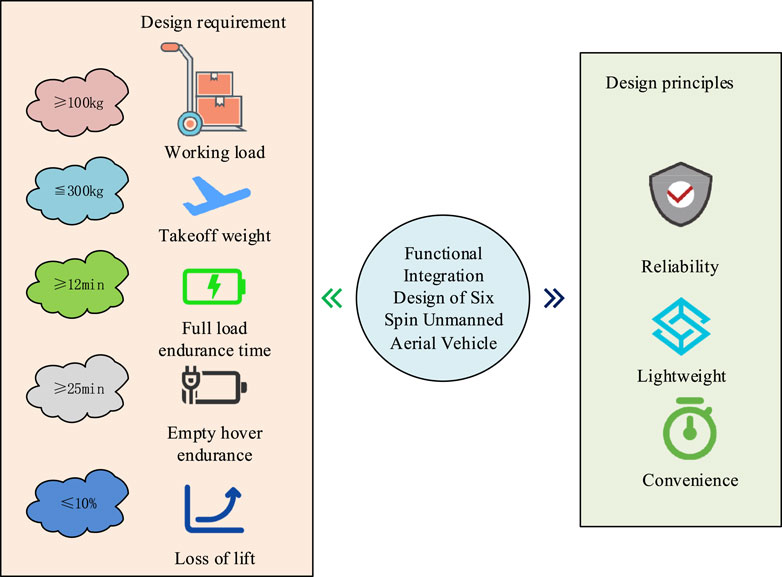
Figure 1. Functional integration design requirements and principles of six-rotor UAV.
When designing a multi-rotor agricultural UAV, the matching of the power system is the primary issue. Due to the large load and wheelbase dimensions of agricultural UAVs, the requirements for the power system are more stringent (Bilgili et al., 2021). The study opted for a brushless motor drive scheme due to the internal combustion engine’s high energy consumption, lack of environmental friendliness, high mechanical complexity, and high maintenance costs. The compact size and light weight of brushless motors allow them to efficiently lower the machine’s overall weight and energy consumption while maintaining excellent transmission efficiency. Brushless motors offer higher efficiency, greater power output and smooth stepless speed regulation compared to ordinary brushed motors. Eagle Power EA130-KV40 brushless motor is selected for the study, which consists of two parts: rotor and stator. Among them, the stator part includes stator base, core, stator windings and bearings, while the rotor part includes rotor end cover, rotor housing, magnets and motor spindle. The specific structure is shown in Figure 2.
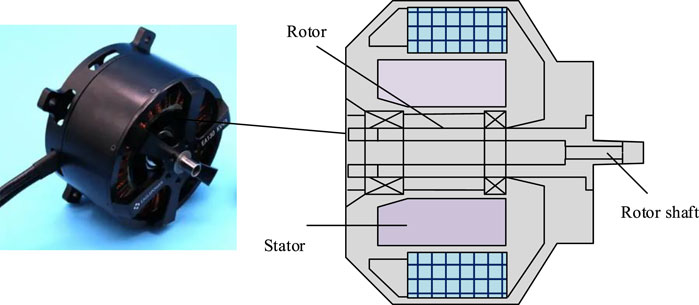
Figure 2. Eagle power EA130-KV40 brushless motor structure diagram.
The propeller is a very important component in a UAV, and its model contains size and pitch parameters (Unal, 2021). Size refers to the diameter of the propeller. Propeller pitch refers to the distance it rises or moves forward in one revolution. With the same motor speed, propeller size and material, the larger the pitch, the more thrust and torque the propeller will produce. In order to meet the functional requirements of the UAV, the model UC6015L propeller with a size of 60 inches and a pitch of 15 inches was selected for the study. The main role of the ESC in the UAV is to convert the control signal from the flight control to the current level, thus controlling the rotational speed of the motor. According to the relevant parameters of the selected brushless motor, its current at maximum efficiency operation is 143A, and the battery required for normal operation is 24S/92.6 V (Li et al., 2021). To ensure that the motor can operate normally and stably, the study selected an ESC with a maximum operating current of 260A and reserved sufficient margin. The study uses lithium battery packs, each with a specification of 6 S, 22000 mAh, 488.4 Wh and 22.2 V. Each motor is powered by four lithium batteries in series, for a total of 24 batteries for the entire machine. The selection of four batteries of this type in series is to match the rated operating voltage of the brushless DC motor at 24 S/92.6 V, and the power supply module of this battery pack can achieve the replacement of a single battery. According to the parameter design of each component in the power system, the study used Solidworks software to realize the FID of HAUAV. The components to be modeled include the HAUAV’s landing gear, battery, propeller, ESC, center carbon plate, motor, and arm. The landing gear is mainly fixed underneath the carbon plate, which is made of 45-gauge steel with a thickness of 2 mm. The battery is fixed on top of the carbon plate and is responsible for providing energy to the power unit. The propellers, ESCs and motors are mounted on the arms. The central carbon plate is made of carbon fiber and is 5 mm thick, and the arm, which is used to mount the power unit, is made of 45-gauge steel and is 2 mm thick. The design goal was to reduce the weight and simplify the structure as much as possible while still meeting the functional requirements The structural diagram of a six rotor agricultural drone is shown in Figure 3.

Figure 3. Structural diagram of the six-rotor agricultural UAV.
After completing the structural design of the whole UAV, the total takeoff weight of this UAV in the standard state can be found according to the dimensional parameters of the materials used, which is calculated as shown in Eq. 1.
In Eq. 1,
In the study of rotor AC, the efficiency of the wing is primarily affected by the airfoil, and to a lesser extent by its curvature and thickness. Additionally, the fuselage and other similarly shaped components of an UAV may generate small amounts of lift depending on their shape and angle of attack. Aerodynamists use a single coefficient, known as the lift coefficient, to indicate the lift generated by an UAV or any of its components. This coefficient simplifies the complex wing shapes and configuration factors for convenience. The lift coefficient is usually defined relative to the reference speed. For a six rotor drone, the reference speed is the rotor tip speed. The thrust to weight ratio of a drone is the ratio of the forward propulsion force of the drone engine to its own weight. This ratio is used to evaluate the flight performance and energy efficiency of the drone. A higher thrust to weight ratio indicates stronger performance during takeoff, climb, and acceleration. The pull coefficient of a drone is the ratio of the force applied to the drone during flight to the product of dynamic pressure and wingspan area. The reference area for calculating the lift coefficient is the effective span area of the six rotors, which is the projected area of the rotors in the direction perpendicular to the flight direction. The study uses a simplified reference surface as a specific reference surface in the lift coefficient, which can represent the effective area of lift generated by the overall structure of the drone during flight. So, taking the sum of the projected areas of the six rotors of the drone in the vertical direction as the reference surface, its value is 4.7124 square meters. The calculation steps for the lift coefficient of a six rotor unmanned aerial vehicle in hover are as follows: first, calculate the total lift generated by the six rotors. Next, calculate the reference area of the rotor, and finally calculate the lift coefficient by dividing the aerodynamic force by the product of the dynamic pressure and the wing reference area. The torque coefficient is a dimensionless physical quantity that represents the magnitude of torque per unit length. In unmanned aerial vehicles, torque coefficient describes the ability of the UAV to turn and respond to external disturbances such as lateral airflow and yaw. The torque coefficient is the ratio of engine torque to aerodynamic drag force. The advance ratio is the ratio of the free stream fluid speed to the propeller tip speed. The coupling efficiency of force effect refers to the ratio of the effects generated by the interaction of different forces in a system to the energy consumed. The drag force experienced by drones mainly includes air drag force, inertial drag force, and turbine drag force. Among them, air drag force is the main factor affecting the performance of rotary wing unmanned aerial vehicles. During flight, drones need to overcome air drag force in order to move forward, so air drag force has a significant impact on the flight speed and sensitivity of drones. The drag force coefficient varies between 0.01 and 0.05. From an aerodynamic perspective, the lift coefficient of an airfoil is related to boundary layer separation (Abdolahipour, 2023). Due to the effect of air viscosity, when the pressure at the leading edge of the rotor decreases, laminar separation will eventually occur on the rotor. At high Reynolds numbers, turbulence energy causes separated bubbles to return to the rotor surface without causing separation. At low Reynolds numbers, viscous forces significantly influence flow, which can decrease the lift to drag ratio of micro rotors (Xiao et al., 2022). Figure 4 shows a schematic diagram of laminar separation.
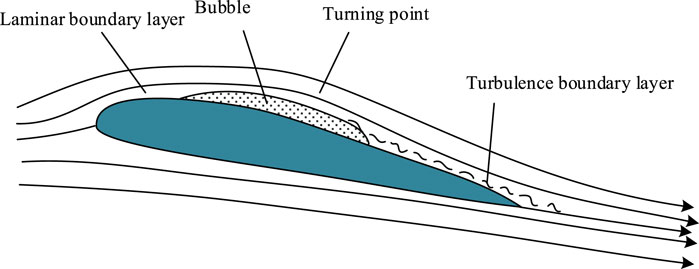
Figure 4. A Schematic representation of the laminar flow separation.
The power coefficient of drones is mainly used to describe the efficiency and capability of drone motors. The study mainly uses numerical simulation method to carry out the AC study. The three fundamental equations that control fluid dynamics-the continuity equation, the momentum equation, and the energy equation-are the foundation of CFD (Panza et al., 2021; Mokayed et al., 2023). The continuity equation is a specific form of expression of the law of conservation of mass in fluid mechanics. From the point of view of the amount of matter, the amount of matter passing through any closed surface in the flow field at the same time must be equal to zero. Its differential equation representation is shown in 2.
In Equation 2,
In Eq. 3,
In Eq. 4,
The momentum conservation equation in the y-direction is expressed as shown in Eq. 6.
In Eq. 6,
In Eq. 7,
If the fluid is an ideal gas, the ideal gas equation of state needs to be satisfied as shown in Eq. 9.
Multi-rotor vehicles have rotor speeds ranging from 1,500 to 3,500 rpm, and turbulent motion exists in this case. In order to better understand this flow phenomenon, the study introduces the RNG k-ε model, which is based on the k-εTM modified to solve the equations of k and ε using the modified Renormalization Group method. Where k represents the turbulent kinetic energy, which indicates the intensity of turbulence in the flow, and ε represents the turbulent dissipation rate. The RNG k-εTM belongs to the two-equation vortex viscous mode, which describes the Reynolds stress as shown in Eq. 10.
In Eq. 10,
In Eq. 11,
In Eq. 12,
When measuring the aerodynamic characteristics of six rotor agricultural unmanned aerial vehicles, aerodynamic sensors are mainly used to measure lift, drag, and lateral forces. Simultaneously using a gyroscope to measure the attitude angle and direction of the UAV. The wind speed sensor is used to measure the wind speed and direction around the UAV, helping to analyze the impact of wind on the UAV and adjust its flight performance. In addition, pressure sensors are used to measure atmospheric pressure, helping UAV determine the impact of altitude and pressure changes on aerodynamic performance. The research mainly uses CFD to numerically simulate the aerodynamic sensors, gyroscopes, wind speed sensors, and pressure sensors, and analyze the aerodynamic characteristics of multi rotor unmanned aerial vehicles. Since the AC of the multi-rotor vehicle has high requirements on the distribution of pressure and velocity fields, the iterative method selected for the study is the SIMPLE algorithm, which is mainly used to solve the numerical simulation of incompressible flow (Letizia et al., 2023).
To investigate the effect of air drag force on UAV performance in practical applications, the model is first simplified and pre-processed, the computational domain is determined, and the boundary conditions for inlet and outlet, wall and free surface are set. The research employs Space Claim software for model simplification and preprocessing. The central carbon plate and arm are integrated into a fuselage, and the motor model is removed. The propeller position coordinates remain unchanged, facilitating rapid grid division and shortening the research period. After establishing the simplified model, preprocess the calculation area in Space Claim software to define and set the interface, inlet, outlet, wall surface, and propeller part as the internal calculation domain, and the other parts as the external calculation domain. The study sets the model as a rectangular shell inside and outside the drone to simulate the airflow field. Eight working condition models were established according to different situations, including the flight conditions of the UAV without fairing and with fairing at the tilt angles of 5° and 10°, and the speeds of 5 m/s and 10 m/s. In order to prevent interference from the boundary of the flow field on the solution of the flow field, the computational domain should be set as large as possible. Taking into account all factors and without affecting computational accuracy, it is advisable to select a larger computational domain as much as possible to reduce the interference of flow field boundaries. The study selected a rectangular prism of 15R * 10R * 10R as the computational field outside the computational domain. Due to the formation of downwash flow during rotor rotation, a near-field region is set up at the rotor wake for capture. The specific simplified model diagram is shown in Figure 5.
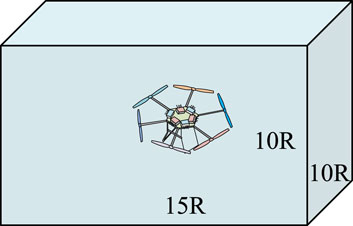
Figure 5. Simplification and preprocessing model.
The eight models were analyzed by the Fluent software to simulate the airflow field. These eight models are analyzed to obtain the maximum drag force on the UAV during the roll motion and the corresponding change rule. A hard thin tube with a length of 100 mm, an inner diameter of 2 mm, an outer diameter of 4 mm, and a wall thickness of 1 mm was designed for collecting wind pressure in incoming flow. To further block the influence of rotor turbulence on wind measurement, a hemispherical fairing with a diameter of 66 mm and a wall thickness of 2.5 mm was designed around the opening of the pressure sensing chamber. A 25 mm radius opening was left at the bottom of the fairing to release the wind pressure generated by the obstruction of the incoming flow by the fairing and reduce the wind resistance of the fairing pair. The schematic diagram of the fairing is shown in Figure 6.
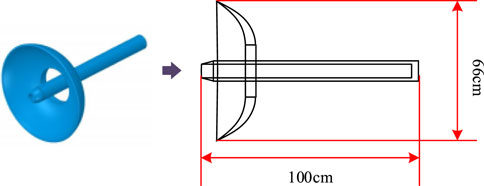
Figure 6. The schematic diagram of the fairing.
Subsequently, grid partitioning should be performed by importing the preprocessed simplified model into Fluent software and selecting the Mesh module. The global minimum size should be set to 1.5 mm and the maximum size to 300 mm, based on the principle of internal density and external sparsity. The size range of the inner domain should be set to 1.5–15 mm and the size range of the outer domain should be set to 1.5–300 mm. The surface mesh is divided using curvature and proximity methods, and the size field function and surface mesh are saved. To ensure grid quality, the preprocessed model and size field function are re-imported into the Mesh module, and the grid is finely divided in the computational domain. The fluid part type is set to fluid and all others to dead to generate a volumetric mesh, as shown in Figure 7.
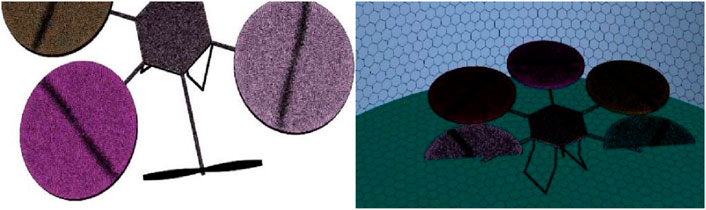
Figure 7. Grid division.
After completing the meshing, enter the solution module and select the K-omega (2eqn) SST model to set the boundary conditions one by one and use the SIMPLE algorithm to carry out iterative calculations. When the calculation converges, the results are saved and imported into CFD post software for post-processing analysis. In the post-processing stage, the drag, pressure distribution, and flow field distribution are analyzed in depth to better understand the AC of the UAV.
This chapter focuses on the AC numerical simulation analysis of the research-designed HAUAV. Firstly, the drag force under different operating condition models is analyzed using the CFD numerical simulation method proposed by the institute, and the flow field distribution of the UAV is analyzed. Subsequently, the effects of different propeller pitches on important parameters such as lift coefficient, pull coefficient, torque coefficient, force-effect coupling efficiency, motor force-effect, range time, and pressure distribution of pull coefficient and power coefficient of the UAV are explored.
In the numerical simulation analysis of AC of HAUAV, the specifications and models of HAUAV are shown in the Table 1.
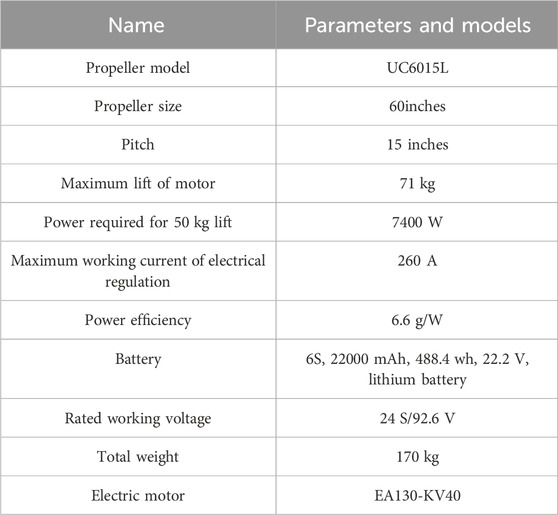
Table 1. Specifications of the HAUAV.
The study begins with an AC simulation analysis using CFD numerical simulation for different operating condition models to verify the drag of HAUAV under different operating conditions. Perform transient solution settings in Fluent, with the inlet boundary of the incoming air flow set as the velocity inlet, the outlet boundary corresponding to the air wake set as the pressure outlet, and the remaining boundaries set as non slip wall boundaries. The finite volume method is used to discretize the control equation. Due to the flapping of the six rotor model, complex turbulent flow is generated near the rotor surface. Therefore, a low Reynolds number flow field k-epsilon RNG turbulence model is used in the simulation. Set up an action grid for the wall boundary of the six rotor model, select the system coupling for the action grid type, and re divide the fluid domain dynamic grid into complex shaped grids through grid reconstruction method. Prevent excessive deformation of the grid near the six rotor through diffusion smoothing method. Meanwhile, the quality of the grid is evaluated based on factors such as grid orthogonality, skewness, aspect ratio, etc. Optimize the number of elements in the boundary layer, wake region, and far-field to maintain consistent lift coefficients (Shahrokhi et al., 2024). The study verifies the flow field distribution of the HUAV with fairing in the cross-section parallel to the flight direction of the UAV as well as in the plane above the UAV, and the flow field distribution of the UAV in the XY-plane and XZ-plane is shown in Figure 8. In Figure 8A, on the XY plane, i.e., the cross-section parallel to the flight direction of the UAV, the area of higher streamline velocity is concentrated at the intersection of the airflow with the landing gear and the motor. The distribution of streamlines in the forward direction of the UAV is dense and relatively neat, while the streamlines in the rear are sparse. The main reason is that the airflow disperses after contacting with the UAV, resulting in a change of airflow direction, which is a normal aerodynamic performance. In Figure 8B, in the XZ plane, i.e., the plane above the UAV, the UAV model with a fairing shows a good fairing effect during the flight. The uniform and orderly distribution of the streamlines indicates that its AC is excellent and effectively avoids the problem of efficiency degradation due to aerodynamic interference.
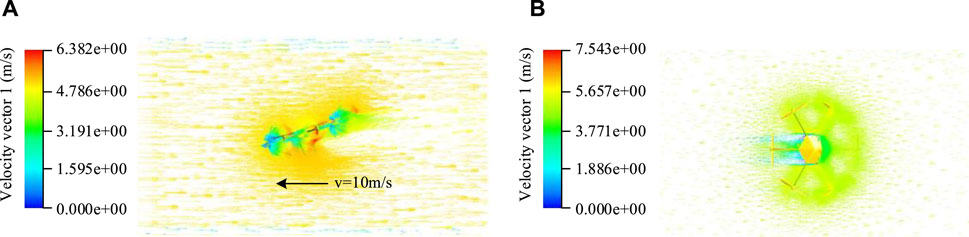
Figure 8. Flow field distribution of the UAV on the XY surface and the XZ surface. (A): Flow field distribution of drone flight direction cross-section; (B): Flow field distribution in the plane above the drone.
To verify the lift coefficient at different speeds, the maximum lift coefficient in hover and forward flight conditions has been measured. The angle of attack and forward inclination are both set to 0°, the inflow velocity is 10 m/s, and the speed range is 1,500–2,100 rpm. The maximum lift coefficient at different speeds is shown in Table 2. As shown in Table 2, the maximum lift coefficient increases with the rotational speed. The data suggest that increasing the rotational speed of a hexarotor drone can increase its maximum lift coefficient. Specifically, in the hovering state, the maximum lift coefficient increases from 0.0059 to 0.0098, and in the forward flight state, it increases from 0.3974 to 0.5979. This conforms to the principle that increasing power generates more lift, thereby supporting the UAV.
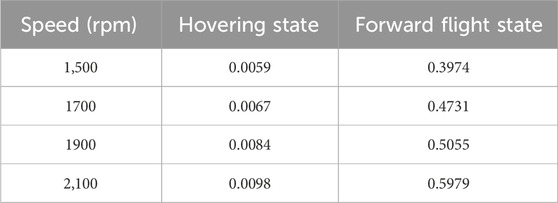
Table 2. Maximum lift coefficient at different speeds.
The study investigates the maximum lift coefficient in forward flight at various inflow velocities. The rotor’s angle of attack and tilt angle are both set to 0°, while the speed is 1700 rpm. The incoming flow velocities tested are 10 m/s, 15 m/s, and 20 m/s. Table 3 displays the variation of the maximum lift coefficient of the rotor with the incoming flow velocity. Table 3 shows that the maximum lift coefficient of the rotor decreases as the incoming flow velocity increases. Specifically, when the inflow velocity increases from 10 m/s to 20 m/s, the maximum lift coefficient in hover decreases from 0.0071 to 0.0058. Additionally, the maximum lift coefficient in the forward flight state decreases from 0.4818 to 0.3487, indicating a decreasing trend. The higher inflow velocity causes the separation of airflow on the upper surface of the rotor, reducing the efficiency of lift generation and thus lowering the maximum lift coefficient. Additionally, the inflow velocity has a greater impact on the maximum lift coefficient in forward flight. This is because the rotor needs to generate lift to support the weight of the UAV and overcome flight drag force.
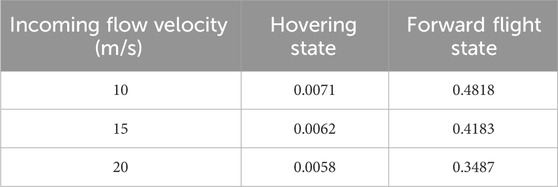
Table 3. Maximum lift coefficient at different speeds.
The study investigates the effect of changes in forward tilt angle on rotor aerodynamics during forward flight. Specifically, the study examines the impact of forward tilt angles of 5°, 15°, and 25°, with an angle of attack of 0°, incoming flow velocity of 10 m/s, and speed of 1700 rpm. Table 4 shows the variation of the maximum lift coefficient of the rotor with the forward tilt angle. As the forward tilt angle increases, the maximum lift coefficient of the rotor decreases. This is due to the fact that the forward inclination angle of the rotor increases, causing the incidence angle of the airflow to also increase. This reduces the adhesion of the airflow along the surface of the rotor, thereby reducing the efficiency of lift generation.
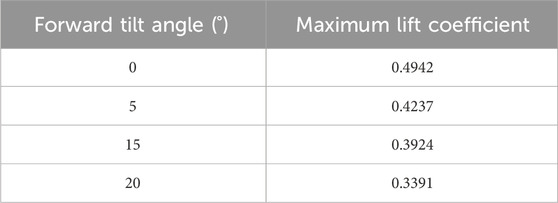
Table 4. Maximum lift coefficient at different tilt angles.
Aerodynamic performance tests were conducted in a hovering state to verify changes in the pull coefficient and torque coefficient of the rotor at different speeds. The tests were conducted with an angle of attack and forward inclination of 0°, an incoming flow velocity of 10 m/s, and a speed range of 1,500–2,100 rpm. The variation of pull coefficient and torque coefficient with rotational speed is shown in Table 5. Table 5 shows that as the rotor speed increases, both pull and torque also increase significantly, with maximum values reaching 0.0173 and 0.0025, respectively. The rotor needs to generate pull equal to the weight of the UAV to maintain hovering, which means that the pull coefficient also increases with lift. This suggests that increasing the rotational speed can enhance the rotor’s lift generation capacity, thereby increasing the pull coefficient. As the rotational speed increases, the torque generated by the rotor also increases. This is mainly due to the increased lift, which leads to an increase in aerodynamic torque on the rotor.
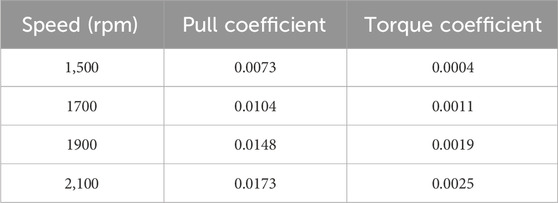
Table 5. Pull and torque coefficients at different rotational speeds.
Further investigate the impact of changes in advanced ratio on the aerodynamic characteristics of rotors during forward flight. Among them, the angle of attack and tilt angle are 0°, the incoming flow velocity is 10 m/s, the speed is 1700 rpm, and the advanced ratio is set to 0.4, 0.5, 0.6, and 0.7, respectively. The variation of the maximum lift coefficient of the rotor with the advanced ratio is shown in the Table 6. As shown in Table 6, as the forward angle increases, the maximum lift coefficient of the rotor decreases. And the smaller the advanced ratio, the faster the decrease in lift coefficient. The reason is that as the advanced ratio increases, the acceleration effect of rotor rotation on the airflow weakens, and the influence of rotor on the aerodynamic characteristics of the wing decreases.
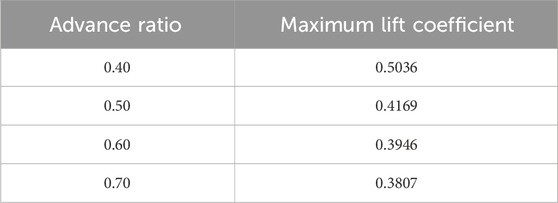
Table 6. Maximum lift coefficient under different advanced ratios.
The study aims to verify the total lift coefficient and force effect coupling efficiency of a six-rotor UAV during horizontal flight. The experimental platform mainly consists of rotor power system, rotor operation system, measurement system, and support, used to measure the rotor speed, generated tension, and consumed power. The DC power supply for the rotor is a lithium battery pack with a capacity of 6 S, 22000 mAh, 488.4 Wh, and 22.2 V. The brushless motor is EA130-KV40. In the measurement system, lift, drag, and lateral force are measured by aerodynamic sensors. The attitude angle and direction of the drone are measured using a gyroscope. The wind speed and direction around the drone are measured using wind speed sensors. In addition, atmospheric pressure is measured by pressure sensors. In addition, supports have been set up to support the rotor and DC brushless motor. Set the height of the support to 1 m and install the rotor head downwards to eliminate ground effects. The schematic diagram of the experimental setup is shown in Figure 9.
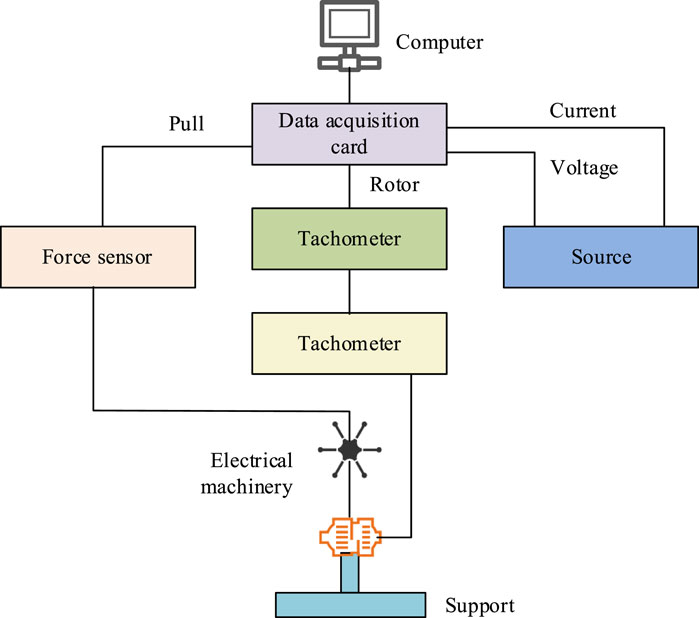
Figure 9. Experimental setup schematic.
The study first explores the effects of attitude angle, flight speed, and fairing on the experimental results. The specific settings of each scenario are shown in Table 7.
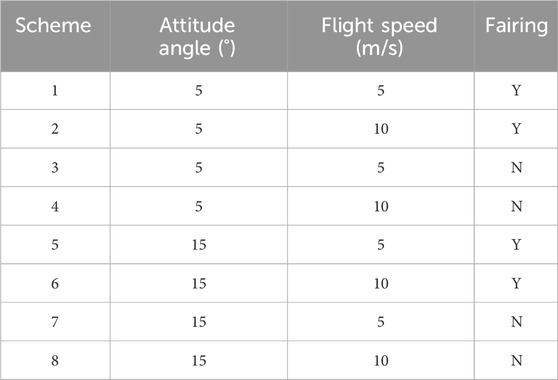
Table 7. Specific Settings of different flight conditions.
The investigation was conducted independently 10 times for each scenario in order to guarantee the experiment’s dependability, and the final average was used to determine the experiment’s outcome. Figure 10 displays the drag force for each case. In Figure 10, the drag force value suffered by the UAV with the fairing installed is significantly lower than that of the uninstalled scenario. In the case of attitude angle of 5° and flight speed of 10 m/s, the average drag force of the UAV with fairing is only 20.15 N, which is 5.26 N lower than that of the case without fairing. The value of drag force increases with increasing flight speed. When the attitude angle is 15° and the flight speed is 10 m/s, the drag force value suffered by the UAV without fairing reaches the highest value of 38.04 N. In addition, when the attitude angle is 5° and there is no fairing, the drag value of the scenario with a flight speed of 10 m/s is increased by 20.20 N compared with that of the scenario with a flight speed of 5 m/s. This suggests that the drag force value is most influenced by the flight speed. In the numerical simulation of (Guan and Li, 2024), installing fairings can effectively reduce drag force, and the higher the flight speed, the greater the drag force.
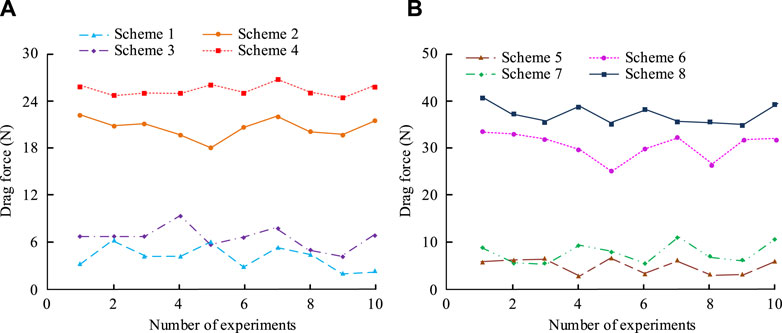
Figure 10. Drag force situation of each scheme. (A): Drag force situation at the same attitude angle; (B): Drag force situation at the same flight speed.
The comparison of Reynolds number and maximum lift coefficient in different experiments is shown in Table 8. From Table 8, it can be seen that the Reynolds number range of the rotor unmanned aerial vehicle studied and designed ranges from 0.80 × 10⁵ to 1.20 × 10⁵, with a maximum lift coefficient of 0.5036. As the Reynolds number increases, the maximum lift coefficient also shows a corresponding growth trend. The reason is that as the Reynolds number increases, the interaction between the rotor and the air becomes stronger, and the resulting lift also increases accordingly. But when the Reynolds number increases to a certain extent, the viscous effect of the fluid gradually weakens, while the inertial effect increases, which may lead to a slowdown in the growth rate of the lift coefficient.
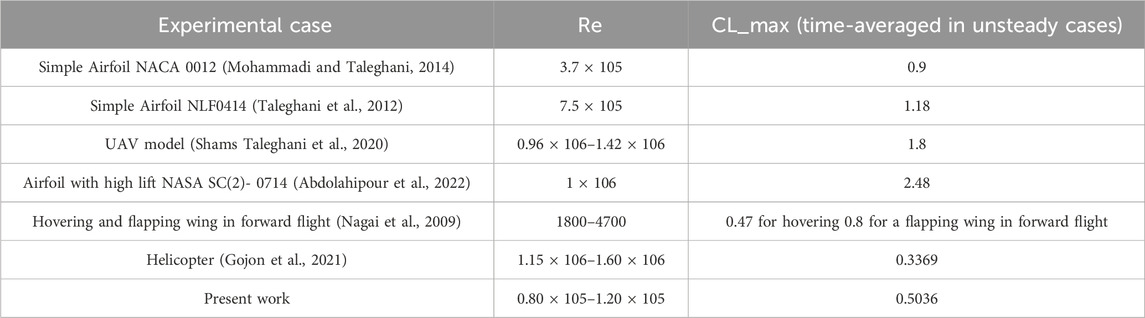
Table 8. Comparison of maximum lift coefficient in different experimental cases.
The study continued to conduct experimental analysis on unmanned aerial vehicles with different propeller spacing. The speed used in the experiments is 1,600 rpm. To ensure the experiment’s effectiveness, the numerical simulation validation is conducted from different attitude angles, and the experimental results are shown in Figure 11. As shown in Figure 11A, when the pitch between the blades is within 260 mm, the total lift coefficient increases rapidly with the increase of the pitch between the blades. At a pitch of 260 mm between the blades, the six-rotor UAV achieves its maximum total lift coefficient of 0.4836 and 0.3318 at different attitude angles. When the propeller pitch is larger than 260 mm, the total lift decreases rapidly with the increase of the propeller pitch, and then rises again. Flow separation may occur on the suction side of the propeller when the spacing is above 260 mm. This can increase airflow drag force and lead to unstable flight conditions. Additionally, flow separation can cause increased aerodynamic noise, intensified vibration, and other issues that can affect the comfort and service life of UAV. In Figure 11B, when the pitch is 260 mm, the values are as high as 97.04% and 94.38%, respectively, which meet the design criteria. Considering the stability and efficiency of the UAV during flight, the study selects the optimal propeller pitch of 260 mm.
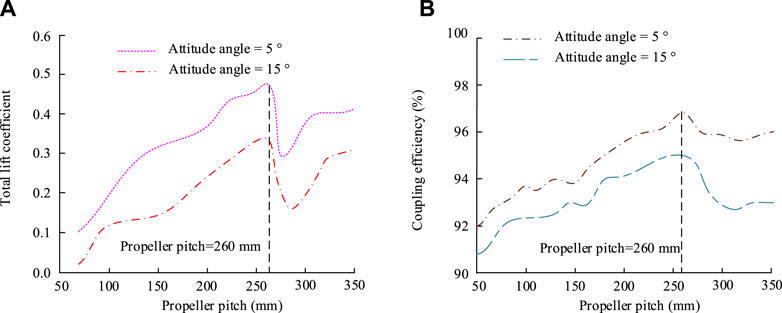
Figure 11. Total lift coefficient under different propeller spacing. (A): Total lift coefficient under different propeller spacing; (B): Coupling efficiency under different propeller spacing.
The investigation into the impact of varying paddle spacing on the UAV’s force effect and endurance duration is still ongoing. The experiments measure the variation of force effect and endurance time of UAV with different paddle spacing at different flight speeds, and Figure 12 displays the precise experimental results. In Figure 12A, the motor force efficiencies of the UAV with different paddle spacings are between 7.05 and 7.25 g/w. When the flight speed is 5 m/s, the motor force effect of 260 mm propeller pitch reaches 7.25 g/w, which is the maximum value among all models. Further analysis shows that when the pitch exceeds 260 mm, the weight of the UAV increases due to the growth of its arms, and thus the lift provided by a single propeller increases, leading to a reduction in force effect. When the pitch decreases, although the weight of the whole UAV is reduced, the coupling efficiency plummets due to the small pitch of the propellers, and the total lift decreases, resulting in the same reduction of force effect. In Figure 12B, when the flight speed is 5 m/s, the UAV with a pitch of 260 mm has the longest endurance time of 19.14 min. Currently, the UAV weight is moderate, and the total lift and coupling efficiency are optimized to maximize force effect, thereby prolonging endurance time. However, if the pitch exceeds 260 mm, the UAV’s weight increases, reducing force effect and ultimately decreasing range time. Therefore, overall lift and coupling efficiency decrease. When the pitch is too small, the overall lift decreases sharply, and the force effect also decreases, resulting in a shorter range.
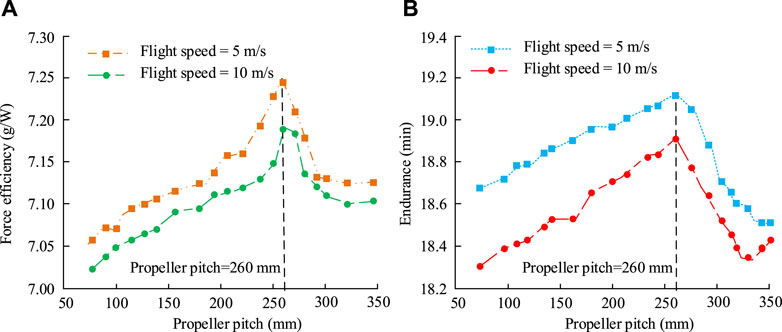
Figure 12. The change of the force effect and endurance time of the UAV at different paddle spacing. (A): The variation of force efficiency under different propeller spacing; (B): The variation of endurance time under different propeller spacing.
To more intuitively analyze the effects brought about by inter-rotor aerodynamic interference, the study continues to investigate the trends of the pull coefficient and power coefficient of the HUAV with pitch at different attitude angles at an operating speed of 2200 RPM, and Figure 13 displays the experimental outcomes. In Figure 13A, the pull coefficient is greater than 0.24 regardless of the configurations. Meanwhile, the lowest pull coefficient is found at an attitude of 0°, and all of them are lower than 0.033. However, when the paddle spacing is increased to 260 mm, the pull coefficient at an attitude of 0° increases to 0.324. With an attitude angle of 20°, the pull coefficient at an increase in the paddle spacing of 260 mm increases to 0.469. This indicates that with the increase of the propeller pitch to 260 mm, the pull coefficient increases to 0.469. This indicates that as the pitch increases, the overall pull force interference factor shows an increasing and then decreasing trend. The power coefficient in Figure 13B exhibits a trend of dropping and then increasing as propeller pitch increases. Meanwhile, at different attitude angles, the power coefficient increases with the increase of attitude angle. Among them, when the propeller pitch is 260 mm, the power coefficient at an attitude angle of 0° is only 0.147, when the power consumption is low. This is similar to the research results of (Aleisa et al., 2023), where the pull coefficient and power coefficient increase with the increase of attitude angle, confirming the experimental results of the study.
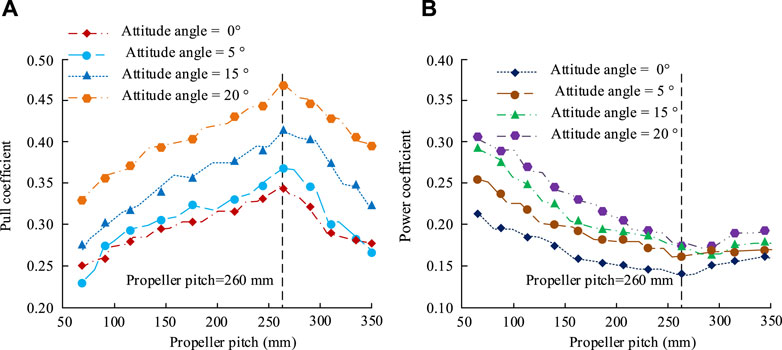
Figure 13. The variation trend of pull coefficient and power coefficient with propeller pitch at different attitude angles. (A): Changes in the Pull coefficient of Unmanned Aerial Vehicles under Different Pitch; (B): Changes in power coefficient of Unmanned Aerial Vehicles under Different Pitch.
Further research will compare the six rotor unmanned aerial vehicle designed by the research institute with other related studies, using a special blade rotor unmanned aerial vehicle with a frame covering structure for comparison (Ma et al., 2020). The comparison results are shown in Figure 14. From Figure 14, it can be seen that at three inflow velocities (10 m/s, 15 m/s, and 20 m/s), the lift coefficient of the rotor unmanned aerial vehicle designed by Ma et al. gradually decreases with the increase of inflow velocity in the forward flight state, but its maximum lift coefficient is lower than that of the rotor unmanned aerial vehicle designed by the research institute.
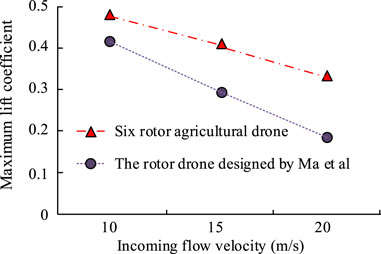
Figure 14. Comparison of results for different rotorcraft drones.
HAUAV is an advanced agricultural technology equipment. Its FID and appearance AC are important for improving the efficiency of agricultural production. The study first conducted FID of this UAV, and the CFD method was used for AC analysis. The study found that the UAV model with fairing demonstrated good fairing effect during flight in the XZ section of the UAV, which is the plane above the UAV. The uniform and orderly distribution of the streamlines indicates excellent AC, effectively avoiding efficiency degradation due to aerodynamic interference. Drag force values increase with both attitude angle and flight speed. The total lift of the HUAV increased rapidly as the pitch of the propeller approached 260 mm, reaching a maximum value of 4,483 N and 4,315 N at different attitude angles. The coupling effect was optimal at a propeller pitch of 260 mm, with values as high as 97.04% and 94.38%, meeting the design criteria. Additionally, the lowest pull interference factor was observed at an attitude of 0°, with all values below 0.33. At a propeller pitch of 260 mm, the power coefficient was only 0.147 at an attitude angle of 0°, resulting in lower power consumption. These findings demonstrate that the AC of the UAV are influenced by various factors, such as the attitude angle, flight speed, propeller pitch, and fairing installation. When designing and operating UAVs, it is important to consider various factors. However, the HUAV designed in the study did not take into account the effect of its own weight on range. Future studies should focus on reducing the self-weight of the UAV to improve its range.
The original contributions presented in the study are included in the article/supplementary material, further inquiries can be directed to the corresponding author.
ZL: Conceptualization, Investigation, Methodology, Validation, Writing–original draft, Writing–review and editing.
The author(s) declare that no financial support was received for the research, authorship, and/or publication of this article.
The author declares that the research was conducted in the absence of any commercial or financial relationships that could be construed as a potential conflict of interest.
All claims expressed in this article are solely those of the authors and do not necessarily represent those of their affiliated organizations, or those of the publisher, the editors and the reviewers. Any product that may be evaluated in this article, or claim that may be made by its manufacturer, is not guaranteed or endorsed by the publisher.
Abdolahipour, S. (2023). Effects of low and high frequency actuation on aerodynamic performance of a supercritical airfoil. Front. Mech. Eng. 9, 1290074. doi:10.3389/fmech.2023.1290074
Abdolahipour, S., Mani, M., and Shams Taleghani, A. (2022). Experimental investigation of flow control on a high-lift wing using modulated pulse jet vortex generator. J. Aerosp. Eng. 35 (5), 05022001. doi:10.1061/(asce)as.1943-5525.0001463
Aleisa, H., Kontis, K., and Nikbay, M. (2023). Numerical investigations on low-speed aerodynamic characteristics of generic unmanned combat aerial vehicle configurations. J. Aircr. 60 (6), 1965–1975. doi:10.2514/1.c037258
Bilgili, M., Tumse, S., Tontu, M., and Sahin, B. (2021). Effect of growth in turbine size on rotor aerodynamic performance of modern commercial large-scale wind turbines. Arabian J. Sci. Eng. 46 (8), 7185–7195. doi:10.1007/s13369-021-05364-6
Didane, D. H., Bajuri, M. N. A., Manshoor, B., and Boukhari, M. I. (2022). Performance investigation of vertical Axis wind turbine with savonius rotor using computational fluid dynamics (CFD). CFD Lett. 14 (8), 116–124. doi:10.37934/cfdl.14.8.116124
ElGhazali, A. F., and Dol, S. S. (2020). Aerodynamic optimization of unmanned aerial vehicle through propeller improvements. J. Appl. Fluid Mech. 13 (3), 793–803. doi:10.29252/jafm.13.03.30414
Girdwood, J., Smith, H., Stanley, W., Ulanowski, Z., Stopford, C., Chemel, C., et al. (2020). Design and field campaign validation of a multi-rotor unmanned aerial vehicle and optical particle counter. Atmos. Meas. Tech. 13 (12), 6613–6630. doi:10.5194/amt-13-6613-2020
Gojon, R., Jardin, T., and Parisot-Dupuis, H. (2021). Experimental investigation of low Reynolds number rotor noise. J. Acoust. Soc. Am. 149 (6), 3813–3829. doi:10.1121/10.0005068
Guan, Y. J., and Li, Y. P. (2024). Design and aerodynamic characteristics analysis of propellers for a novel rescue unmanned aerial vehicle. Aircr. Eng. Aerosp. Technol. 96 (1), 162–174. doi:10.1108/aeat-11-2022-0327
Ignatkin, Y., Makeev, P., Konstantinov, S., and Shomov, A. (2020). Modelling the helicopter rotor aerodynamics at forward flight with free wake model and URANS method. Aviation 24 (4), 149–156. doi:10.3846/aviation.2020.12714
Jinghui, D., Feng, F. A. N., Huang, S., Yongfeng, L. I. N., and Lin, Y. (2019). Aerodynamic characteristics of rigid coaxial rotor by wind tunnel test and numerical calculation. Chin. J. Aeronautics 32 (3), 568–576. doi:10.1016/j.cja.2018.12.026
Ko, J., and Lee, S. (2021). Numerical investigation of inter-rotor spacing effects on wake dynamics of coaxial rotors. J. Aircr. 58 (2), 363–373. doi:10.2514/1.c035857
Lei, Y., and Cheng, M. (2020). Aerodynamic performance of a Hex-rotor unmanned aerial vehicle with different rotor spacing. Meas. Control 53 (3-4), 711–718. doi:10.1177/0020294019901313
Letizia, S., Brugger, P., Bodini, N., Krishnamurthy, R., Scholbrock, A., Simley, E., et al. (2023). Characterization of wind turbine flow through nacelle-mounted lidars: a review. Front. Mech. Eng. 9. doi:10.3389/fmech.2023.1261017
Li, Y., Yonezawa, K., Xu, R., and Liu, H. (2021). A biomimetic rotor-configuration design for optimal aerodynamic performance in quadrotor drone. J. Bionic Eng. 18 (4), 824–839. doi:10.1007/s42235-021-0069-0
Ma, Y. Y., Zhao, Q. J., Chen, X., and Zhao, G. Q. (2020). Experimental analyses of synthetic jet control effects on aerodynamic characteristics of helicopter rotor. Aeronautical J. 124 (1274), 597–616. doi:10.1017/aer.2019.163
Makeev, P. V., Ignatkin, Y. M., and Shomov, A. I. (2021). Numerical investigation of full scale coaxial main rotor aerodynamics in hover and vertical descent. Chin. J. Aeronautics 34 (5), 666–683. doi:10.1016/j.cja.2020.12.011
Mohammadi, M., and Taleghani, A. S. (2014). Active flow control by dielectric barrier discharge to increase stall angle of a NACA0012 airfoil. Arabian J. Sci. Eng. 39, 2363–2370. doi:10.1007/s13369-013-0772-1
Mokayed, H., Quan, T. Z., Alkhaled, L., and Sivakumar, V. (2023). Real-time human detection and counting system using deep learning computer vision techniques. Artif. Intell. Appl. 1 (4), 221–229. doi:10.47852/bonviewaia2202391
Nagai, H., Isogai, K., Fujimoto, T., and Hayase, T. (2009). Experimental and numerical study of forward flight aerodynamics of insect flapping wing. AIAA J. 47 (3), 730–742. doi:10.2514/1.39462
Panza, S., Invernizzi, D., Giurato, M., and Lovera, M. (2021). Design and characterization of the 2DoF Drone: a multirotor platform for education and research. IFAC-Papers OnLine 54 (12), 32–37. doi:10.1016/j.ifacol.2021.11.006
Park, S. H., Yoo, J. U., Lee, S., and Shin, S. (2021). Real-time flight simulation for multirotor UAV integrated with the dynamic inflow aerodynamics. J. Am. Helicopter Soc. 66 (4), 1–14. doi:10.4050/jahs.66.042008
Pinti, O., Oberai, A. A., Healy, R., Niemiec, R. J., and Gandhi, F. (2022). Multi-fidelity approach to predicting multi-rotor aerodynamic interactions. AIAA J. 60 (6), 3894–3908. doi:10.2514/1.j060227
Shahrokhi, S. S., Taeibi Rahni, M., and Akbari, P. (2024). Aerodynamic design of a double slotted morphed flap airfoil–a numerical study. Front. Mech. Eng. 10, 1371479. doi:10.3389/fmech.2024.1371479
Shams Taleghani, A., Ghajar, A., and Masdari, M. (2020). Experimental study of ground effect on horizontal tail effectiveness of a conceptual advanced jet trainer. J. Aerosp. Eng. 33 (4), 05020001. doi:10.1061/(asce)as.1943-5525.0001140
Taleghani, A. S., Shadaram, A., and Mirzaei, M. (2012). Effects of duty cycles of the plasma actuators on improvement of pressure distribution above a NLF0414 airfoil. IEEE Trans. Plasma Sci. 40 (5), 1434–1440. doi:10.1109/tps.2012.2187683
Unal, G. (2021). Integrated design of fault-tolerant control for flight control systems using observer and fuzzy logic. Aircr. Eng. Aerosp. Technol. 93 (4), 723–732. doi:10.1108/aeat-12-2020-0293
Verma, N., and Baloni, B. D. (2022). Influence of Reynolds number consideration for aerodynamic characteristics of airfoil on the blade design of small horizontal axis wind turbine. Int. J. Green Energy 19 (7), 733–746. doi:10.1080/15435075.2021.1960356
Vijayanandh, R., Prakash, R. A., Manivel, R., Kiran, P., Sudharsan, R., Kumar, G. R., et al. (2022). Design and parametric study of counter-rotating propeller of unmanned aerial vehicles for high-payload applications based on CFD-MRF approach. Int. J. Veh. Struct. Syst. 14 (7), 840–848. doi:10.4273/ijvss.14.7.03
Wang, Z., Wang, Q., Yu, H., Duan, D., Ding, Z., and Li, J. (2021). Trimming analysis method of quad tilt rotor based on aerodynamic interference model. J. Aircr. 58 (2), 253–265. doi:10.2514/1.c035943
Xiao, L., Zhao, H., Xu, Z., Li, X., Shen, C., Wang, K., et al. (2022). A new architecture of morphing wing based on hyperelastic materials and metastructures with tunable stiffness. Front. Mech. Eng. 7, 814446. doi:10.3389/fmech.2021.814446
Keywords: hexacopter, agricultural unmanned aerial vehicle, functionally integrated design, aerodynamic characteristics, CFD numerical simulation
Citation: Liu Z (2024) Functional integration design and aerodynamic characterization of a hexacopter agricultural unmanned aerial vehicle based on its appearance. Front. Mech. Eng 10:1372010. doi: 10.3389/fmech.2024.1372010
Received: 17 January 2024; Accepted: 29 May 2024;
Published: 20 June 2024.
Edited by:
Scott T Miller, Sandia National Laboratories, United StatesReviewed by:
Arash Shams Taleghani, Aerospace Research Institute, IranCopyright © 2024 Liu. This is an open-access article distributed under the terms of the Creative Commons Attribution License (CC BY). The use, distribution or reproduction in other forums is permitted, provided the original author(s) and the copyright owner(s) are credited and that the original publication in this journal is cited, in accordance with accepted academic practice. No use, distribution or reproduction is permitted which does not comply with these terms.
*Correspondence: Zhe Liu, bGl1emhlNTEyMEB0b20uY29t
Disclaimer: All claims expressed in this article are solely those of the authors and do not necessarily represent those of their affiliated organizations, or those of the publisher, the editors and the reviewers. Any product that may be evaluated in this article or claim that may be made by its manufacturer is not guaranteed or endorsed by the publisher.
Research integrity at Frontiers
Learn more about the work of our research integrity team to safeguard the quality of each article we publish.