- 1Department of Mechanical and Aerospace Engineering, College of Engineering, Design and Physical Sciences, Brunel University London, Uxbridge, United Kingdom
- 2Department of Mechanical Engineering, College of Engineering, Prince Mohammad Bin Fahd University, Dhahran, Saudi Arabia
- 3Mechanical Engineering Department, Engineering College, University of Hail, Hail, Saudi Arabia
- 4Department of Mechanical Engineering, School of Engineering, University of Birmingham, Dubai, United Arab Emirates
- 5College of Engineering, Alasala University, Dammam, Saudi Arabia
The significance of this work is the demonstration that an ORC (Organic Rankine Cycle) system can be successfully implemented on heavy-duty vehicles and contribute to fuel consumption (and emissions) reduction. Additionally, this paper focuses on providing due consideration to the materials aspects of the most critical component of the ORC system, namely, the turbine—expander. The expander of an ORC system optimized off an experimental prototype coupled to a 7 L diesel engine and optimized from the point of view of the rotor geometry, materials and clearances to be applicable to the specific experimental setup. The optimum clearance between the rotor blades and shroud, in terms of performance and economical aspects, was calculated at 0.4 mm. Based on the initial geometry of the ORC turbine, for this particular application and optimising for performance, refrigerant R134a was found to be the best choice. Then the rotor geometry was optimized using ANSYS simulation. The maximum performance obtained by the expander to achieve 72.95% total to static isentropic efficiency. It was calculated on GT-Power that the optimized ORC system, implemented on a heavy-duty vehicle, can reduce fuel consumption by up to 17%.
1 Introduction
Increasing fossil fuel consumption, has led to serious environmental and energy problems such as global warming, resource depletion, air pollution and energy shortages. As a result, industries are focusing on the utilisation of low-grade heat sources (Bao and Zhao, 2013). In the recent years, the automotive industry has made great improvements in developing more efficient engines. Current automotive diesel engines commonly achieve 40%–45% efficiency while petrol engines are working with a peak efficiency of 30%–36% (Sphicas et al., 2017). Modern vehicles must comply with Euro VI, which sets the maximum value of CO2 emission level to 95 g/km (European Comission, 2017). Increasing fuel prices also create a demand for more efficient vehicles (Oil Crude Price, 2017).
To improve powertrain efficiency, manufacturers enhance the in-cylinder fuel and air mixing (Sphicas et al., 2017), employ advanced injection strategies (Sphicas et al., 2018), implement downsizing (Ricardo et al., 2011), hybridisation and electrification (Bin Ahmad et al., 2022). Heavy-duty vehicles and off-road machines are far less suitable for electrification, so reducing their emissions depends on improvements in conventional powertrains (Automotive Council UK, 2017).
Approximately 25%–35% of the fuel energy is wasted through the exhaust system while waste heat recovery technologies can greatly improve the engine efficiency (Sphicas et al., 2017). In turbocharged engines, a substantial part of the exhaust enthalpy is used by the turbocharger. However, there is still remaining an amount of lower grade heat energy which can be recovered. Organic Rankine cycle (ORC) systems are considered the most technically and financially feasible approach to converting low grade heat source into electricity for small and medium scale engines (Schuster and Karellas, 2009; Jiménez-García, 2023). Radial inflow turbines, with low mass flow rate and high-pressure ratio are applied more often than other types of turbines for medium-scale ORC systems due to their efficiency and cost-effectiveness (Chen, et al., 2015).
Stationary engines, equipped with ORC systems and operating at constant conditions have been well characterised. In literature there is a lack of reporting on the real-world implementation of ORC systems onboard vehicles. One reason is the cost (Hoang, 2018). But also, because there is not enough evidence for the efficiency of an ORC system implemented in small capacity engines, which have a transient load (Ringler and Seifert, 2009).
The present paper deals with the expander and ORC materials and mechanical considerations necessary to achieve improved engine performance in medium and heavy-duty engines.
2 Literature review
Figure 1 shows the simplified ORC system and the temperature enthalpy diagram. The ORC system consists of a heat exchanger, where the working fluid changes state from liquid to superheated vapour (process f–a). The vapour then expands isentropically in an expansion device linked to an electric generator (process a–b). The fluid is, then, condensed again to liquid (process b–e). The whole process is repeated as a result of the presence of a pump in the cycle, which recirculates the organic fluid (process e–f).
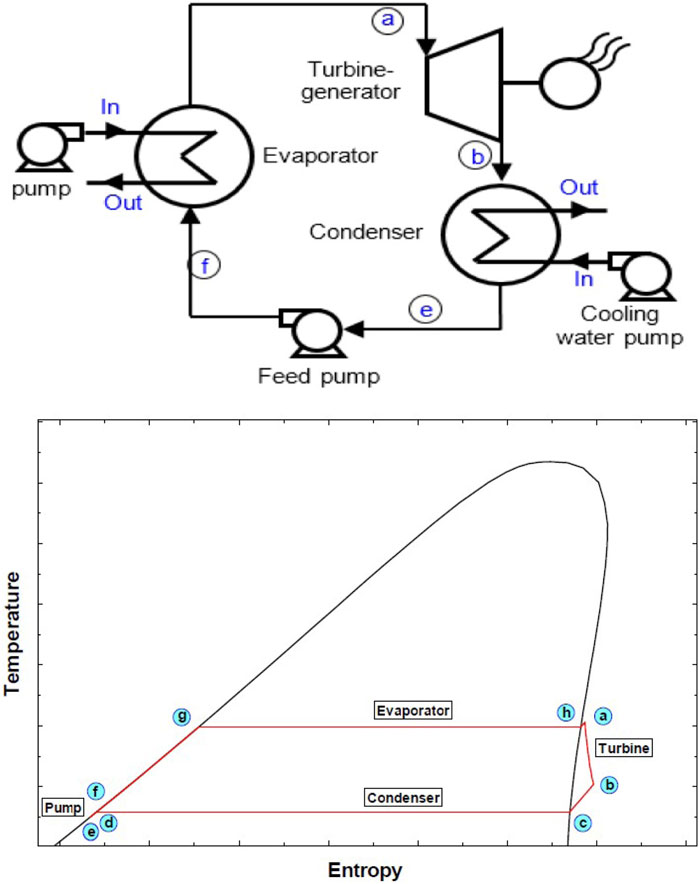
FIGURE 1. Simplified ORC system (Jung and Krumdieck, 2014).
The ORC systems are known to be able to operate with several organic fluids (e.g., R-123, R245fa, R134, butane, pentane, etc.) as working fluids. These working fluids have lower boiling points than water, thus they can easily boil by low-grade waste heat. By controlling the condenser pressure, the turbine stage pressure ratio is controlled. Condensation in the turbine must be avoided (Jung and Krumdieck, 2014).
In terms of the available types of expander, radial turbines produce more work-output per unit mass flow and are therefore more compact in size compared to scroll and screw expanders, or axial turbines. Based on data from existing turbines, the highest efficiency is achieved when operating in a relatively narrow range, where the ratio between the mean line rotor tip speed and absolute fluid inflow velocity is around 0.7 (Chen and Baines, 1994).
Over the last 20 years, ORCs have demonstrated good reliability and adaptability. ORC applications range from heat recovery in gas turbines and internal combustion engines, to solar, geothermal and biomass energy conversion. Small/medium size power plants (50–5,000 kW) have used an ORC in place of steam. In this power range of 50–5,000 kW, both axial and radial turbine-expanders have been used. The axial turbine has a low degree of reaction, capable of treating a large enthalpy drop with limited peripheral speed, in a single stage. The radial turbine has a better performance in the lower size range (Fiaschi and Manfrida, 2012).
A typical heat recovery system includes either mechanical or electric turbo compounding, bottoming cycles and thermoelectric generators (Pesiridis, 2014). The mechanical turbo compounding system is based on transforming waste heat energy from the exhaust gases to spin a turbine. The electric turbo compound setup transforms the exhaust gas waste heat into electrical power, which is stored in batteries or used to power the auxiliary systems of the engine (Kirmse, et al., 2016).
In the automotive industry, heavy-duty vehicles in particular, can benefit the most from waste heat recovery systems, as they produce great amounts of emissions and heat. Implementation of such systems in these vehicles can offer an increase of the powertrain power (or a corresponding reduction in fuel consumption) by over 10%, while reducing the emissions (Teng and Regner, 2007). The efficiency of an ORC depends on the temperature levels of the exhaust gases and mass flow rate. For the temperature range between 150°C and 300°C typically found in exhaust gases, ORC systems have demonstrated good efficiency levels that can exceed 12%, for well-designed systems (Park et al., 2018).
2.1 Turbine design and analysis
The most critical (and power-producing) component of an ORC is the turbine-generator. When designing a turbine, the preliminary design is based on thermodynamic cycle optimization. In this stage, the blade trailing edge geometry is optimized by modifying its three main parameters: relative exit flow angle, exit tip radius and hub radius. The relative exit flow angle is designed to minimize the relative Mach number at the shroud radius. For ease of calculation, an assumption of zero discharge swirl and ideal gas model is made. The main purpose of this preliminary design is to maximize the rotor efficiency (Zhuge, et al., 2013).
The aerodynamic design phase is a crucial stage in the design process of the turbine. The aerodynamic design is the result of the rotor dynamics, stress, manufacturing considerations and testing considerations. The aerodynamic design includes five stages: 1D preliminary design, blade and passage design, 3D geometry of blade and passage, 3D modelling of volute and 3D numerical simulations (Chen, et al., 2015).
2.2 Working fluids: importance and selection
The selection of a suitable working fluid is essential for the ORC system. The working fluid evaporation and critical temperature must match the heat source. The working fluid must be chemically and thermally stable at temperatures well above the operating temperature (Costall et al., 2015). The process used in this work is shown in Figure 2.

FIGURE 2. Working fluid selection process (Costall et al., 2015).
The ideal organic working fluid should have the following properties:
• High molecular weight,
• High critical pressure and temperature, to allow the engine operating temperature to absorb all the heat available up to that temperature,
• Low operating pressure, to avoid explosion or rupture of components,
• Small specific volume, in its gaseous state, to avoid the need for large and costly turbines, evaporators and condensers,
• Higher pressure inside condenser to prevent air inflow into the system,
• Non-flammable, corrosive or toxic characteristics.
To evaluate the actual performance of a turbomachine, the losses must be calculated. The overall loss of the turbine is the sum of several contributions, each one estimated through correlations which depend on kinematic and geometric parameters (Fiaschi et al., 2015a).
In the rotor, the flow is subject to a rapid acceleration in the flow direction, turning in the meridional plane along the camber line. Due to the three-dimensional behaviour of this type of flow, the total pressure inside the flow channel is not uniformly distributed, which can lead to losses (Fiaschi et al., 2015b). These losses are divided as follows:
• Rotor incidence losses- due to the incidence angle of the relative flow at rotor inlet.
• Skin friction losses- due to friction of the fluid with rotor.
• Tip clearance losses- due to the fluid leaking through the clearance gaps between the blade tips and the shroud. In the radial turbines, there are two types of clearances: axial, at inlet; and radial at outlet. The radial clearance represents the major component of clearance loss.
• Blade loading losses- caused by high curvatures of the profile and the pressure gradient in the rotor vanes. They represent the major factor to the drop of the expander efficiency.
• Disk friction losses- arising in the enclosure between the back side of the impeller and the casing of the machine.
Figure 3 presents the distribution of the rotor losses (Fiaschi et al., 2015a). Stator losses are generally lower than the rotor losses, and because of that they are not that well investigated in the literature (Fiaschi et al., 2015b). The diffuser is placed downstream of the rotor, to allow partial recovery of the large kinetic energy. The diffuser induces losses due to flow friction against the walls.
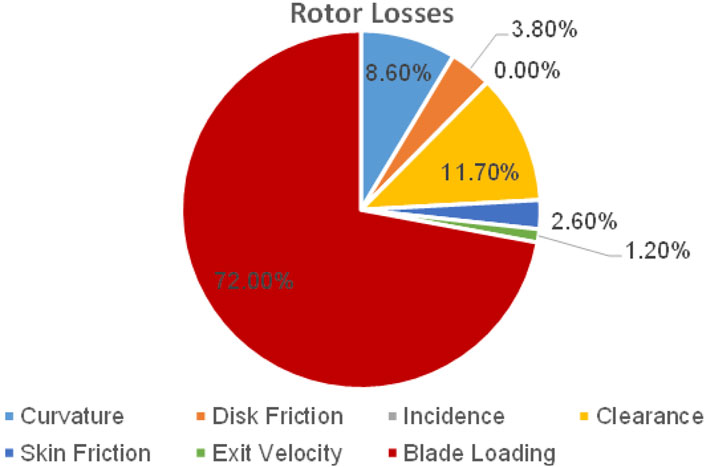
FIGURE 3. Rotor Losses modified from (Fiaschi et al., 2015a).
3 Methodology
The turbine (expander) is a major component of the ORC system. Figure 4 presents a simplified turbine development cycle. Initially the thermodynamic cycle is analyzed and a preliminary design of a radial turbine is generated. Then the flow and structure are analyzed (CFD and FEA). After manufacturing and testing of the parts, the design is improved (Lang, 2013).

FIGURE 4. Turbine development cycle (Jung and Krumdieck, 2014).
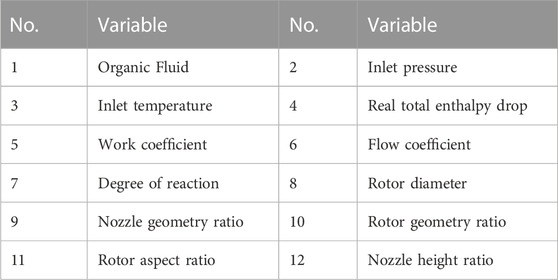
Table 1 shows the input data for the preliminary design of expander. General considerations include:
• Working fluid is compressible, non-ideal gas, since the expansion process is close to critical conditions, across large expansion ratios;
• Flow through turbine is assumed to be steady and adiabatic, even though the heat source will be unsteady in a mobile application;
• Number of stages limited to one, for minimizing complexity and cost;
• Full admission is initially assumed. Partial admission will be considered if the blade heights are unacceptable under full admission (Costall et al., 2015).
3.1 Baseline engine modelling
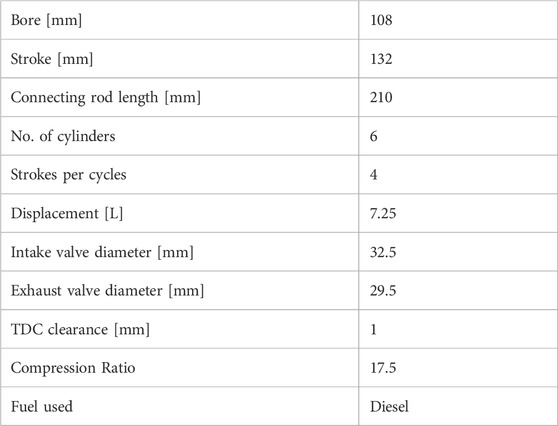
Table 2 represents the main parameters of the baseline engine. A 7-Liter, 6-cylinder, 4-stroke Diesel engine was simulated based on the Yuchai YC6A280 engine available at Brunel University London. The compression ratio was 17.5:1 and the TDC clearance 1 mm. The simulation model used within the GT-Power simulation software includes various phenomena occurring in real engine working cycle. The input parameters of the model were set in conformity with the recommendations for this type of engine according to the Yuchai YC6A280 base model, represented in GT-Power simulation environment in Figure 5A. All parameters specified in Table 2 originate from the Yuchai YC6A280 service manual, (Yuchai, 2017; Alshammari et al., 2018).
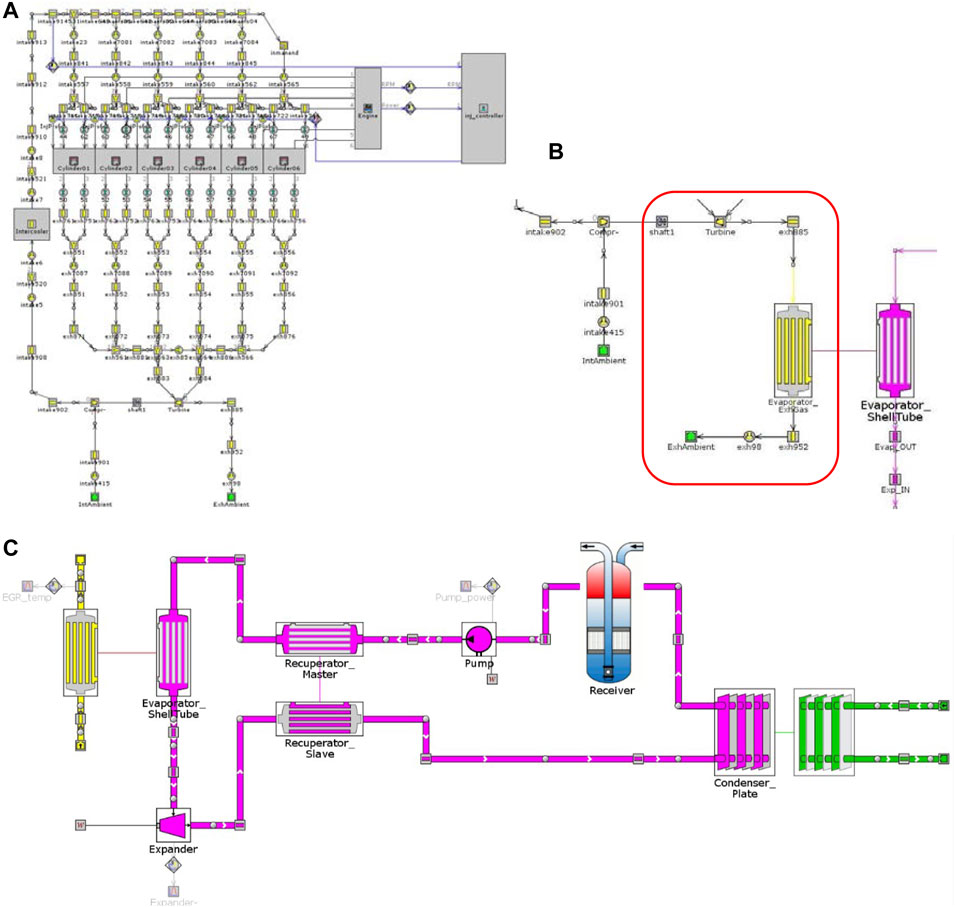
FIGURE 5. GT-Power model of: (A) engine base line, (B) ORC system, (C) ORC system integrated with engine.
The combustion model used is based on the Wiebe heat release function. The heat transfer sub-model is based on the Woschni model with simplified approach assuming a uniform heat flow on all piston surfaces, cylinder head and cylinder wall. GT-Power models the heat release of combustion as a function of time. The Woschni model of heat-transfer assumes that the heat flow coefficient and velocity over all surfaces of the engine cylinder are constant (Gamma Technologies, 2014).
The overall friction losses are estimated by means of a modified Chen-Flynn model. The Chen-Flynn friction model calculates the Friction Mean Effective Pressure (FMEP) as a weighted summation of the cylinder maximum pressure, the engine speed, the square of the engine speed and a constant (Gamma Technologies, 2014). The constant part of FMEP is equal to 0.3 bar. The peak cylinder pressure factor is 0.005. The mean piston speed factor is 0.1 bar per m/s.
3.2 Baseline ORC system
The baseline model of the ORC in GT-Power is illustrated in Figure 5B. The case setup for the system can be seen in Table 3. The temperature and the mass flow rate of the exhaust gases was taken from the results of the engine simulation. The temperatures of coolant and refrigerant were in accordance with data from the test rig (Alshammari et al., 2018).
The initial map of turbine is shown in Table 4. The suction pressure is 20 bar and the suction temperature 150°C. The data originated from the template of an existing ORC system (Alshammari et al., 2017). The template was used for the initial setup of the ORC system. After the expander was optimized in ANSYS, a new map was generated.
Figure 5B represents the detailed model of the ORC system. Figure 5C represents the ORC system integrated with the baseline engine (shown in Figure 5A). The models of the ORC system and the baseline engine were initially developed together, but due to the computational performance, it was decided to simulate them separately. More researchers in the literature have simulated the engine and ORC system separately, obtaining accurate results (Wei, et al., 2016). By developing the ORC system separately from the engine, the computational time was reduced substantially, while maintaining accurate results.
3.3 CFD simulation and modelling
Computational fluid dynamics simulations were used to optimize the turbine for this paper’s vehicle simulation. The interaction of moving components (turbine rotor) within a static environment (turbine casing), required the application of a moving reference frame model, where components are separated from stationary. One domain consists of the rotating components of the turbine (rotor, shaft) rotated at an imposed angular velocity, while the other domain contained the stationary components of the turbine (stator, volute, stationary walls). In ANSYS software, the moving reference frames models employed were: SRF (single reference frame), MRF (multiple reference frame) and SM (sliding mesh).
SRF is suitable for simple problems where the entire computational domain is considered as a single moving reference frame. The moving parts can take any shape. This model is not appropriate for simulating turbines, as they have more complex geometries. MRF represents the simplest model for the turbine. The main advantage of this model is that it can be solved at a low computational cost. MRF cannot account for vortex shedding or rotor-stator interactions. SM model uses more resources, but it is more accurate than MRF. SM is the most appropriate model for simulating turbines (Visavale, 2017).
With SM employed, a structured hexahedral mesh was used as it proved the most appropriate for this application. The mesh was aligned with the flow, and thus the numerical errors were reduced. To increase the accuracy of the results, the mesh was refined according to the component’s specification (ex: areas around blade and hub section) (CFD ONLINE, 2017).
The inlet boundary was defined with total pressure and temperature for a good numerical stability and convergence. If the inlet boundary was defined by velocity, errors interfere, and thus the convergence time increases (ANSYS, 2017).
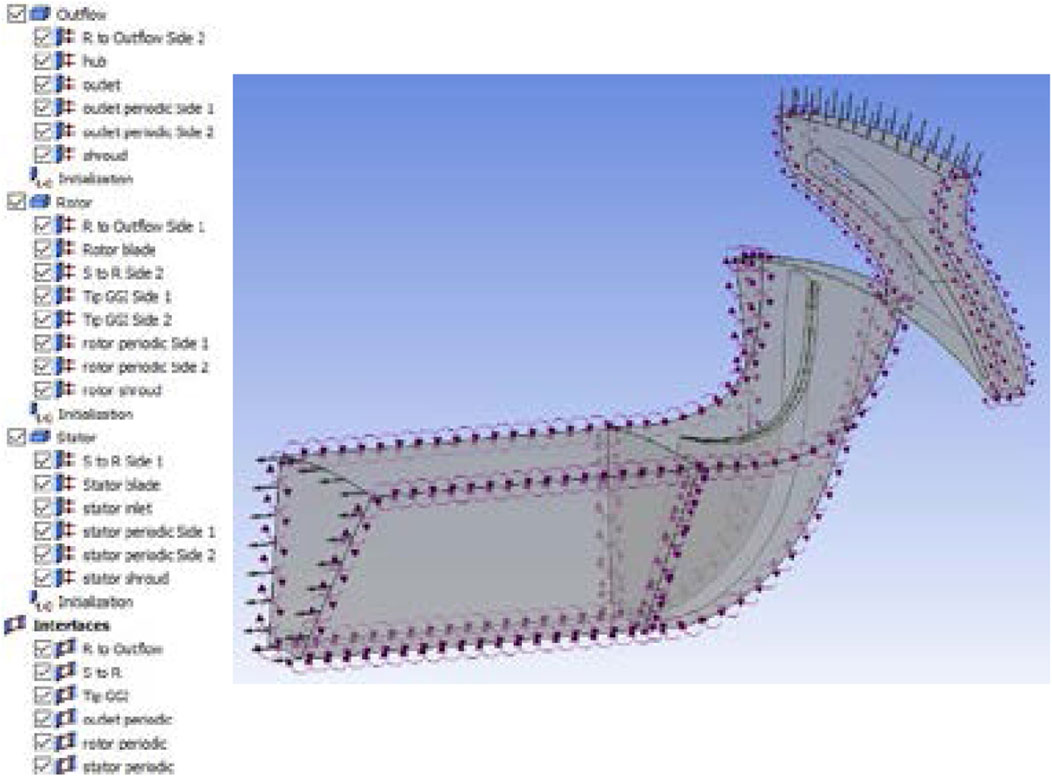
The design of an existing expander (Alshammari et al., 2017) was used as the starting model for the simulation and was further optimized to improve the performance of the ORC system. This design comprises of stator blades and rotor blades. The mesh files were imported to ANSYS Workbench and merged in the CFX setup. The stator and outflow domains were defined as stationary and the rotor rotates around the z-axis. Figure 6 presents all boundary conditions for the setup. Each domain had periodic interaction to simulate the flow between blades at each stage as a mesh for a single blade was used. In this way CFX copies this single passage through 360° to create the complete expander. Also interfaces between stationary and rotating domains were created with frozen rotor model to provide mesh connection and accurately represent the flow between them (Jones, 1996).
For all domains the reference pressure was 1 bar, heat transfer was set to total energy and turbulence was set as shear stress transport to allow for heat transfer between the domains and the calculation of device efficiency (Menter, 1994). The inlet boundary was defined as total pressure and total temperature. The outlet was defined as static pressure, which was a sum of ambient pressure and pressure drop from the recuperator. Hub, shroud and blades were defined as no slip and smooth wall; however, the rotor shroud was set as counter rotating due to the movement of the rotor mesh.
Tip General Grid Interfaces (GGI) with general mesh connection was used for the tip of the rotor blade to allow for losses at the clearance between the blade and the rotor shroud. The RMS (root mean square) residual type with target of 0.0001 was selected together with physical timescale of 0.001 s to ensure convergence of the solution. The number of iterations was set to 200 to allow the solution to converge. Total-to-static turbine efficiency and generated power were monitored in each simulation as comparison criteria during the optimization and the fluid selection process.
The first task was to determine which fluid would provide the highest performance of the expander. Each refrigerant was modelled in CFX using the refrigerant molar mass, specific heat capacity, dynamic viscosity and thermal conductivity. REFPROP was used to find this data for each refrigerant at ambient temperature (25°C). The fluids were set as ideal gases. The lack of real-gas properties can influence the accuracy of results, but this is a typical assumption in the literature (Lopez, 2013). The boundary conditions at inlet and outlet and the rotor speed, were kept the same for all fluids. The total pressure at the inlet was set to 20 bar and total temperature was 370 K which is below the critical temperature for all tested fluids. The rotor speed was set to 45,000 rpm. The comparison criterion for the performance of the working fluids was the maximum power generated by the expander.
3.3.1 Expander modelling
Following the selection of the optimum working fluid, the rotor blades were optimized. The initial rotor design was obtained from the experimental prototype of (Alshammari et al., 2017).
Vista RTD was used to create a rotor similar to the baseline. It required data for operating conditions, efficiencies, fluid properties and flow angles, as well as dimensions of the expander.
The new rotor blade required meshing of the flow passage. This was done in TurboGrid. The flow path in through the blade passage was defined in Vista RTD and transferred to the geometry and to TurboGrid. The flow path defined boundaries like inlet, outlet, shroud, hub and blade walls. The inlet boundary of rotor was set to a radius of 35 mm to match with the outlet of the stator domain. The outlet boundary of the rotor was placed slightly away from the blade and the outflow block was created to represent the exhaust pipe where gases enter after the expander. Figure 7 presents the computational mesh used in this work. Figure 7A presents the mesh of the rotor and the outflow block. This is the domain on which the calculations were performed. Figure 7B demonstrates the mesh refinement at the shroud section of the domain. Similar refinement was done at the hub and at the blade surface. Mesh refinement is paramount for solution conversion and accuracy of the solution. When the domain of a single passage is meshed, it is copied around 360° to match the number of blades stated by the flow path in Geometry (Figure 7C). In this way, the software reduces computational cost.
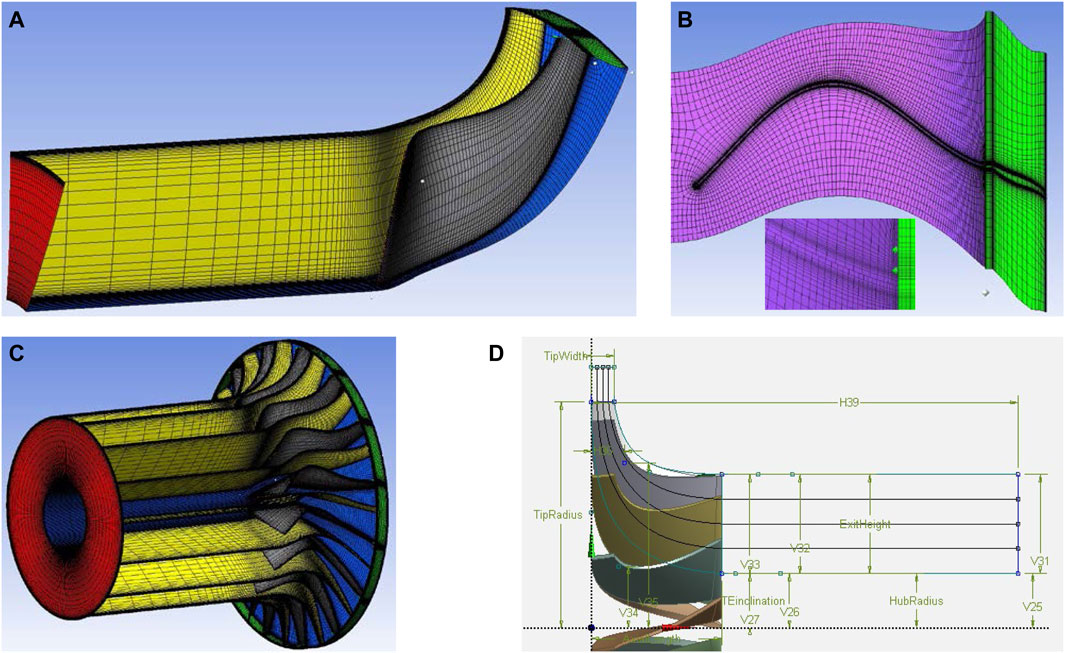
FIGURE 7. Computational mesh of: (A) rotor blade and outflow block, (B) refinement at shroud section, (C) full rotor and (D) Rotor blade geometry in BladeModeler.
3.3.2 Optimization setup
The main aim of this part of the work was to optimize the expander to achieve high power output. This was achieved through optimization of the rotor parameters such as the clearance between the blades and shroud, the geometry and thickness of the blades. Each parameter was optimized separately and implemented before starting the optimization of the next parameter.
The first parameter chosen for optimization was the clearance between blades and shroud wall. This parameter was adjusted in TurboGrid and various values were simulated and compared.
Other parameters were related to the shape of the blades and adjusted in BladeModeler. Figure 7D demonstrates various dimensions of rotor blade and five camber lines which denote the curvature of the blades across its span. These camber lines were optimized to achieve maximum power output of the expander.
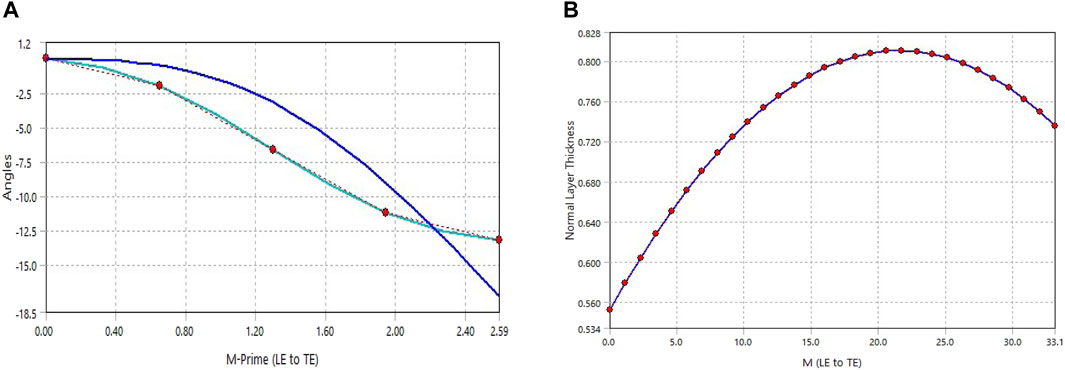
The rotor was created with Vista RTD. The first camber line was optimized within Vista RTD. Camber lines 2–5 were built based on the shape of the first one. Figure 8A shows the optimization points of the first camber line. Each point represents an angle and its position along the blade. The position of points was kept constant, and their angle was optimized for the best performance. The thickness of the blade was also optimized at each camber line. Figure 8B shows the thickness variation along the blade. To save time all the points were optimized simultaneously by shifting them laterally at each camber line. When the best thicknesses for each camber line were determined they were combined in the final rotor geometry, resulting in an optimized expander.
3.3.3 Finite element analysis
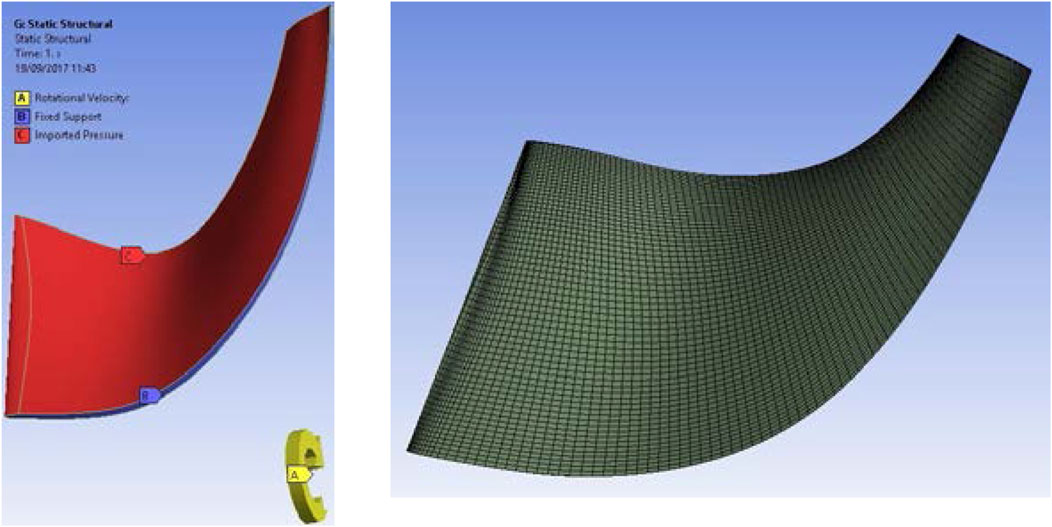
The final stage of the rotor optimization was to ensure that the optimized rotor can withstand the pressures and temperatures which were calculated during the CFD simulations. The optimized geometry of the rotor blade was imported to the static structural module, where it was meshed for FEA analysis. Finite element analysis was conducted to validate the feasibility and durability of the new rotor. Results from the CFD simulations were, also, imported to the static structural module to provide values for temperature and pressure on the blade during operation. Figure 9A shows the boundary conditions used for the finite element analysis. The fixed support was defined at the root of the blade where it joins the hub. The rotational speed was defined around the z-axis and with the maximum value at which the expander operates.
Titanium alloy and aluminum alloy were selected for the FEA analysis and comparison. Figure 9B demonstrates the mesh for the FEA analysis of the rotor blade (512 k nodes). To validate the rotor design during operation of the expander, the FEA setup required pressures and temperatures to which the rotor is exposed during high-speed rotation. Those parameters were imported from the CFD simulation. Moreover, the two materials were modelled for comparison of durability and cost-effectiveness.
Another important aspect related to the design of the blade was to find the natural frequencies of the blade to avoid resonance at certain speeds. The geometry of the optimized expander blade was imported into the modal analysis where it was meshed. The results of this simulation determined which frequencies should be avoided during the operation of the expander.
4 Results and discussions
4.1 GT-power engine data
The results of the engine simulations on GT-Power, showed that the maximum torque achieved was 1,079 Nm at 1,500 rpm. In comparison, the measured engine output torque was 1108.2 Nm. The maximum error across the range of engine speed was 4%. The torque simulation results are compared to the engine output on Figure 10A. The maximum engine power calculated by the simulations was 202 kW at 2,100 [rpm], while the real engine has the maximum output of 207 kW at 2,300 rpm. Figure 10B compares the simulated and actual engine power output as a function of engine speed. The brake efficiency values across the range of engine speed, from the simulation, are presented in Figure 10C. The maximum value of 38.42% was obtained at 1,900 rpm. The simulated engine performance errors were considered acceptable to represent an engine of this class.
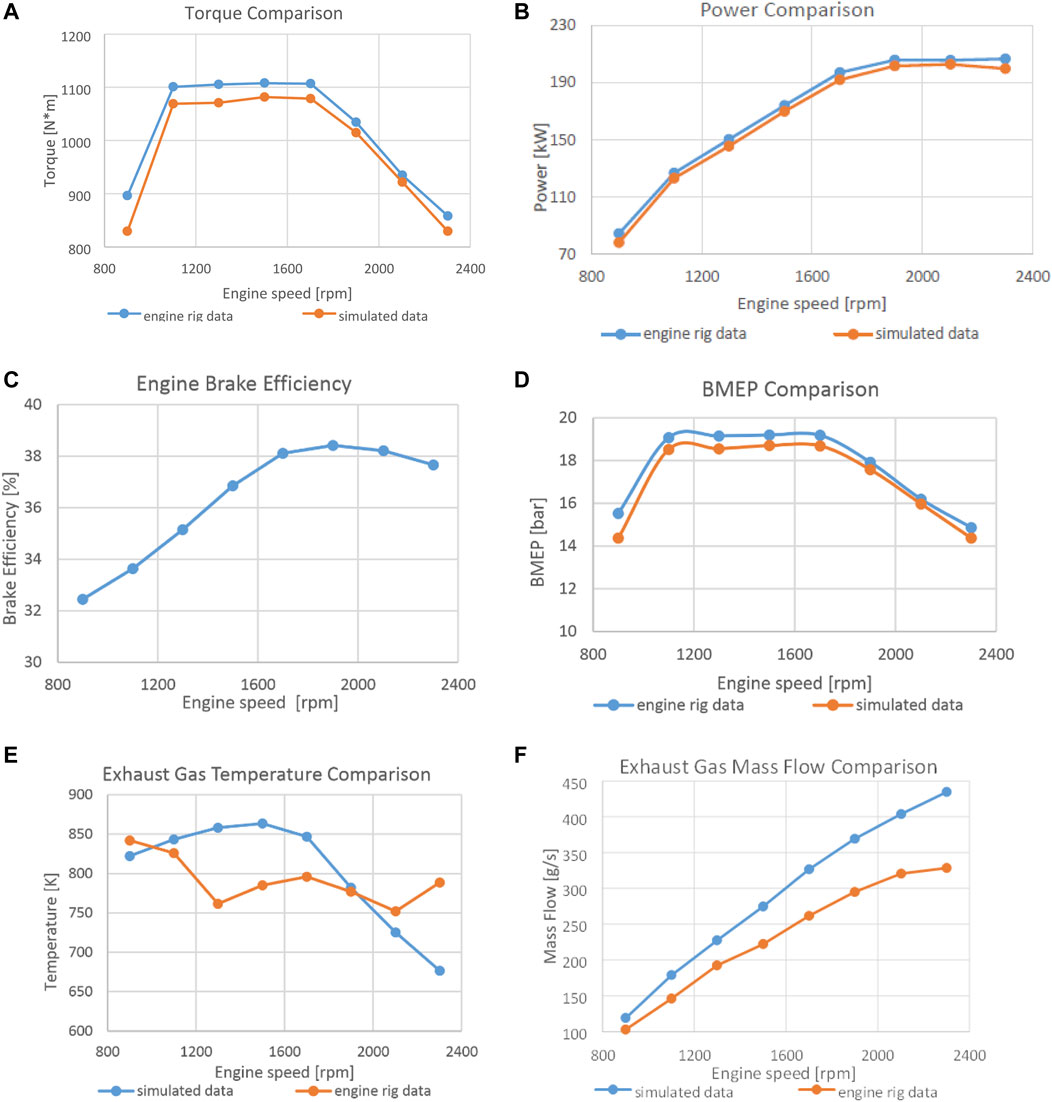
FIGURE 10. Engine experimental data compared to GT-power simulation results, (A) torque, (B) power, (C) break efficiency, (D) BMEP, (E) exhaust gas temperature and (F) exhaust fas mass flowrate.
The Break Mean Effective Pressure (BMEP) values across the engine speed range, from the engine rig and the simulation are compared in Figure 10D. Both experimental and simulation data follow the same trend. The biggest difference them is observed at idle, with a difference of 7%. Experimental and simulation data of exhaust temperature are presented in Figure 10E. Simulated data follow a parabolic profile with a maximum of 863.5K at 1,500 rpm. Data from the rig show a maximum value of 842K at idle. Values for exhaust mass flow are presented in Figure 10F. Both engine rig and simulation results, follow the same trend and show the highest values for mass flow at 2,300 rpm. The results show an almost linearly increasing trend of exhaust-gas mass-flow with engine speed.
Figure 11 presents information calculated from the GT-Power simulation results. Figure 11A presents the average fuel mass-flowrate as a function of engine speed. The Break Specific Fuel Consumption (BSFC) is calculated in Figure 11B (in kW.h of energy). The lowest BSFC was obtained at 1,300 rpm. The brake specific fuel consumption at this point of operation has the value of 230 g/kW-h.
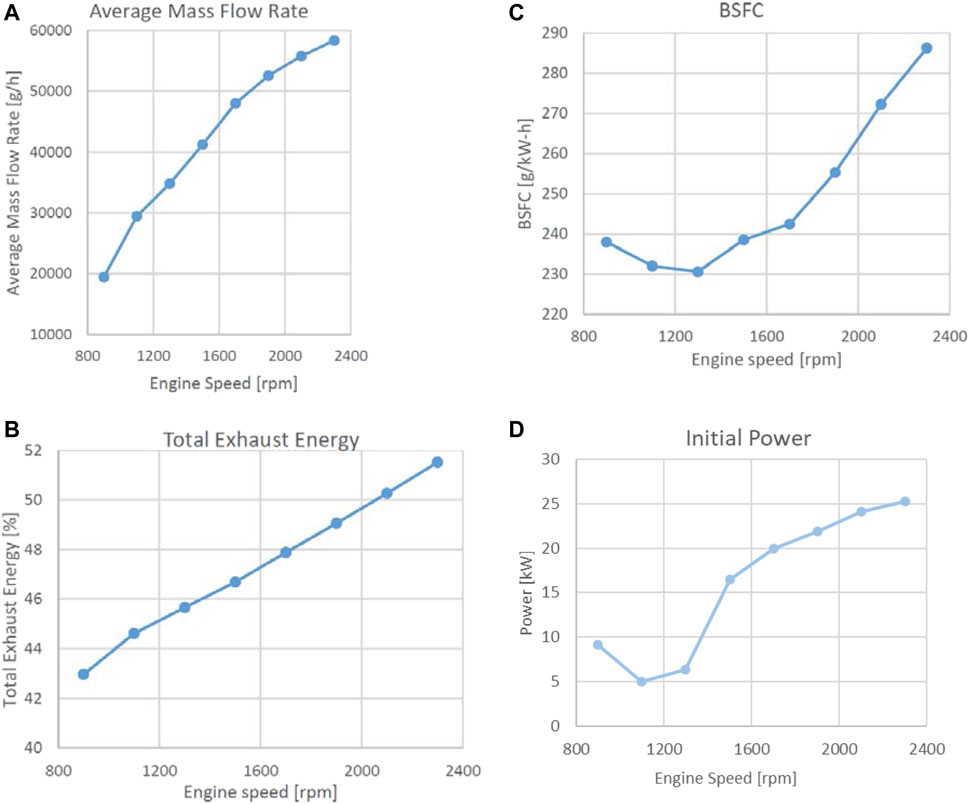
FIGURE 11. Engine simulation results of: (A) average fuel mass flowrate, (B) BSFC, (C) percentage of fuel energy exhausted and (D) power output of the initial non-optimized ORC.
The major factor which influences the brake power output of the engine is the heat lost through the exhaust system. The energy percentage lost in the exhaust gases is presented in Figure 11C. These losses increase with increased engine speed. The maximum percentage of lost energy through the exhaust gases, for this engine, reached around 52% at around 2,300 rpm. This calculation is of importance, as this is represents the amount of wasted energy available to the ORC system for energy recovery.
Figure 11D presents the ORC power output of the initial non-optimized design of the ORC. At low engine speed, the power recovered from the exhaust heat is low, of the order of 5–10 kW. At higher engine speeds, above 1,500 rpm, the recovered energy becomes more significant. At the maximum engine speed of 2,300 rpm, the ORC power output reaches 25 kW.
4.1.1 Pump speed optimization
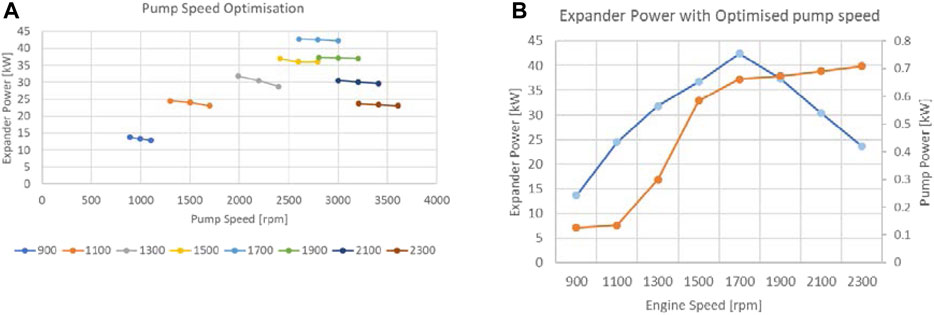
The first parameter optimized from the case setup is the pump speed. According to the data from test rig, the pump’s total power is in the range of 0.2–1 kW. In Figure 12A the data at the optimum three pump speeds are represented for each case of engine speed. The optimum pump speed was selected based on the expander power. The highest expander output power is around 42 kW, achieved between 2,500 and 3,000 rpm pump speed. The maximum expander power is achieved at 1,700 rpm engine speed. In Figure 12B the final setup with the optimized pump speed is shown. The peak power was 42.66 kW, for the engine running at 1,700 rpm. The pump total power was found to be within the limits known from the test rig.
4.2 ANSYS
4.2.1 CFD performance of ORC fluids
The first stage of CFD analysis of ORC system is to determine which fluid would provide the optimum performance of the expander. Six fluids were modelled with the baseline expander, Table 5 shows the main properties of these fluids. The fluid with the lowest environmental impact is Novec 649. At the opposite side is R236fa, having a major impact in global warming.
For a fair comparison and generator constant speed requirement, each fluid was modelled using the same boundary conditions and rotational speed of rotor as was mentioned previously. For the inlet boundary condition, total temperature was set to 370 K to ensure that the critical point of fluid is not reached. The total pressure at the inlet was set to 20 bar which corresponds to average pressure before expander in the ORC system from GT-Power simulations. The outlet static pressure was set to 1.0908 bar, which is the sum of ambient pressure and average pressure drop in the recuperator of the ORC system. The rotational speed of the rotor was set to 45,000 rpm.
Table 6 presents the results of CFD simulations of the expander with various fluids. The highest efficiency of 72.96% was achieved using R113. The highest ratios of total pressure and temperature were achieved using R123a. The highest power was generated by R134a and was equal to 48.2 kW. This fluid was selected for further analysis as it produced the highest power which was the main requirement for this analysis in order to investigate the FEA and materials aspects under the highest power possible.
4.2.2 Rotor optimization
The optimization process begun with manufacturing clearance adjustment. Figure 13A shows various clearances from 0.15 to 0.4 mm and the corresponding power generated by the ORC system. The general trend of increasing power with decreasing clearance was confirmed. The maximum power was generated with a clearance of 0.15 mm. This power is a 1.8% increase compared to the original. However, reducing the clearance substantially increases the manufacturing cost. It was therefore decided to keep the original clearance of 0.4 mm, which is also typical for such applications.
The next parameter for optimization was the angle theta of the first camberline. Figure 13B represents optimization results of the angle theta. It is apparent that the solution oscillates and lacks a clear trend. However, the margins of this oscillation are ±0.5 kW. The peak power was achieved at an angle of 1°. This theta angle optimization provided an increase in power of 0.13% compared to the original power.
The most important step was the optimization of the blade curvature which was done through five points at the camberline 1. As mentioned previously in methodology other camberlines will be automatically interpolated from the first one. Figure 14A demonstrates optimization results of point 1–5. For point 1, there is some oscillation of the results, however, a general trend is clear. The power increases with increasing angle. At an angle of 4.5° the maximum power was achieved.
Optimization of point 2 produced similar trend and some fluctuations. The maximum power was obtained at 6.7°. For point 3, the generated power increases with the angle increase. The maximum power was reached at 17.5°. This provided 2.89% increase in power compared to the previous optimization point. During optimization of point 4, the best angle was −12°. It provided an increase in power by 5.47% compared to the previous point. During optimization of point 5 the maximum power achieved was at an angle of −18 which is 0.2% increase compared to the original angle of −13.5°.
The last stage of the turbine optimization was the optimization of the blade thickness at each camberline. Figure 14B shows that the smallest thickness of camberline 1 provides a higher power output (at 0.4 mm). The same trend can be seen on all camberlines thickness optimizations. When the optimal thicknesses were implemented into the final rotor geometry, the simulation provided a power output which was 11.3% higher than the power output of the initial non-optimized rotor.
Figure 15 demonstrates velocity contours and vectors at the initial expander. It is clear that the flow meets the rotor blade at such an angle as to impart little momentum. The low velocity region at the inlet of the rotor demonstrates where the flow acts more effectively to impart momentum on to the blades. At the middle of the rotor blade there is another low velocity region, however the vectors indicate that the flow meets the blade from the opposite direction, which slows down the rotation of the blade leading to lower power output.
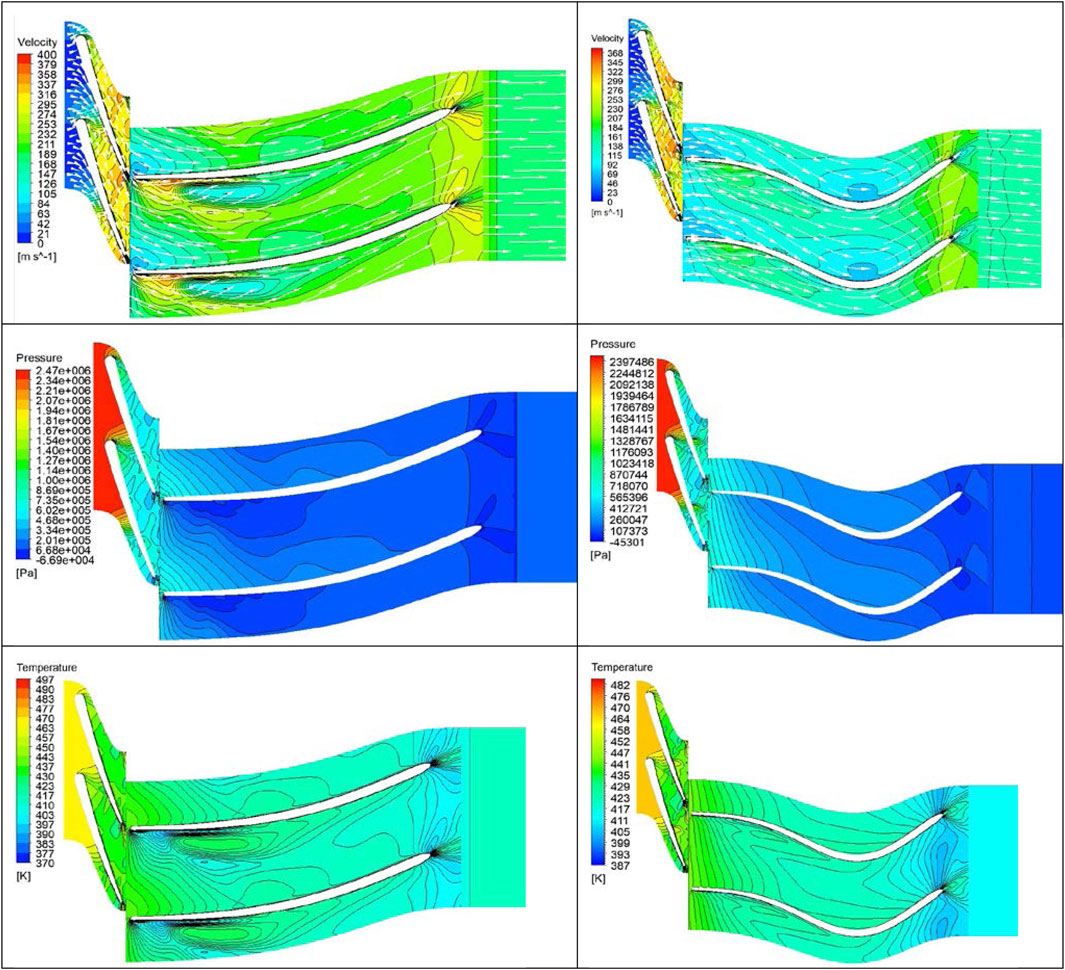
FIGURE 15. The left column represents the initial expander and the right column the optimized expander. From top to bottom, the row presents the velocity contour, the static pressure and the static temperature.
Figure 16B demonstrates the velocity contours and vectors at the optimized expander. Compared to the initial expander, shown in Figure 16A, the flow meets the optimized rotor blade at the inlet and continues to push it almost until the outlet. This provides better distribution of the flow and creates two low velocity regions (at the inlet and middle section of the blade) where the flow rotates the blades more effectively. Unlike the initial expander, the flow does not meet the blades from the opposite direction, meaning that torque is higher and power output is increased. Overall, the initial expander had the average flow velocity across the rotor at around 180 m/s, whereas the optimized expander had it at around 110 m/s. This means that the flow energy was transferred more efficiently to the optimized rotor blades, generating higher power at the shaft.
Figures 16C, D, demonstrate contour plots of static pressure in the initial and optimized expander. Similar to previous results, the initial expander has a rapid drop of pressure from the inlet of the rotor, this is because the flow energy is transferred more efficiently there, rather than along the full length of the blade. In the case of the optimized expander, the pressure drops gradually along the whole blade length and energy of the flow is transferred more effectively. At the outlet of the optimized rotor, static pressure drops to almost 107 kPa whereas for the initial rotor it drops only to 200 kPa, meaning that the optimized expander has a higher pressure drop at the stage.
Figures 16E, F, demonstrate static temperature contours in the initial and optimized expander. Like pressure contours, the static temperature drops rapidly from the inlet of the initial rotor. For the case with the optimized rotor, the temperature drops gradually along the blade. Overall, static temperature at the initial rotor was higher than at the optimized rotor. At the rotor outlet temperature, it dropped to around 423 K for the initial and to 411 K for the optimized expander. This means that the optimized rotor provides a higher temperature drop at the stage, thus a higher power output is extracted from the expander.
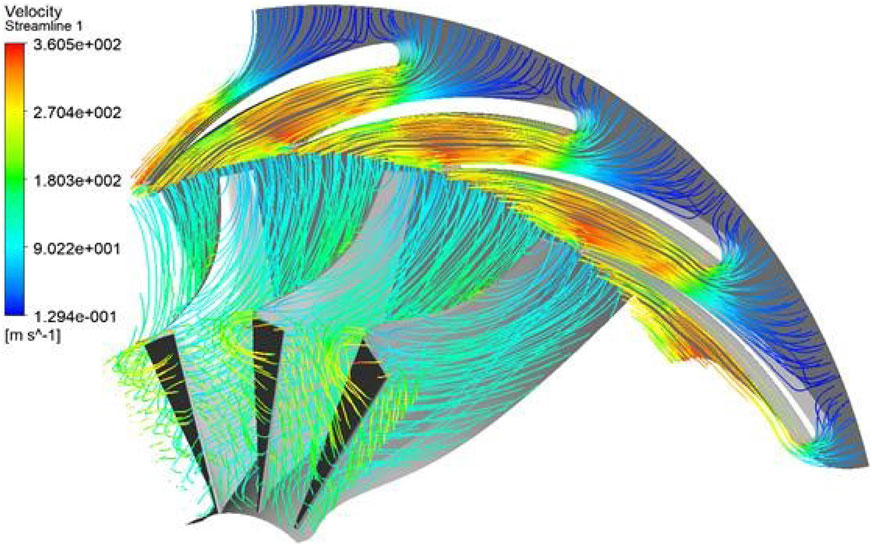
Figure 16 shows the velocity streamlines through the expander. It is apparent that the highest velocity is achieved at the end of stator blades, which helps to improve the performance of expander. There are some losses at the clearance between the rotor blades and the shroud as some streamlines are going over the rotor blades. These losses are normal for all turbines and can be minimized by reducing the clearance.
4.2.3 Generation of new expander map for GT power
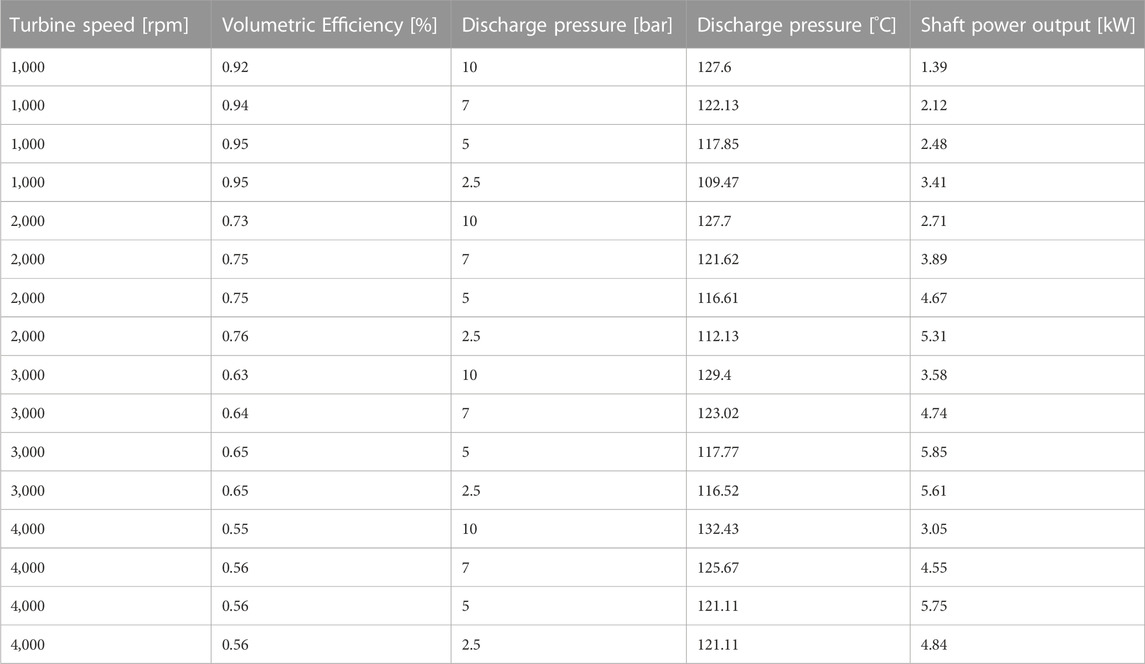
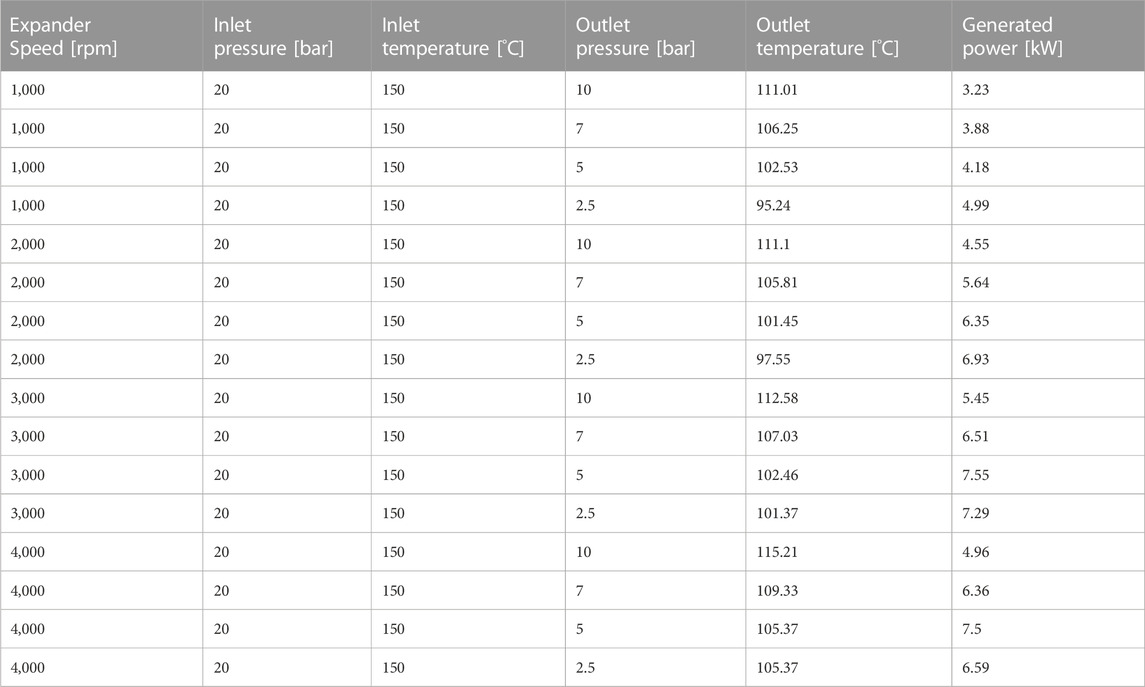
To test the optimized expander with the engine a new expander map is required for GT Power. To create this map, the expander was simulated with various rotational speeds and boundary conditions. Based on the original map from GT Power, the inlet pressure and temperature were kept constant across all test points and the outlet pressure was varied from 10 to 2.5 bar. At least four different expander speeds had to be tested with four different outlet pressures. Generated power and outlet temperature were recorded for each simulation. Table 7 presents the entire data collected for the new optimized expander map.
4.2.4 FEA validation and materials comparison
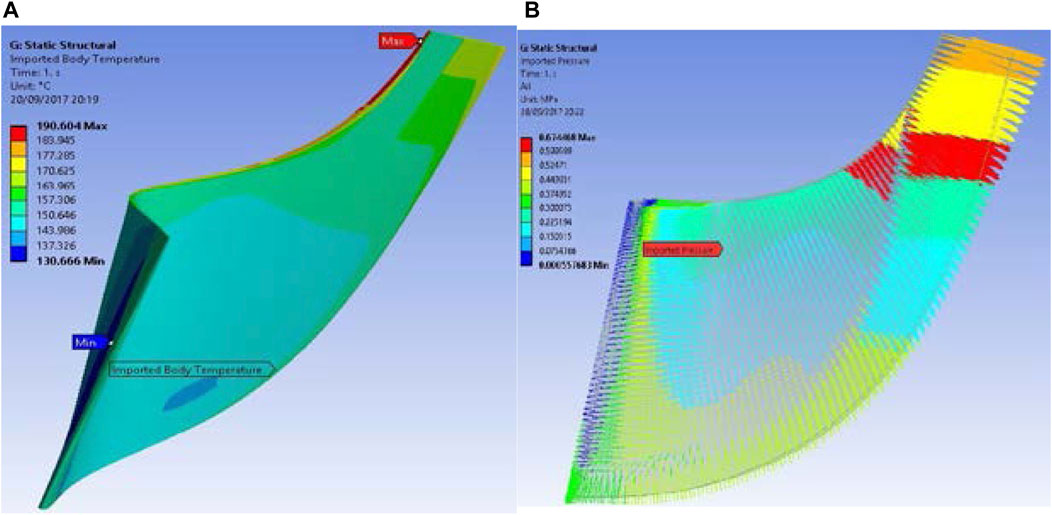
Figure 17A shows the temperature on the rotor blade during the expansion operation. The maximum temperature of 190.6°C was obtained at the tip of the blade next to the inlet of the blade passage. The lowest temperature of 130.6°C was near the exit of the passage on the side of the blade. The mean blade temperature was around 160°C. Figure 17B presents the pressure vectors. The highest pressure of 6.7 bar was observed at the inlet region of the blade passage where the flow directly impacts the rotor blade. The lowest pressure region, of 0.00558 bar was at exit of the passage, where the flow exits the rotor.
The first row of Figure 18 presents the deformation of the rotor blades under the working conditions. In the first column, titanium alloy was used. In the second column, aluminum alloy was used. The highest deformation is observed at the exit of the blade. The values of deformation are within the acceptable limits, and thus the blade geometry needs no further optimization for strengthening. The second row of Figure 18 shows the Von-Mises stress from the blades. The Von-Mises stress is lower than the yield of both materials. In the case of Titanium alloy [Commercially Pure CP-Ti UNS R50700 Grade 4 (SS)] the yield stress is 500 MPa and for the aluminum alloy (2014-T6) the yield stress is 414 MPa (Zheng et al., 2022).
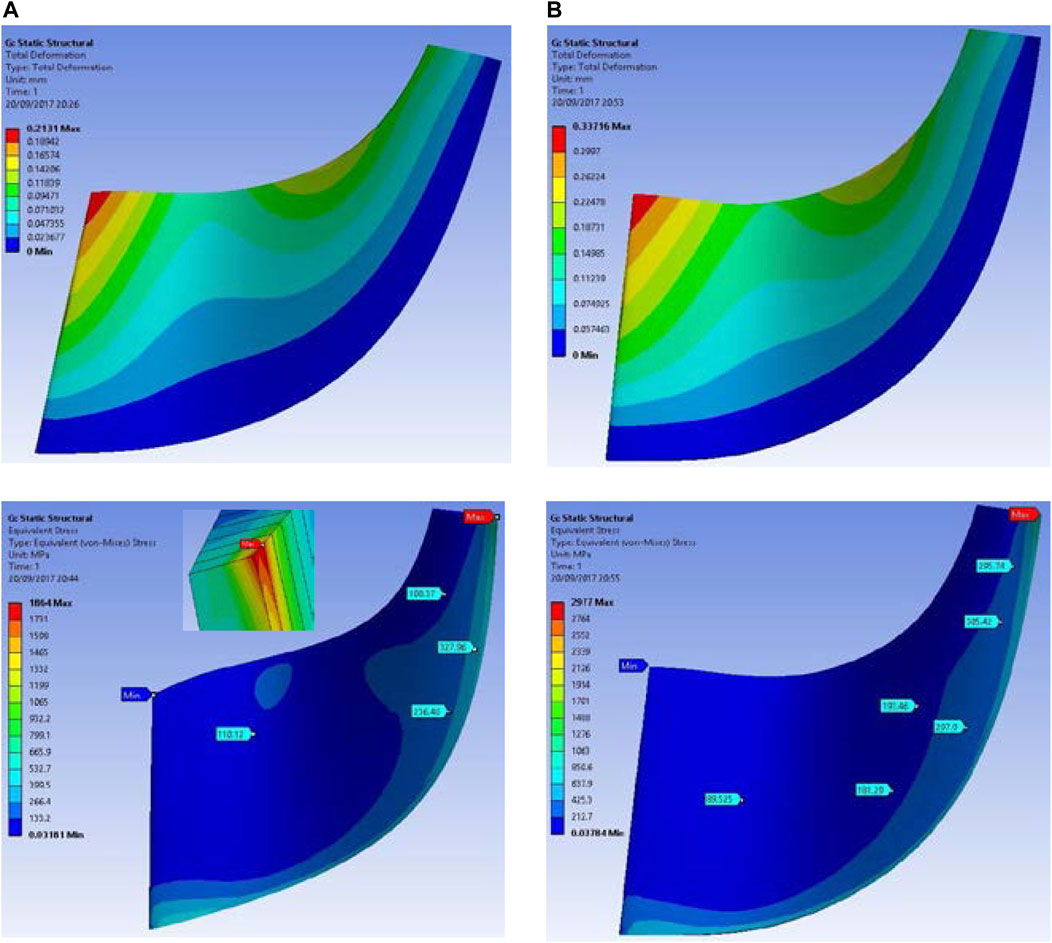
FIGURE 18. FEA results of optimized blade. Deformation of blade for: (A) Titanium alloy, (B) Aluminum alloy.
The maximum values of stress were obtained at the edge of the blade, at a sharp corner. It is well known that sharp angles act as stress concentration points. The data obtained from the surface of the blade prove the fact that the rotor can operate under the present working conditions without any concern.
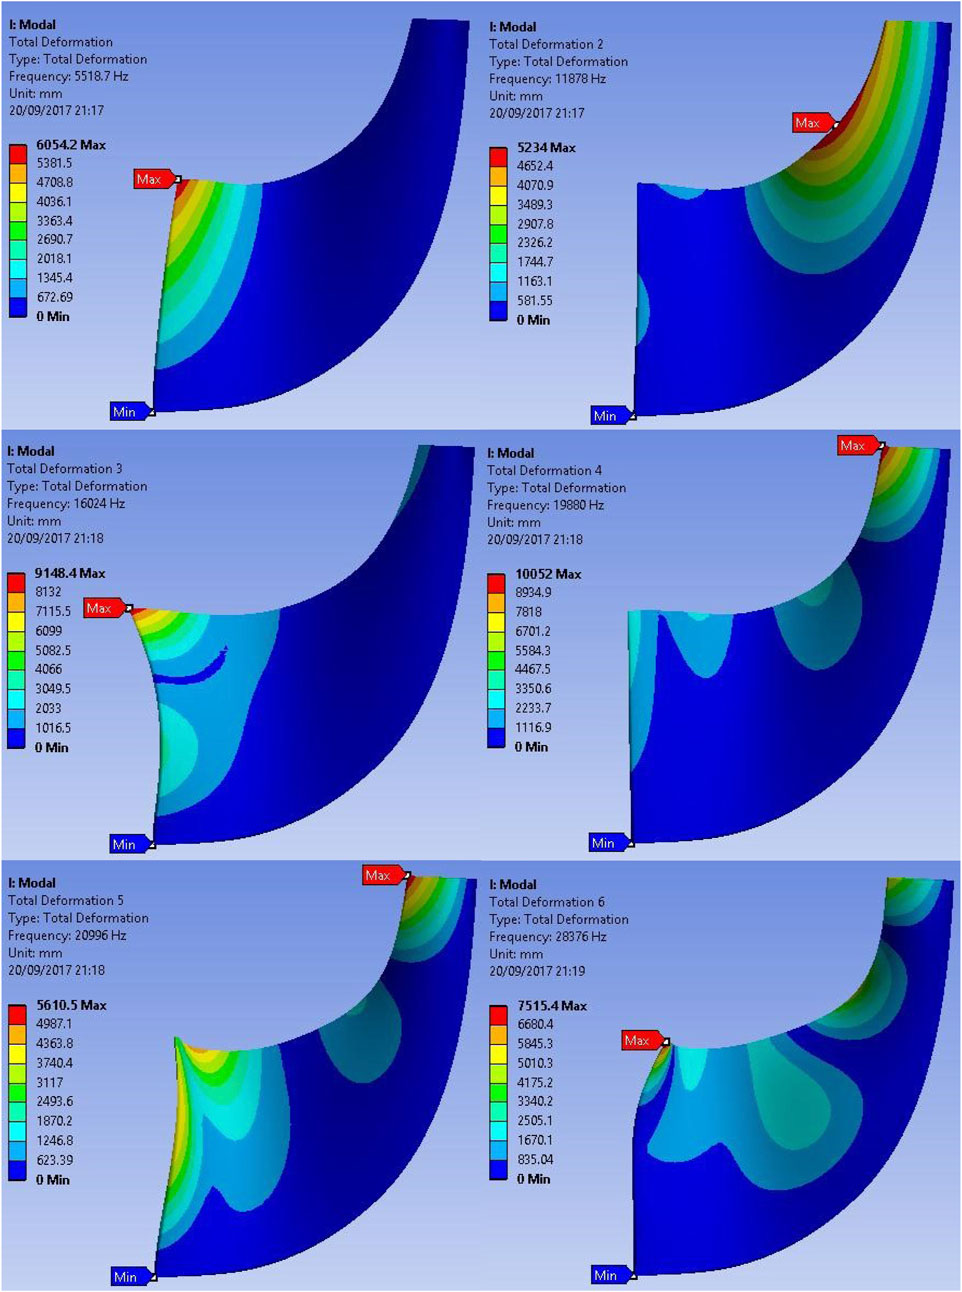
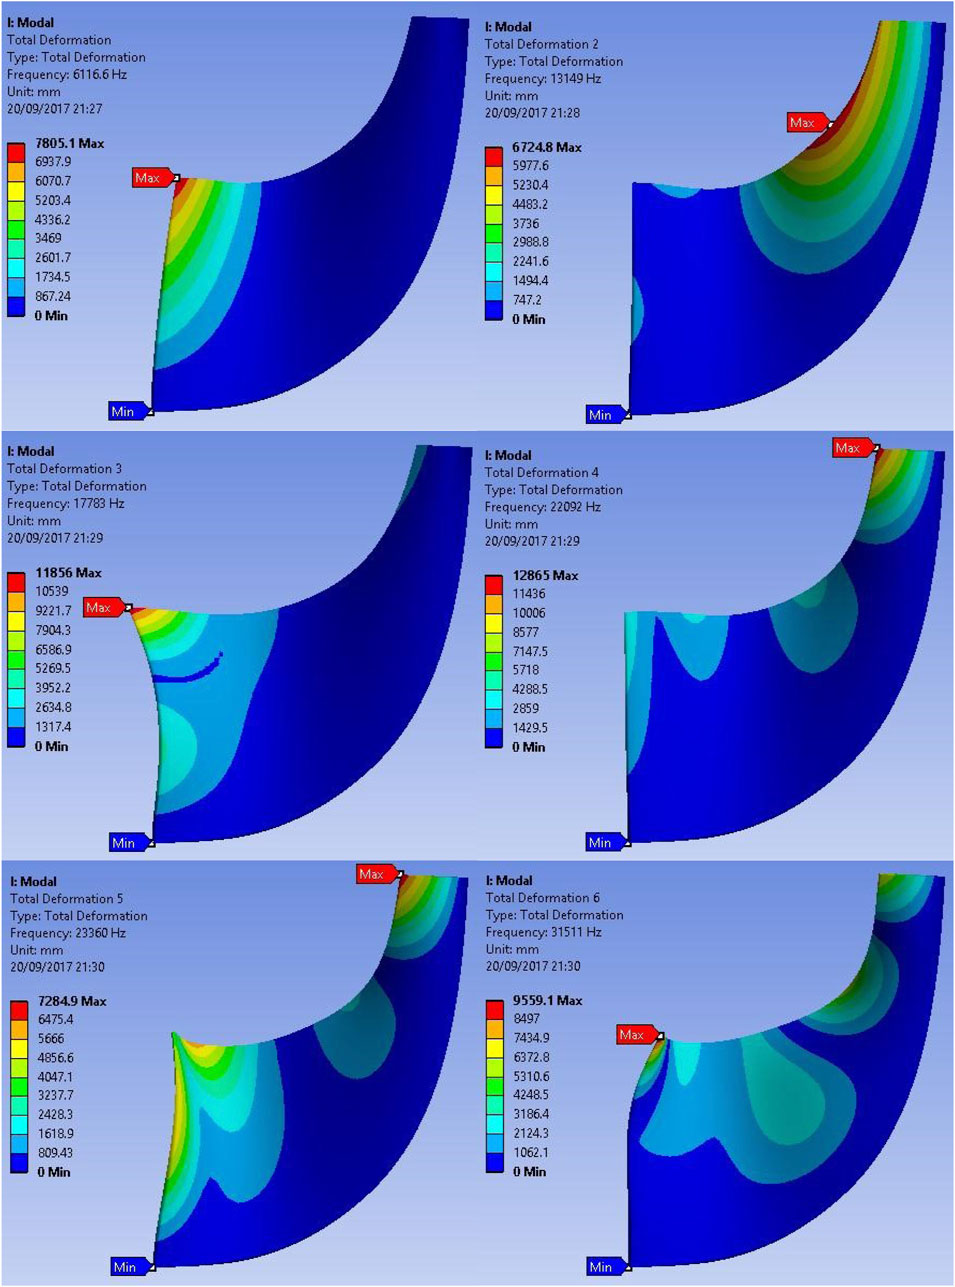
Another aspect of FEA analysis is to check the vibrational excitation of the rotor blade during rotation. Table 8 shows six modes of the rotor blade with various materials. For each mode the natural frequency of the blade is shown. If the rotor operates at these frequencies, the dynamic vibration of the blades would dramatically increase, causing fatal deformation and eventual failure. When those frequencies are converted into rotational speed it is evident that the rotor would never reach those speeds (minimum speed is 331,000 rpm) and therefore it will not fail due to vibrational excitation. It is concluded from this analysis that both the aluminum and titanium alloys are safe to use.
Figures 19, 20 show contours of total deformation for six modes. For both materials, the maximum deformation appears more often at the tip of the blade at the inlet and outlet of the passage. In addition, contours are almost identical for both materials, but the titanium alloy exhibits lower values for total deformation in all six modes. This means that titanium would be would be preferred for very high speed (and small size of) turbine applications due to lower total deformation.
4.2.5 Material selection and cost comparison
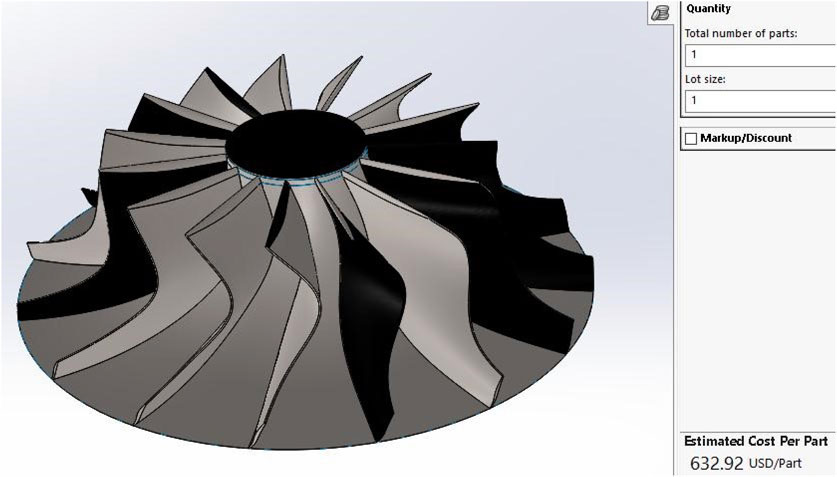
Due to the relatively low temperatures and stresses applied to the turbine, the aluminum alloy can be considered for the rotor design. Generally, aluminum alloys are cheaper than titanium alloys. Additionally, aluminum alloy components are cheaper to manufacture than titanium alloy components. Currently, aluminum alloys are used on the turbine of most experimental facilities (Alshammari et al., 2018). At the time of writing, the price of the aluminum alloy was 2.233$/kg. Considering the size of the rotor and the density of aluminum, approximately a 0.5$-block of Aluminum has to be machined to produce the rotor. A coarse estimation of the manufacturing cost was done using Solidworks software, seen in Figure 21. The price of manufacturing the rotor with the corresponding dimensions is about $633 (due to the complexity of the part and the high precision required for this application). If the turbine is mass produced, the price can be reduced significantly. Regarding the titanium alloy (potentially for those application requiring high pressure and temperature and high stress) following the same logic, the titanium alloy price is about 3.77$/kg (InvestmentMine, 2017). The price of the Titanium block which must be machined rises to 1.32$/block. The price of manufacturing rises as well roughly by 10%–15% due to tooling costs.
Solidworks calculated the mass properties of the rotor made from both Titanium alloy and Aluminum alloy. The rotor made of aluminum alloy is 37.91% lighter than the rotor made from the Titanium alloy. This mass reduction of rotor will lead to a quicker response of the expander, and thus better performance of the ORC system.
4.3 Final design
After the new ORC map was generated in ANSYS, the ORC system was updated in GT-Power and the engine operation simulated again, generating the final results presented in Figure 22. The maximum power achieved by the ORC system with the optimized expander map is 52.79 kW at 1,700 rpm, while the overall performance increased by about 20%.
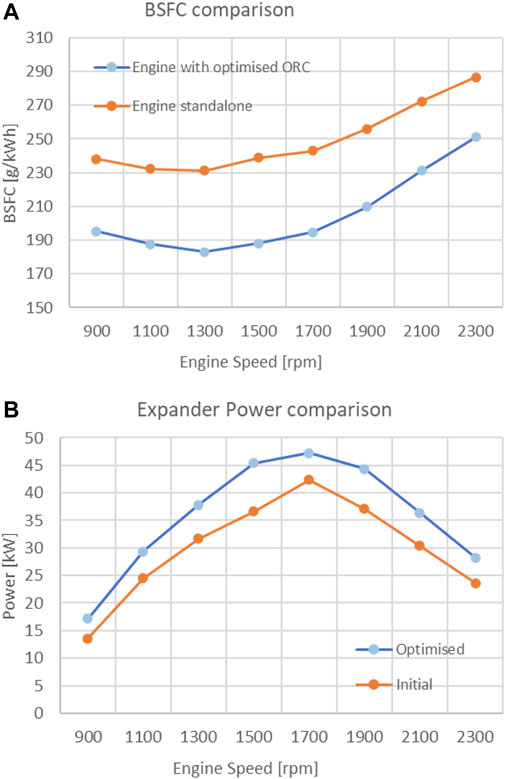
FIGURE 22. Comparison between optimized ORC (A) BSFC with standalone engine and (B) expander power with initial ORC map.
The fuel consumption of the engine was improved across the engine speed range. The BSFC was reduced on average around 17%. Similar levels of fuel consumption reduction is recorded in the literature (Teng and Regner, 2007). The lowest BSFC value of 183 g/kW-h was obtained at 1,300 rpm.
5 Conclusion
The innovation of this work is the demonstration that an ORC system can be implemented on heavy-duty vehicles. The expander of an ORC system was coupled to a 7 L diesel engine and optimized for the working fluid, rotor geometry, materials and clearance. The optimum clearance between the rotor blades and shroud, was calculated at 0.4 mm. Refrigerant R134a was identified as the optimum working fluid. The rotor geometry was optimized using ANSYS. The expander power output was improved from 76.9 to 85.6 kW and the expander efficiency was improved from 65.47% to 72.96%.
FEA analysis and vibration analysis followed. Titanium and aluminium alloys were both considered. Titanium alloys were considered due to their extreme strength potentially for very high pressure applications (but below 400
Further, it was identified that heavy-duty vehicles can waste up to 50% of the fuel energy in the exhaust system. Stricter regulations and environmental challenges, make implementation of waste heat recovery systems more attractive. This work calculated that an ORC implemented on heavy-duty vehicles, could reduce fuel consumption by up to 17%. Similar values are also reported in the literature (Teng and Regner, 2007). The economic impact of an ORC system is presented in Table 9. A typical heavy-duty vehicle monthly journey of 15,000 km was assumed, with a typical current fuel price of £1.207 per litre. The fuel consumption calculated in this work was used (4,500 L for the standalone engine and 3,735 L for the engine integrated with the optimized ORC). A saving of £923 per month per heavy-duty vehicle was calculated.

TABLE 9. Economic impact of ORC over transport system on a 15,000 km journey and with fuel price of £1.207/L
Data availability statement
The original contributions presented in the study are included in the article/Supplementary Material, further inquiries can be directed to the corresponding author.
Author contributions
AD: Data curation, Software, Writing–original draft. AP: Conceptualization, Investigation, Writing–original draft, Supervision. FA: Formal Analysis, Investigation, Writing–review and editing. PS: Formal Analysis, Investigation, Visualization, Writing–original draft. MK: Formal Analysis, Investigation, Writing–review and editing.
Funding
The author(s) declare that no financial support was received for the research, authorship, and/or publication of this article.
Conflict of interest
The authors declare that the research was conducted in the absence of any commercial or financial relationships that could be construed as a potential conflict of interest.
Publisher’s note
All claims expressed in this article are solely those of the authors and do not necessarily represent those of their affiliated organizations, or those of the publisher, the editors and the reviewers. Any product that may be evaluated in this article, or claim that may be made by its manufacturer, is not guaranteed or endorsed by the publisher.
References
Alshammari, F., Karvountzis-Kontakiotis, A., Pesiridis, A., and Minton, T. (2017). Radial expander design for an engine organic rankine cycle waste heat recovery system. Energy Procedia 129, 285–292. doi:10.1016/j.egypro.2017.09.155
Alshammari, F., Pesyridis, A., Karvountzis-Kontakiotis, A., Franchetti, B., and Pesmazoglou, Y. (2018). Experimental study of a small scale organic Rankine cycle waste heat recovery system for a heavy duty diesel engine with focus on the radial inflow turbine expander performance. Appl. Energy 215, 543–555. doi:10.1016/j.apenergy.2018.01.049
ANSYS (2017). ANSYS. Available at: http://www.ansys.com (Accessed June 2, 2017).
Automotive Council UK (2017). HEVTCP. Available at: http://www.apcuk.co.uk/wp-content/uploads/2015/10/COM-OH-Roadmap.pdf (Accessed May 30, 2017).
Bao, J., and Zhao, L. (2013). A review of working fluid and expander selections for organic Rankine cycle. Renew. Sustain Energy 24, 325–342. doi:10.1016/j.rser.2013.03.040
Bin Ahmad, M. S., Pesyridis, A., Sphicas, P., Mahmoudzadeh Andwari, A., Gharehghani, A., and Vaglieco, B. M. (2022). Electric vehicle modelling for future technology and market penetration analysis. Front. Mech. Eng. 8, 896547. doi:10.3389/fmech.2022.896547
CFD ONLINE (2017). CFD. Available at: https://www.cfdonline.com/Forum (Accessed June 2, 2017).
Chen, H., and Baines, N. (1994). The aerodynamic loading of radial and mixed-flow turbines. ISESCO J. Sci. Technol. 36, 63–79. doi:10.1016/0020-7403(94)90007-8
Chen, L., Habib, B., and Inskip, N. (2015). Aerodynamic design of radial inflow turbine for medium scale organic rankine cycle system. J. Clean. Prod. 251 119713, doi:10.1016/j.jclepro.2019.119713
Costall, A. W., Gonzalez Hernandez, A., Newton, P. J., and Martinez-Botas, R. F. (2015). Design methodology for radial turbo expanders in mobile organic rankine cycle applications. Appl. Energy 157, 729–743. doi:10.1016/j.apenergy.2015.02.072
European Comission (2017). CO₂ emission performance standards for cars and vans. Available at: https://ec.europa.eu/clima/policies/transport/vehicles/cars_en (Accessed May 29, 2017).
Fiaschi, D., Innocenti, G., Manfrida, G., and Maraschiello, F. (2015a). Design of micro radial turboexpanders for ORC power cycles: from 0D to 3D. Appl. Therm. Eng. 99, 402–410. doi:10.1016/j.applthermaleng.2015.11.087
Fiaschi, D., Manfrida, G., and Maraschiello, F. (2012). Thermo-fluid dynamics preliminary design of turboexpanders for ORC cycles. Appl. Energy 97, 601–608. doi:10.1016/j.apenergy.2012.02.033
Fiaschi, D., Manfrida, G., and Maraschiello, F. (2015b). Design and performance prediction of radial ORC turboexpanders. Applied Energy.
Gamma Technologies (2014). GT-suite "engine performance application manual" version 7.5. Gamma Technologies, Inc.
Hoang, A. T. (2018). Waste heat recovery from diesel engines based on Organic Rankine Cycle. Appl. Energy 231, 138–166. doi:10.1016/j.apenergy.2018.09.022
InvestmentMine (2017). InvestmentMine. Available at: www.infomine.com (Accessed August, 2017).
Jiménez-García, J. C., Ruiz, A., Pacheco-Reyes, A., and Rivera, W. (2023). A comprehensive review of organic rankine cycles. Processes 11, 1982. doi:10.3390/pr11071982
Jones, A. C. (1996). Design and test of a small, high pressure ratio radial turbine. J. Turbomach. 118 (2), 362–370. doi:10.1115/1.2836651
Jung, H., and Krumdieck, S. (2014). Meanline design of a 250kW radial inflow turbine stage using R245fa working fluid and waste heat from a refinery process. Energies. doi:10.1177/095765091663796
Kirmse, C., Haslam, A., and Markides, C. (2016). Comparison of a novel organic-fluid thermofluidic heat converter and an organic rankine cycle heat engine. Energies 9, 479. doi:10.3390/en9070479
Lopez, E. (2013). Study on a radial turbine stage with inlet guide vanes for an orc process with an electrical output of 3.5kW. Stuttgart: Univeritat Stuttgart.
Menter, F. (1994). Two-equation eddy-viscosity turbulence models for engineering applications. AIAA 32, 1598–1605. doi:10.2514/3.12149
Oil Crude Price (2017). Oil Crude price. Available at: https://www.oilcrudeprice.com/oil-price-forecast/ (Accessed May 29, 2017).
Park, B. S., Usman, M., Imran, M., and Pesyridis, A. (2018). Review of organic rankine cycle experimental data trends. Energy Convers. Manag. 173, 679–691. doi:10.1016/j.enconman.2018.07.097
Ricardo, M. B., Apostolos, P., and Yang, M. (2011). Overview of boosting options for future downsized engines. Sci. China Technol. Sci. 54, 318–331. doi:10.1007/s11431-010-4272-1
Ringler, J., Seifert, M., Guyotot, V., and Hübner, W. (2009). Rankine cycle for waste heat recovery of IC engines. SAE Int. 2, 67–76. doi:10.4271/2009-01-0174
Schuster, A., Karellas, S., Kakaras, E., and Spliethoff, H. (2009). Energetic and economic investigation of organic rankine cycle applications. Appl. Therm. Eng. 29, 1809–1817. doi:10.1016/j.applthermaleng.2008.08.016
Sphicas, P., Pickett, L. M., Skeen, S., Frank, J., Lucchini, T., Sinoir, D., et al. (2017). A comparison of experimental and modeled velocity in gasoline direct-injection sprays with plume interaction and collapse. SAE Int. J. Fuels Lubr. 10 (1), 184–201. doi:10.4271/2017-01-0837
Sphicas, P., Pickett, L. M., Skeen, S. A., Frank, J. H., and Parrish, S. (2018). Interplume velocity and extinction imaging measurements to understand spray collapse when varying injection duration or number of injections. At. Spr. 28 (9), 837–856. doi:10.1615/AtomizSpr.2018025956
Teng, H., and Regner, G. (2007). Waste heat recovery of heavy-duty diesel engines by organic rankine cycle Part I: hybrid energy system of diesel and rankine engines. SAE Int. doi:10.4271/2007-01-0537
Visavale, G. (2017). LearnCAx. Available at: https://www.learncax.com/knowledge-base/blog/by-category/cfd/item/3629-cfdmodeling-approach-for-turbomachinery-using-mrf-model (Accessed June 2, 2017).
Wei, M., Song, P., Liu, Z., Emhardt, S., Tian, G., and Huang, Z. (2016). The fluid-thermal-solid coupling analysis of a scroll expander used in an ORC waste heat recovery system. Appl. Therm. Eng. 138, 72–82. doi:10.1016/j.applthermaleng.2018.04.048
Yuchai (2017). Yuchai. Available at: http://www.yuchaiie.com/product/10922.html (Accessed June 2, 2017).
Zheng, J. Y., Fu, M. W., and Zeng, F. (2022). Design and development of multi-scaled metallic parts and structures. Encycl. Mater. Metals Alloys 2022, 3–18. doi:10.1016/b978-0-12-819726-4.00137-x
Keywords: waste heat recovery, ORC, heavy duty vehicles, turbine design, fuel consumption reduction
Citation: Dragos AV, Pesyridis A, Alshammari F, Sphicas P and Kourmpetis M (2023) Diesel engine waste heat recovery turbine design: geometric and materials effects on ORC turbines. Front. Mech. Eng 9:1291108. doi: 10.3389/fmech.2023.1291108
Received: 08 September 2023; Accepted: 23 October 2023;
Published: 15 November 2023.
Edited by:
Amin Paykani, Queen Mary University of London, United KingdomReviewed by:
Amin Mahmoudzadeh Andwari, University of Oulu, FinlandDuygu Ipci, Gazi University, Türkiye
Copyright © 2023 Dragos, Pesyridis, Alshammari, Sphicas and Kourmpetis. This is an open-access article distributed under the terms of the Creative Commons Attribution License (CC BY). The use, distribution or reproduction in other forums is permitted, provided the original author(s) and the copyright owner(s) are credited and that the original publication in this journal is cited, in accordance with accepted academic practice. No use, distribution or reproduction is permitted which does not comply with these terms.
*Correspondence: Panos Sphicas, cC5zcGhpY2FzQGJoYW0uYWMudWs=
 Alexandru Vasile Dragos1
 Apostolos Pesyridis
 Fuhaid Alshammari
 Panos Sphicas
 Miltiadis Kourmpetis