 Sayali Deepak Apte
 Sayali Sandbhor
- Civil Engineering Department, Symbiosis Institute of Technology (SIT), Symbiosis International (Deemed University), Pune, India
Asia’s coastlines are choking in waste. The region is now home to many of the world’s most polluted beaches. The populous Indian Cities are growing economically but in an unsustainable manner. With Mumbai counted among topmost polluted beaches in the world, it is the need of the hour to take necessary steps for effective waste management by systematic data analysis for deriving useful information from waste generation patterns. The major objective of the study is pattern recognition and beach waste quantum prediction based on 5 years data, with a frequency of daily waste collection. The size of the training data set is 1,661 days and the validation data set is 335 days. The influence of population trend, waste generation during festivals, special days, weekends, and seasonal variations form the basis for the analysis. Using machine learning algorithms, the study identifies and investigates data patterns for the case study of Dadar-Mahim beach. Data frequency and weights are correlated with occurrence of events, festivals, weekends, and seasons. Exploratory Data Analysis (EDA) is employed for data preprocessing and wrangling, followed by a Random Forest algorithm-based model for the prediction of waste generated at Dadar-Mahim beach. The major challenges in data prediction are limited data availability and variation in the dates of festivals and holidays as well as lack of waste segregation information. Despite the above-mentioned challenges, the observations indicate the model’s average accuracy for making predictions of around 60%. The Graphic User Interface (GUI) developed based on the model provides a user-friendly application for predicting the total daily generation of beach waste with reasonable precision. On the basis of the model’s outcome and applicability, a schematic approach for efficient beach waste management is proposed. The recommendations would serve as guidelines for Urban Local Bodies (ULBs) to automate the collection, transport, and disposal of beach waste.
1 Introduction
Beach pollution is a major concern as it contaminates our coastline with a variety of harmful items including plastic in many forms, trash, pesticides, oils, metals and many others. These pollutants include tremendous levels of natural chemicals that directly harm marine life. Marine debris, also known as marine litter, is a serious issue that is defined as a human activity of intentionally or accidentally throwing waste into the ocean. Floating marine debris is known as beach litter that usually washes ashore contributing to beach waste. Rapid industrialization along with urbanization has put a lot of pressure on the existing infrastructure leading to clogging of the existing low-capacity systems. Generation of high amounts of unmanageable wastes and unaccounted dumping in sea is a result of the haphazard growth. These wastes reach the ocean via feeder channels disturbing the ecosystems and hampering India’s coastal resources. As waste accumulates in the ocean and is thrown back at the beaches at rapid rates, the need for environmentally efficient and sustainable remediation solutions is of paramount importance (Schmaltz et al., 2020).
For implementation of systematic and suitable strategies, it is very important to know the exact quantum of waste generation and the sources of it (Lebreton and Andrady, 2019). In this study, city-level data on waste collection is analyzed using python coding for pattern recognition to help the governing bodies to formulate suitable policies that effectively work towards waste reduction and efficient management. The research paper also suggests a system for effective and smart waste prediction and management using a machine learning approach.
Beach waste management is critical for Mumbai because of its significant location from a business capital perspective. As per the projections and real data, Mumbai, a top-rated metro city, discards over 2,200 million liters of waste in the coastal waterways per day. India’s financial capital is facing a huge challenge in addressing the issue of beach waste. Mumbai has a coastal stretch of 603 sq. Km. The total population of the city amounts to nearly 13 million that is increasing rapidly. Mumbai’s overall waste generation from densely populated neighborhoods and its management is a massive task for the local administration. The city municipalities are showing their inability to manage the municipal solid waste as well as industry waste efficiently (Dutta and Jinsart, 2020).
1.1 Beach pollution
The solid waste that has been discarded or reaches the sea as a result of human activities is termed as marine litter (Rayon-Vina et al., 2018). The major activities that contribute to marine litter are tourism, transport, recreational, sewage and shipping (Somerville et al., 2003). The beach waste and other wastes generated and collected from the marine environment are considered a major threat to the environmental wellbeing of the seas and coastlines. The major component of the beach waste is slowly decomposing plastics (Derraik, 2002; Ryan et al., 2009; Topcu et al., 2013). The lightweight plastics which are a major component of the beach waste can be easily transported by wind currents, wastewater and river streams and inadequate disposal (Su et al., 2016). This results in the accumulation of waste materials in sea and coastlines causing aggravated marine and coastal pollution problems (Ki-Moon and Steiner, 2015). The waste generated on beaches is not considered as constant waste. The marine waste can be from unknown activities, disposed of, abandoned to coasts and seas. The beach waste generated as a result of sea-based activities involve the waste disposed on shore by fishermen, tourists, trade, military, research and cruise lines, oil-gas infrastructure and fish farms etc. (Ki-Moon and Steiner, 2015). The waste generated on beaches can cause serious impact on socio-economics and environmental wellbeing, damage to local biota and aesthetic and economics of tourism income and other local users (Munari et al., 2016). This waste impacts tourism and can have severe economic impact worldwide (Ghermandi and Nunes, 2013). Thus, there is a strong correlation between the density of beach use and marine waste production. Waste amount and composition are affected by urbanization and changes during the summer owing to density of beach use (Ariza et al., 2008).
The continuous growth in the amount of solid waste generated on beaches is inversely proportional to the rate at which that waste degrades, leading to a gradual increase in the amount of litter found at sea, on the seafloor and along coastlines around the world.
1.2 Sources of beach waste
The Municipal Solid Waste (MSW) regulations stipulate that at least 80% of the waste produced by local bodies must be recovered. Only 35% of Mumbai’s waste was recovered as of 2019–20; this percentage has remained unchanged for the previous four years with no improvement. Mumbai generated an average of 6,650 Metric Tonnes per Day (MTD) of waste as of 2019–20. Major sea inlets and beaches in Mumbai are contaminated by surface pollution, such as solid waste, or untreated sewage. Variety of wastes enter the sea via various sources that need systematic redressal mechanisms.
There is no doubt that the aquatic ecosystem is in danger, and soon fish and other marine life will be surrounded by waste at a 1:1 ratio (Panwar et al., 2020). According to the Maharashtra Pollution Control Board (MPCB), plastic waste is a significant source of municipal solid waste and is endangering the creeks, rivers, and ocean along Mumbai’s 437.71 sq km of coastline. Marine litter is a pervasive issue that poses a major concern. It has inspired government involvement in creating mitigation techniques as well as citizen participation in clean-up programmes (Liu et al., 2013). The amount of waste being generated and deposited in the sea or on the seashore must, however, be taken into consideration while making efforts to remedy the problem. The research and patent landscape indicate that further research and investigations are indeed required for the identification, treatment, characterization, and removal of microplastics from the ecosystem (Dike et al., 2022). The growing accumulation of microplastic contamination is an issue of worldwide concern (Dike et al., 2023). While the damage done to the environment cannot be undone, the impact can be lessened by better understanding the ocean and monitoring future pollution using technology. Such an effort will help achieve sustainability as laid out by the Sustainable Development Goals 2030 of the United Nations (Agarwala, 2021). The literature review on beach waste generation and smart beach waste management practices in India, indicates a need for additional research in the domain.
2 Case study: Mumbai Dadar beach
The present paper studies the trend of beach waste generation at Dadar beach having 2.5 km length. The Dadar beach is located in Mumbai, Maharashtra at 19°01′25.4″N 72°49′57.3″E on the western coast of India surrounded by the magnificent Arabian Sea. The daily beach waste collected from the case study region for a period from 2013 to 2018 is obtained from authentic sources. The analysis of this daily waste data for Dadar beach for a period of 5 years, is performed. The main objective of the paper is to analyze the trend of the waste generation with respect to seasons and to assess the influence of festivals, summer vacations, holidays and weekends on beach waste generation. The trend of population increase is also considered for data analysis. The patterns of waste generated for the past few years are analyzed and used to predict the waste generation in the near future. The prediction of the beach waste generation would certainly help the civic bodies in improving the beach waste management systems. Climate in the case study region is tropical with pronounced dry and rainy seasons. Almost 2,430 mm (95″) of annual rainfall between June and September when monsoons are blowing. Rest of the months are much drier. There are major festivals that may influence the beach waste generation. Ganesh puja and visarjan falls in the month of August-September. Naralipornima is celebrated by the fishermen of Mumbai, in the month of August. Diwali is one of the major festivals of hindus, celebrated in October-November. Chatt Puja is also one of the major cultural celebrations of worshiping at the banks of rivers and sea. The above-mentioned festivals generally do not have fixed dates on the calendar but the dates vary based on the Indian calendar system. Christmas and new year also add to celebrations near beaches causing an increase in waste generation. Festivals are only seasonal but summer/winter vacations and weekends bring leisure and business activities on beaches. An attempt is made to address the beach waste generation and management issue through systematic data analysis and prediction modeling to devise a framework for an effective system.
2.1 Methodology
Figure 1 demonstrates the process flow for data analysis. Data is arranged in date versus weight of waste collected format for 6 years (∼365*6 instances). Among the 6 years we divided the data as first years for training and last 1 year to test the accuracy of the model. Exploratory data analysis (EDA) is an approach to analyzing and summarizing data sets to identify patterns, anomalies, and relationships in the data. This type of analysis is typically used to gain a better understanding of the data and to uncover potential insights or relationships that can be used to inform further analysis or decision-making.
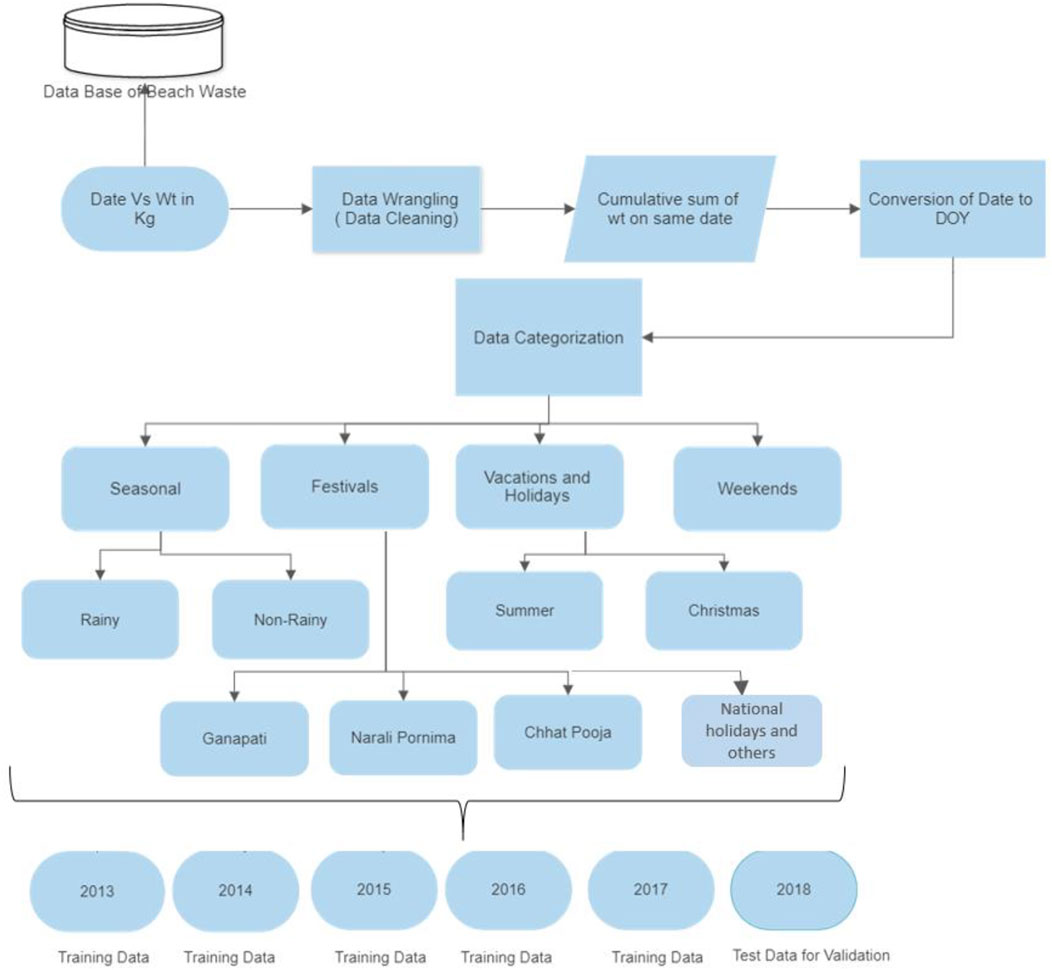
FIGURE 1. Process flow for data analysis and prediction.
The initial step in the data cleansing process is the removal of no values or null values from the raw data collection. In some instances of the database, several records of waste collection in kg for the same day are detected. The cumulative sum of multiple entries is performed and a single value is derived from it. The data is afterwards evaluated for the date format that was previously in the string format. The database identifies the weekdays for the years 2013–2017 based on the date. The data is categorized based on seasons, festivals, weekdays and weekends. Data segregation program is run for identifying data clusters pertaining to one category. The data is categorized between rainy and non-rainy seasons. The present research considers rainy season during June-September in the study area. The data for the remaining months is classified as a non-rainy season. Except for a few, such as Independence Day, Republic Day, and Christmas, the festivities do not reoccur on the same date year to year. The festival days from 2013 to 2017 are identified manually and entered in the data. We assume that people will visit beaches more frequently during festival holidays, resulting in an increase in beach litter. Eventually the data preparation can be concluded as, data sorting based on the cumulative addition for multiple entries involves organizing data in a way that allows for the calculation of cumulative sums. This can be useful, for example, when analyzing data over time or when trying to identify trends or patterns in the data.
Categorizing data on weekdays corresponding to the dates in a database involves organizing the data into separate categories based on the day of the week associated with each date in the database. This can be useful for analyzing data on a weekly basis, for example, to see how certain variables or metrics vary from 1 day of the week to another. Categorizing data as per the festivals entered manually involves organizing the data into separate categories based on the festivals specified by the user. This can be useful for analyzing data related to festivals or other special events, to see how certain variables or metrics vary during these times. Once the data categorization and segregation are complete, data from 2013 to 2017 is used for model training and 2018 data is used as Test data for validation. The sorted data is modeled using linear regression and random forest models.
Linear regression is a statistical method used for modeling the relationship between a dependent variable and one or more independent variables. In the context of data with dates, waste collection in kilograms, and waste collection analysis for weekdays and weekends, rainy and non-rainy seasons, and festivals and non-festivals, a linear regression model could be used to analyze and predict waste collection patterns. The model would take into account the date, the day of the week, the season, and the presence or absence of a festival as independent variables, and the amount of waste collected in kilograms as the dependent variable. By fitting a linear regression model to the data, the researcher could identify any trends or patterns in waste collection and make predictions about future waste collection based on these factors. For example, the model might show that waste collection is higher on weekends than on weekdays, or that waste collection is higher during the rainy season than during the non-rainy season. The model could also be used to predict how waste collection might change in the future, based on changes in the independent variables such as the day of the week or the season. This information could be useful for waste management planning and decision-making.
Random forest is a type of machine learning model that can be used for regression and classification tasks. In the context of data with dates, waste collection in kilograms, and waste collection analysis for weekdays and weekends, rainy and non-rainy seasons, and festivals and non-festivals, a random forest model could be used to analyze and predict waste collection patterns. As input features, the model would consider the date, the day of the week, the season, and the presence or absence of a festival. The target variable would be the amount of waste collected in kilograms. By training a random forest model on these data, the model might learn to accurately forecast future waste collection based on these parameters. The advantage of using a random forest model over a linear regression model is that the random forest is a non-parametric model, which means that it makes fewer assumptions about the underlying data distribution. This can make it more flexible and better suited to complex, real-world data. Additionally, the random forest model is able to handle data with a large number of input features and can identify important relationships between the input features and the target variable that might not be apparent using other methods. The limitation of using the above selected methods is subsequently discussed in conclusion section. However, they can be useful for identifying and understanding waste collection patterns that are not immediately obvious from the data.
3 Exploratory data analysis
The trend of beach waste generation for 2013 (Figure 2A), 2014 (Figure 2C), 2015 (Figure 2E), 2016 (Figure 2G) and 2017 (Figure 2I) indicates increased waste generation over the years. Waste generation shows peaks mostly in July, August and September. The waste generation is observed to be increased with years with increase in population. The data outliers are given in the following figures, for 2013 (Figure 2B), for 2014 (Figure 2D), for 2015 (Figure 2F), for 2016 (Figure 2H) and for 2017 (Figure 2J) show the data outliers year-wise. The outliers are mostly observed in the month of July and August due to the major rainy season. Average waste generation is 40,000 kg for 2013 to 2015. In 2016 and 2017, however, the average is seen to have increased to 60,000 kg. In 2016 and 2017 the number of outliers may be more due to the frequent incidences of flooding, which carries more waste towards the beaches. The monthly average beach waste generation from the 2014 to 2017 is provided in Figure 3 and monthly total waste trend is shown in Figure 4. The data indicates increased waste generation every year from the month of June to October. The maximum standard deviation in the quantum of waste generation is observed from the month of June to October (Figure 5). The initial data analysis indicates that the waste generation is more during the rainy seasons than the non-rainy seasons indicating seasonal variations. The data also indicates that the waste generation peaks during specific days of years corresponding to festivals, summer breaks and weekends. The waste generation is observed increasing trend during the festival season August to October. Similar trends are observed in the total waste generation from 2014 to 2017 data. The maximum number of festivals celebrated on the sea shore or the holidays during which people visit the beaches for leisure occurs during March—August. The quantum of waste generation is highest in the month of August and September every year with maximum waste collected in 2017 (Figure 6). From the trend analysis it is clear that maximum waste collection inventory and manpower is required from August—October subject to the festival dates. The trend analysis will certainly help in understanding the inventory required for management for beach waste.

FIGURE 2. Beach waste generation trend (A,B) for 2013; (C,D) for 2014; (E,F) for 2015; (G,H) for 2016; (I,J) for 2017.
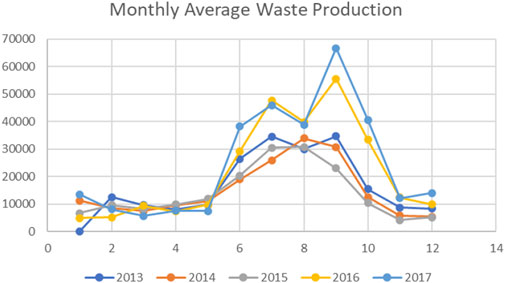
FIGURE 3. Monthly average beach waste production.
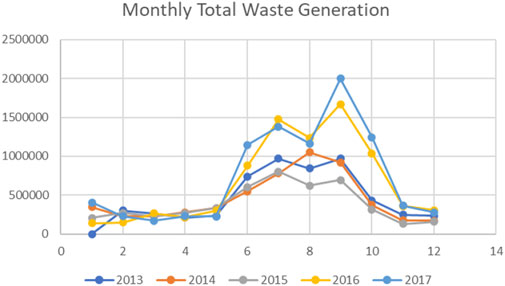
FIGURE 4. Monthly total waste generation from 2013 to 2017.
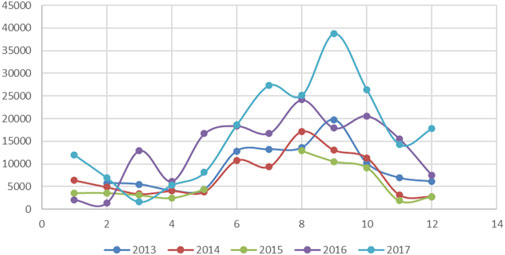
FIGURE 5. Month-wise Deviation in the waste generation.
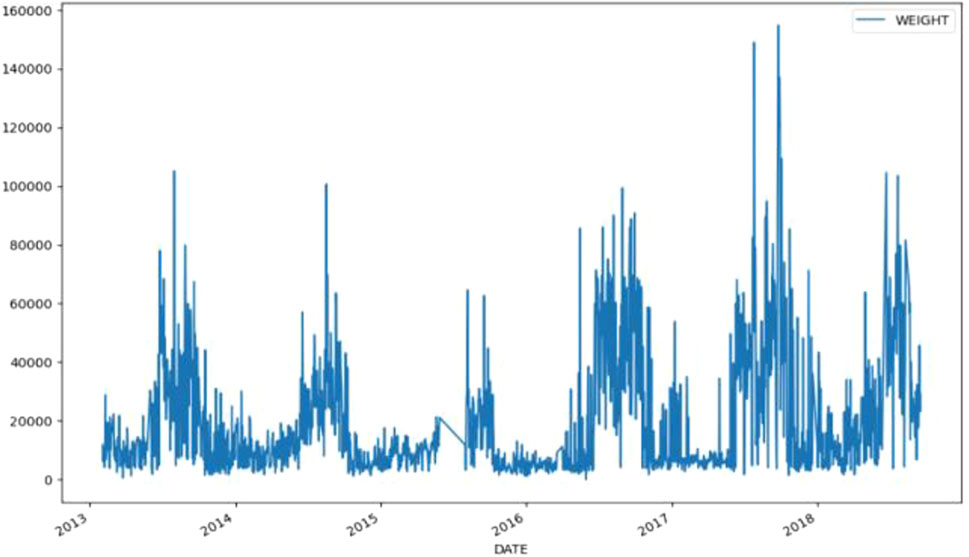
FIGURE 6. Quantum of waste generated at Case study beach from 2013 to 2017 from 2013 to 2018.
Number of instances of collecting upto 20,000 kg of waste are very high as compared to frequency of dealing with more than 100,000 kg of waste (Figure 7). The systems in place should be accordingly designed to accommodate the amount of waste getting generated and handled.
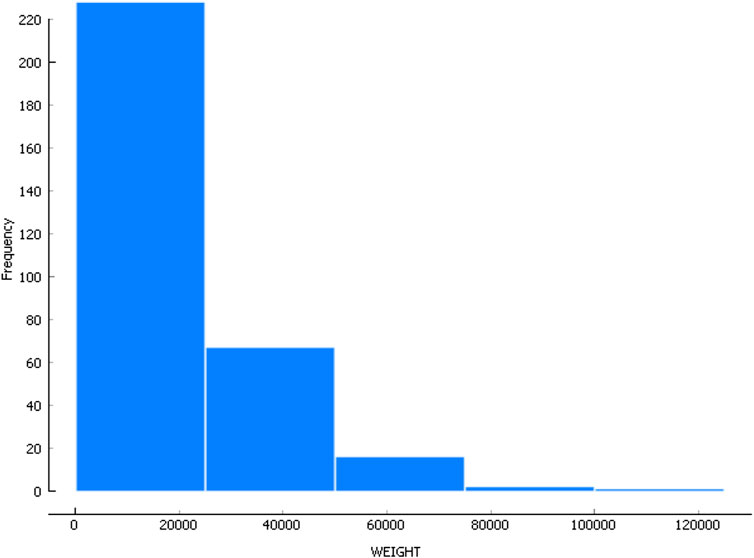
FIGURE 7. Frequency of range of waste weight collected.
4 Prediction modeling
Figure 8 gives a yearly prediction regression equation y = 0.0343x – 621,764 having R2 to be 0.60 for relation between average beach waste generation with respect to population from 2014 to 2018 for which real data is available. For population projection, regression equation is obtained as 265154x- 515112924.14 where x is the corresponding year. Based on the real data, trend line is generated and average beach waste generation is predicted based on population projection upto year 2040 having R2 to be 0.9961 (Figure 9).
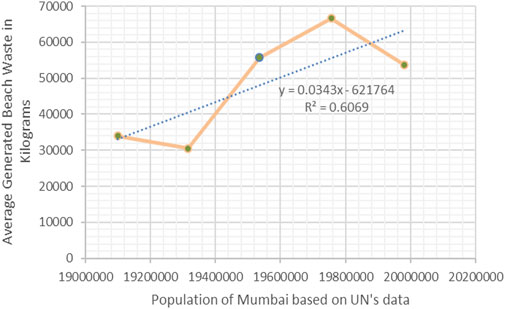
FIGURE 8. Regression analysis of Average beach waste generation with respect to population.
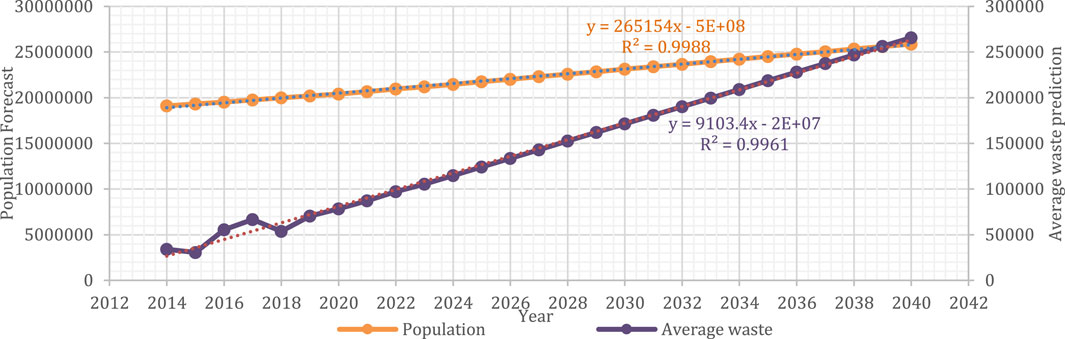
FIGURE 9. Prediction of beach waste based on population forecast and regression equation from Figure 8.
4.1 Linear and random forest regression algorithm for prediction of beach waste generation
The prediction model using random forest and linear regression is given in Figures 10, 11. Out of the total cases, 1,661 samples for training and 242 samples for testing were deployed for the prediction modeling. The dataset used in the research appears to be a time series dataset with daily weight measurements and some categorical variables (e.g., Season, Festival, Weekday). Hyper parameters would not be relevant to this type of data hence not included in the dataset. Despite several challenges like seasonal variations based on climatic conditions every year, variation in the festival dates, insufficient data collection by the agencies, the average model accuracy for beach waste prediction for random forest and linear regression on the validation data set is observed 52.7% and 58.41% respectively.
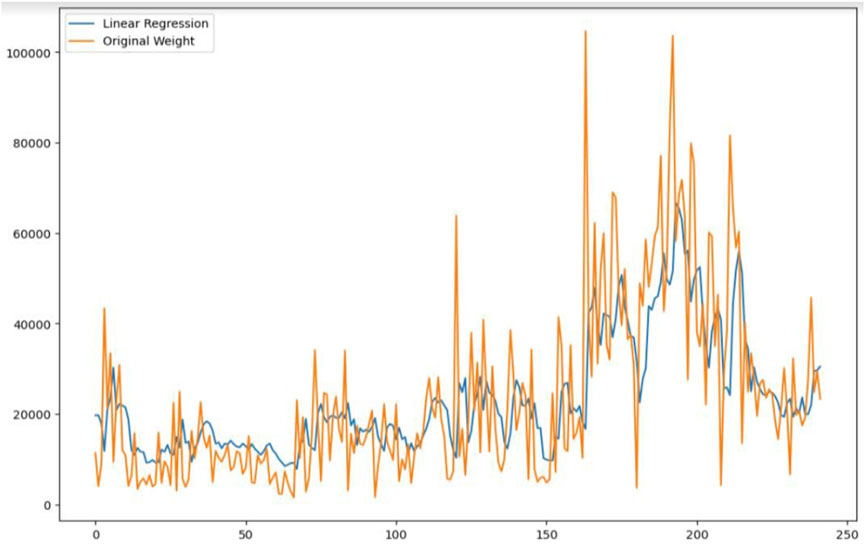
FIGURE 10. Model training with linear regression to predict the behavior of the beach waste generation.
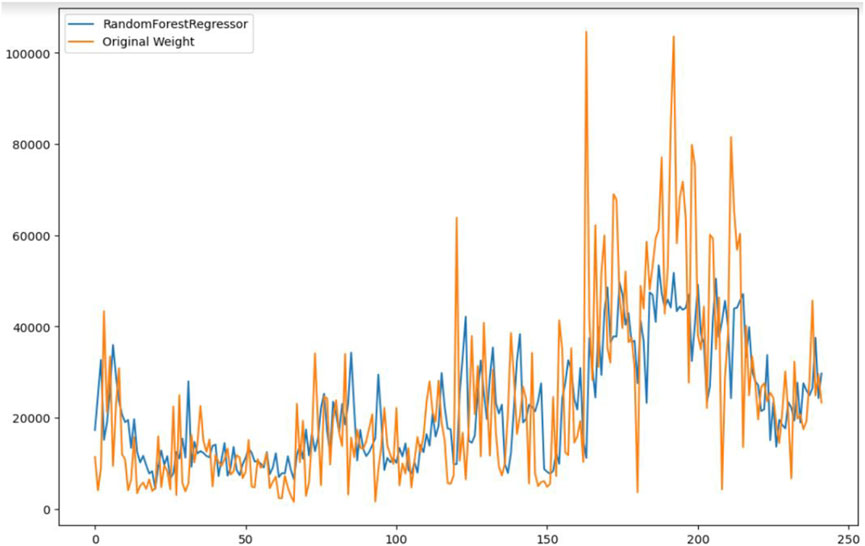
FIGURE 11. Random Forest regression algorithm for prediction of beach waste generation.
It is not accurate to say that the prediction accuracy of random forest and linear regression is inherently less than other algorithms. The accuracy of any machine learning algorithm depends on a variety of factors, including the quality of the data used for training and the specific task the algorithm is being used for. In some cases, random forest and linear regression may indeed have lower prediction accuracy than other algorithms, but in other cases they may be equally or even more accurate. Ultimately, the best algorithm for a given task will depend on the specific details of the problem at hand. From the data analysis, it can be observed that the waste generation variation is observed during weekends, festivals and vacations. The major festival period starts in the month of August till September.
5 Machine learning approach based automated beach waste management system workflow and recommendations
The population in Mumbai in 1950, was 3,088,811. The city’s population has grown by 256,382 by 2015, indicating a 1.26% annual increase. The above population estimations and projections are from the latest revision of the United Nations World Urbanization Prospects (Figure 8). The beach waste generation on beaches is also observed to increase with population. The systematic waste management of cities leads to attainment of Sustainable Development Goal (SDG) number 11 on Sustainable cities and communities includes a target that emphasizes on reducing the adverse per capita environmental impact of cities, with special focus on municipal and other waste management issues. SDG number 12 on responsible consumption and production, involves targets emphasized on sustainable prevention, reduction, recycling and reuse strategies of waste management. Based on the analysis of the beach waste generation data, it is imperative that efficient and sustainable beach waste management is the need of the hour if the mentioned SDGs and targets are strategically addressed. AI-ML innovations are extremely useful in issues pertaining to pollution control and management especially marine and beach pollution control (Hoang et al., 2022).
The ML based automated beach waste system proposed is as shown in Figure 12. The proposed waste management incorporates the waste management hierarchy by considering the data generated from the waste generation forecast. The proposed system starts with waste quantification followed by segregation of the waste either at the source or at a transfer station based on the economics. The data on the segregated solid waste would be used for further data analytics and forecasting. The solid waste which can be reused or recycled will be separated and transported to the reuse/recycle facility. The waste having good calorific value will be separated and transported to waste to energy facilities or power plants or cement factories for utilization to generate energy. The biodegradable waste will be used for bio-gasification and composting. This will lead to reduction in the waste volume for disposal to the landfill and promote the concept of circular economy. The waste which cannot be reused/recycled/used for energy generation/biological processing will be sent for disposal to landfill. At each and every stage in the waste management plan, the data generated will be preserved and utilized for forecasting the waste generation and type of waste generated. This system will certainly help in optimizing the resources and manpower minimizing the impact on the environment. The system proposed would certainly help in the direction of achieving the SDG 11 and SDG 12.
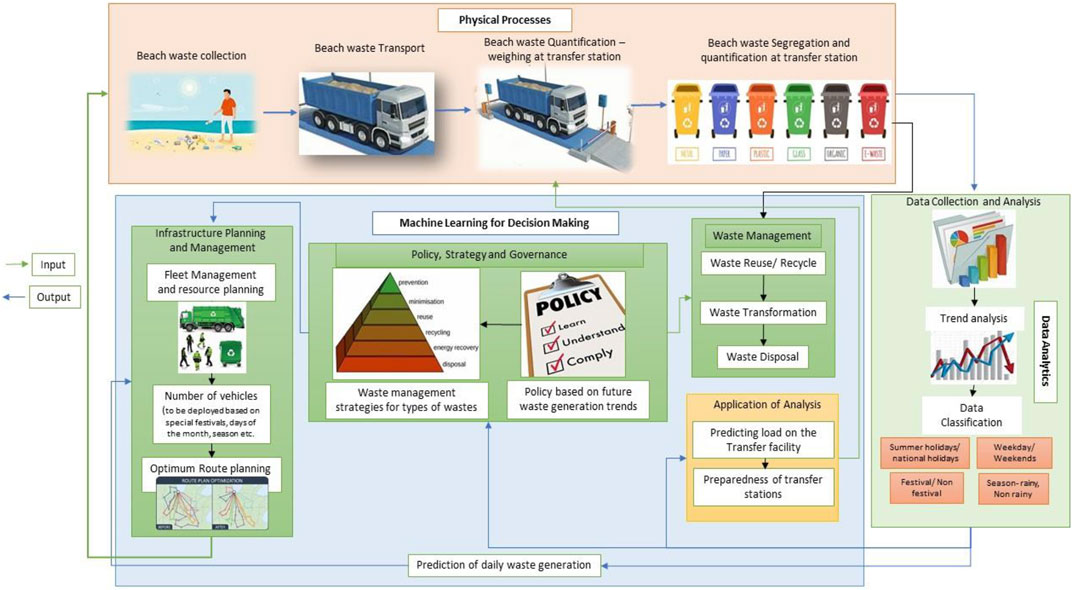
FIGURE 12. Machine Learning based automated Beach Waste Management System Framework.
6 Conclusion
The accumulation of solid waste on the beaches leads to marine pollution, affects the aesthetics of the beaches consequently leading to environmental degradation. The present paper is a case study on Dadar beach in Mumbai, India. The paper presents a machine learning based approach for automated beach waste management systems from the perspective of a circular economy. The paper analyzes the daily beach waste collection data from 2013 to 2018 using exploratory data analysis followed by random forest and linear regression prediction modeling. The paper proposes a beach waste prediction methodology which can be further embedded in the smart beach waste collection and disposal model.
The data analysis from 2014–2017 reveals that the quantum of beach waste generation varies with respect to rainy and non-rainy seasons, festivals, weekends, National holidays and vacation. The present model considers these factors for data prediction. The influence of population growth on the model is also considered. Based on the beach waste prediction model, the paper proposes an automated beach waste management framework based on the waste management hierarchy. Output from the prediction model can aid in devising the best suited optimum plan for inventory and resources planning. The results indicate parametric analysis. The designed waste management approach can be further extended to other similar beaches under similar management schemes. The efficient and automated beach waste management approach can be successfully implemented if data related to waste generation and waste segregation is regularly maintained and used for data analytics and prediction. Further, an effective plan for segregated waste utilization through recycling, reuse and transformation could be suggested.
The approach discussed in the paper can be further improved for model accuracy. The implementation of the proposed approach would also help in minimizing the environmental degradation and attainment of the sustainable development goals.
Data availability statement
The data analyzed in this study is subject to the following licenses/restrictions: Can be provided if needed by journal but cannot be made public. Requests to access these datasets should be directed to SA, sayali.apte@sitpune.edu.in.
Author contributions
SA has done data collection, exploratory analysis, and manuscript writing along with SS. RK was involved in data analysis and prediction and HK was involved in manuscript writing.
Conflict of interest
The authors declare that the research was conducted in the absence of any commercial or financial relationships that could be construed as a potential conflict of interest.
Publisher’s note
All claims expressed in this article are solely those of the authors and do not necessarily represent those of their affiliated organizations, or those of the publisher, the editors and the reviewers. Any product that may be evaluated in this article, or claim that may be made by its manufacturer, is not guaranteed or endorsed by the publisher.
References
Agarwala, N. (2021). Managing marine environmental pllution using artificial intelligence. Thailand: Maritime Technology and Research. doi:10.33175/mtr.2021.248053
Ariza, E., Jimenez, J. A., and Sarda, R. (2008). Seasonal evolution of beach waste and litter during the bathing season on the Catalan coast. Waste Manag. 28 (12), 2604–2613. doi:10.1016/j.wasman.2007.11.012
Derraik, J. G. B. (2002). The pollution of the marine environment by plastic debris: A review. Mar. Pollut. Bull. 44 (9), 842–852. doi:10.1016/S0025-326X(02)00220-5
Dike, S., Apte, S., and Dabir, V. (2023). Effect of low-density polyethylene, polyvinyl chloride, and high-density polyethylene micro-plastic contamination on the index and engineering properties of clayey soil-an experimental study. Environ. Res. 218, 1115016–1115115. doi:10.1016/j.envres.2022.115016
Dike, S., Apte, S., and Tiwari, A. K. (2022). Micro-plastic pollution in marine, freshwater and soil environment: A research and patent analysis. Int. J. Environ. Sci. Technol. 19, 11935–11962. doi:10.1007/s13762-021-03782-5
Dutta, A., and Jinsart, W. (2020). Waste generation and management status in the fast-expanding Indian cities: A review. J. Air Waste Manag. Assoc. 70 (5), 491–503. doi:10.1080/10962247.2020.1738285
Ghermandi, A., and Nunes, P. A. L. D. (2013). A global map of coastal recreation values: Results from a spatially explicit meta-analysis. Ecol. Econ. 86, 1–15. doi:10.1016/j.ecolecon.2012.11.006
Hoang, T. D., Ky, N. M., Thuong, N. T. N., Nhan, H. Q., and Ngan, N. V. C. (2022). “Artificial intelligence in pollution control and management: Status and future prospects,” in Artificial intelligence and environmental sustainability, algorithms for intelligent systems. Editors H. L. Ong, Ra. Doong, R. Naguib, C. P. Lim, and A. K. Nagar (Singapore: Springer). doi:10.1007/978-981-19-1434-8_2
Ki-Moon, B., and Steiner, A. (2015). United Nations environment programme: Annual report 2015. United Nations environment programme. doi:10.1143/JJAP.47.2877
Lebreton, L., and Andrady, A. (2019). Future scenarios of global plastic waste generation and disposal. Palgrave Commun. 5 (1), 6–11. doi:10.1057/s41599-018-0212-7
Liu, T. K., Wang, M. W., and Chen, P. (2013). Influence of waste management policy on the characteristics of beach litter in Kaohsiung, Taiwan. Mar. Pollut. Bull. 72 (1), 99–106. doi:10.1016/j.marpolbul.2013.04.015
Munari, C., Corbau, C., Simeoni, U., and Mistri, M. (2016). Marine litter on Mediterranean shores: Analysis of composition, spatial distribution and sources in north-Western Adriatic beaches. Waste Manag. 49, 483–490. doi:10.1016/j.wasman.2015.12.010
Panwar, H., Gupta, P., Siddiqui, M. K., Morales-Menendez, R., Bhardwaj, P., Sharma, S., et al. (2020). AquaVision: Automating the detection of waste in water bodies using deep transfer learning. Case Stud. Chem. Environ. Eng. 2, 100026. doi:10.1016/j.cscee.2020.100026
Rayon-Vina, F., Miralles, L., Gomez-Agenjo, M., Dopico, E., and Garcia-Vazquez, E. (2018). Marine litter in south Bay of Biscay: Local differences in beach littering are associated with citizen perception and awareness. Mar. Pollut. Bull. 131, 727–735. doi:10.1016/j.marpolbul.2018.04.066
Ryan, P. G., Moore, C. J., Van Franeker, J. A., and Moloney, C. L. (2009). Monitoring the abundance of plastic debris in the marine environment. Philos. Trans. R. Soc. B Biol. Sci. 364 (1526), 1999–2012. doi:10.1098/rstb.2008.0207
Schmaltz, E., Melvin, E. C., Diana, Z., Gunady, E. F., Rittschof, D., Somarelli, J. A., et al. (2020). Plastic pollution solutions: Emerging technologies to prevent and collect marine plastic pollution. Environ. Int. 144, 106067. doi:10.1016/j.envint.2020.106067
Somerville, S. E., Miller, K. L., and Mair, J. M. (2003). Assessment of the aesthetic quality of a selection of beaches in the Firth of Forth, Scotland. Mar. Pollut. Bull. 46 (9), 1184–1190. doi:10.1016/S0025-326X(03)00126-7
Su, L., Xue, Y., Li, L., Yang, D., Kolandhasamy, P., Li, D., et al. (2016). Microplastics in taihu lake, China. Environ. Pollut. 216, 711–719. doi:10.1016/j.envpol.2016.06.036
Keywords: machine learning, random forest algorithm, beach waste, automated waste management, predictive analysis
Citation: Apte SD, Sandbhor S, Kulkarni R and Khanum H (2023) Machine learning approach for automated beach waste prediction and management system: A case study of Mumbai. Front. Mech. Eng 9:1120042. doi: 10.3389/fmech.2023.1120042
Received: 09 December 2022; Accepted: 19 January 2023;
Published: 03 February 2023.
Edited by:
Amit Bandyopadhyay, Washington State University, United StatesReviewed by:
Gayatri Vyas, Government College of Engineering Pune, IndiaSmita Patil, National Institute of Construction Management and Research, India
Copyright © 2023 Apte, Sandbhor, Kulkarni and Khanum. This is an open-access article distributed under the terms of the Creative Commons Attribution License (CC BY). The use, distribution or reproduction in other forums is permitted, provided the original author(s) and the copyright owner(s) are credited and that the original publication in this journal is cited, in accordance with accepted academic practice. No use, distribution or reproduction is permitted which does not comply with these terms.
*Correspondence: Sayali Deepak Apte, c2F5YWxpLmFwdGVAc2l0cHVuZS5lZHUuaW4=