- Professorship for Fluid System Technology, Friedrich-Alexander-Universität Erlangen-Nürnberg, Erlangen, Germany
In order to be able to use the full potential of regenerative fuels, a comprehensive characterization is necessary to identify the differences between conventional fuels and regenerative fuels. In the current work, we compare OME3−5 and 1-Octanol with diesel-like Dodecane in terms of mixture formation under ECN Spray A conditions for single and multi-injection. To determine the mixtures, i.e., the mass distribution and the resulting air-fuel equivalence ratio, Naber and Siebers’ model as well as Musculus and Kattke’s model are used, which are based on experimental data. For this work, the mass flow rates and also the liquid and gaseous penetration depths of the fuel spray are measured. Results show that the mass ratios for the quasi-steady state of a single main injection for all three fuels are nearly the same, whereas the air-fuel equivalence ratios are very different. In addition, multiple injections are used to show that the fuel influences the opening and closing behavior of the injector. In the transient case of multiple injections, completely different mixtures result. In summary, it can be stated that OME3−5 and also 1-Octanol show a clearly different physio-chemical behavior from Dodecane and cannot simply be used as a drop-in fuel. Therefore, a simple exchange is not possible without major adaptations.
1 Introduction
In order to achieve the global climate targets defined in the Kyoto Protocol and, in particular, the package of goals passed by the European Parliament within the framework of “Fit for 55”, it is necessary to make the energy supply of all sectors carbon-neutral. This means that the classic fossil fuels for internal combustion engines can no longer be used. Nevertheless, this does not automatically require that the combustion engine must be replaced by new technologies such as battery electric power trains or fuel cell systems. Regenerative e-fuels are one way of operating internal combustion engines sustainably with the advantage that the energy can easily be stored and transported and the existing infrastructure can be further used. Various substances can be considered as e-fuels, e.g., sustainably produced Fischer-Tropsch diesel or ammonia (Schmidt et al., 2016) (Kramer et al., 2018) (Kramer et al., 2021).
Due to their specific combustion properties and the possibility of reducing pollutants (Weiß, 2021), oxygenated fuels play a significant role in the discussion about the fuel of tomorrow. For the diesel engine combustion, the group of polyoxymethylene ethers (OMEs) and long-chained alcohols such as 1-Octanol are promising because of their relatively high cetane number. 1-Octanol is an organic compound with one OH group at the end of the molecule. The chemical structure is
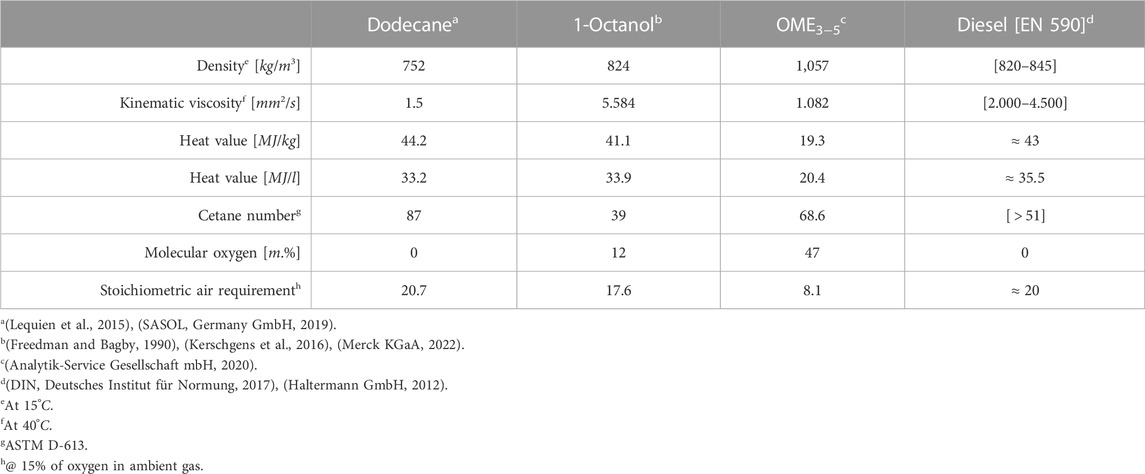
In order for these e-fuels to be launched on the European market, they must comply with the currently valid EN 590 standard (DIN Deutsches Institut für Normung, 2017). In this norm, the density of the fuel and the cetane number are the key factors. Table 2 shows the target data for diesel from the standard as well as the properties of Dodecane, OME3−5 and 1-Octanol. You can see that 1-Octanol has a too low cetane number and OME3−5 a too high density to meet the EN 590 standard. Furthermore, both fuels have a viscosity which does not fit the criteria. This means that unless the standard is changed, these substances will not appear on the European market and will not be used as substitutes for fossil diesel. Nevertheless, from a technical point of view, these two substances represent a possibility of making the energy supply carbon-neutral.
Since the process of combustion and the pollutants of a diesel engine depend highly on the mixture formation, this procedure with the mentioned e-fuels in comparison with fossil diesel will be examined in more detail in the following work. A single injection is used to investigate the influence of fuel on mixture quality for the quasi-steady state. A multi-injection with a short pre-injection and a longer main injection is investigated to demonstrate the influence of new fuels on opening and closing behavior of the nozzle and the following mixture formation. For this purpose, optical measurement techniques such as Mie scattering and schlieren are used and mass rates are determined. On the basis of the measured data, models are built to identify the mixing behavior of e-fuels compared to the reference fuel. The reference fuel is not diesel but the substitute Dodecane because Dodecane is a pure substance with clearly specified properties and not a mixture of substances like diesel.
2 Models describing mixture formation
In current diesel engines, fuel is injected around the top dead center directly into the combustion chamber at maximum pressures of 2000 bar and above (Mahr, 2002) creating a combustible fuel-air mixture. The injection process is determined by the momentum transfer from the initial momentum flux of the fuel at the nozzle outlet to the ambient gas. Since momentum conservation applies, air entrainment expands the spray creating a conical spray plume that is defined by the angle and depth of penetration (Wakuri et al., 1960), (Abramovich, 1963). In this work, starting from the description of the gaseous penetration depth and the cone angle of a spray, the mixture formation of Dodecane, 1-Octanol and OME3−5 is characterized using Naber’s and Siebers’ as well as Musculus’ and Kattke’s models and equations.
2.1 Naber and Siebers’ model
To understand mixture formation, it is necessary to understand how the spray spreads into the ambient gas. On this topic, various authors have conducted studies and summarized their results in empirical or semi-empirical equations. The most important ones should be briefly described at this point. (Hiroyasu and Tasaka, 1978). and (Hiroyasu and Arai, 1990) investigate spray propagation of different injectors, fuel pressures and ambient conditions. They observe that the jet does not break up immediately after nozzle exit and remains intact for a while. Thus, the velocity of the spray tip is constant at the very beginning of the injection. With the following entrainment of ambient gas and the mixture formation, the velocity slows down, resulting in a steady spray development. These two segments are separated by the break-up time tb. Looking at the Eq. 1, you can see that the break-up time depends on the densities of ambient gas and fuel, the nozzle hole diameter and the pressure difference. Since no mixing can take place without jet break-up and since today’s injection pressures are very high, which leads to very short break-up times, the first segment of injection is of minor importance and is therefore neglected. To describe the further penetration, they use (Levich, 1962)’s jet disintegration theory, which leads to the following Eq. 2 for the penetration depth S(t). The penetration depth after break-up time depends mainly on the pressure difference between the fuel and the environment, the ambient density and the nozzle hole diameter. It is obvious that this is a logarithmic function, the spray slows down more and more as it propagates.
For: t > tb
A few years later (Naber and Siebers, 1996), have focused on spray propagation again. Better measurement technology expanded the boundaries and provided the basis for upcoming trends such as turbochargers and common rail systems. Their model is based on the assumption that the spray is simplified as an isosceles triangle with a fixed cone angle, which builds the control surface used for balancing momentum, mass and energy (see Figure 1). (Siebers, 1999) formulates the following simplifications for their model:
• Quasi-steady flow with constant, uniform penetration.
• Uniform temperature, velocity and fuel concentration profiles.
• No difference in velocity between injected fuel and entrained ambient gas.
• Fuel droplets are small enough and behave like gas.
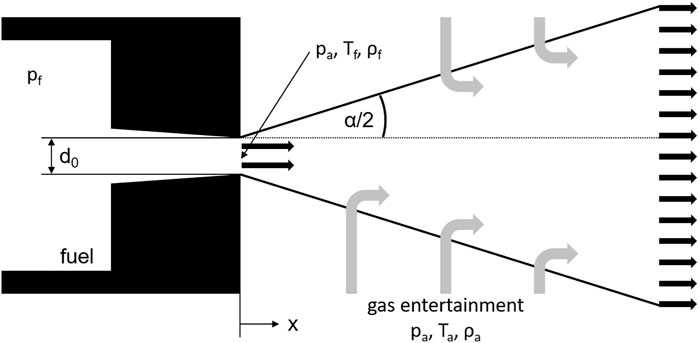
FIGURE 1. (Naber and Siebers, 1996)’s spray model.
(Naber and Siebers, 1996) also divide the injection into two areas to characterize the behavior described above. Similar to the break-up time, the limit is defined by the transition time tr (see Eq. 3). At this time, the spray appearance changes from a domination of injected liquid to a domination of entrained ambient gas. Since the first part of the injection plays a minor role in the mixture formation, it is also neglected here so that the Eq. 4 can be used for estimating the penetration depth.
For: t > tr
Comparing the correlation of (Hiroyasu and Tasaka, 1978) and (Naber and Siebers, 1996), you can see that many terms are quite similar. For the break-up time or rather the transition time (Naber and Siebers, 1996), do not use a fix coefficient but a factor depending on the injector and the spray geometry. The same applies to the calculation of the penetration depth. Those orifice coefficients are required to describe both the momentum and mass flux from the nozzle hole and thus improve the accuracy of (Hiroyasu and Tasaka, 1978)’s equations.
The area contraction coefficient Ca in Eq. 5 takes into account the flow cross section reduction at the nozzle orifice due to possibly occurring cavitation or hydraulic flip inside the nozzle (Soteriou et al., 1995) in comparison with the ideal flow cross section.
Area contraction coefficient:
The velocity coefficient Cv in Eq. 6 takes into consideration that the fuel does not exit the nozzle hole at the theoretical maximum velocity, which ideally is equal to the Bernoulli velocity due to the energy conservation. The main reason for the difference and the reduction of velocity are friction within the fuel due to turbulence and friction between the fuel and the nozzle wall.
Velocity coefficient:
The discharge coefficient Cd in Eqs 7, 8 relates the actual mass flow rate to the theoretically possible one. The ideal mass flow rate can be calculated using the ideal cross sectional area, the ideal exit velocity of the fuel from the nozzle hole and the density of the fuel, which clarifies that the discharge coefficient does no more than combine the two other coefficients.
Discharge coefficient:
As mentioned previously, conservation of momentum applies to spray propagation, which in simplified terms means that as the velocity decreases, the spray must become wider. The assumption that the spray can be modeled with an isosceles triangle that has an ideal cone angle α is only partially correct, which means that the model angle must be tuned to the real angle θ. The arbitrary constant a helps to adjust the momentum distribution perpendicular to the spray axis. (Naber and Siebers, 1996). use a value of 0.66 for a, which provides good results over a wide range of operation points.
With the knowledge of how a spray spreads into the environment, the mixture formation can now be investigated in more detail. Based on their penetration model (Siebers, 1999), derives some equations describing the mass distribution within the spray cone. With the mentioned assumptions, the equations for conservation of mass, (9) and (10), and momentum, (11), can be formulated.
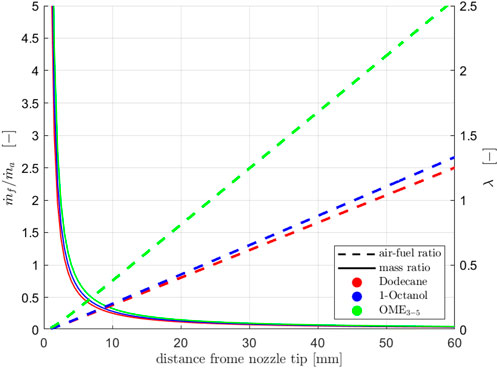
After rearranging the formulas, they obtain the axial ratio of fuel mass flow
If the stoichiometric air requirement of the mentioned fuels is taken into account (see Table 2), the air-fuel equivalence ratio λ(x) along the spray axis can be calculated:
2.2 Musculus and Kattke’s model
To develop their model, Naber and Siebers adopt simplifications that make the calculation easier but do not fully represent reality. They treat the spray as a steady flow with constant, uniform penetration, which means that the dynamics of the jet cannot be predicted. Since a multi-injection can be seen as an extreme case of a dynamic single injection, an advanced model must be used for the analysis. Based on the presented model (Musculus and Kattke, 2009), discretized the spray along the jet axis and introduced control surfaces with in- and outlets. In addition, a radial mass and velocity distribution in the spray and in the control elements respectively are used, which are suggested by (Abramovich, 1963). The validity of the model for the injector used in this work is confirmed by (Pickett et al., 2011)’s schlieren and Rayleigh-scatter measurements. Explaining all formulas of this model in detail is beyond the scope of this work. However, the model can be downloaded for free from the Engine Combustion Network website as MATLAB code.
3 Experimental set-up
Diesel engine mixture formation is primarily characterized by the injection process, which in turn is defined by the air entrainment. In simplified terms, mixture formation is the temporal and spatial mixing of fuel and air. In order to investigate this procedure, the two main macroscopic spray parameters, the cone angle and the penetration depth, are experimentally determined under diesel-like ambient conditions. In addition, Mie measurements are carried out to obtain information about the liquid phase. Lastly, mass flow rate measurements are carried out.
3.1 Chamber and optical measurement techniques
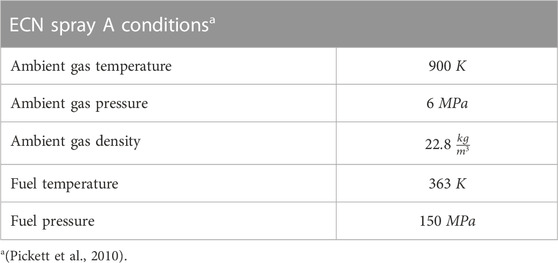
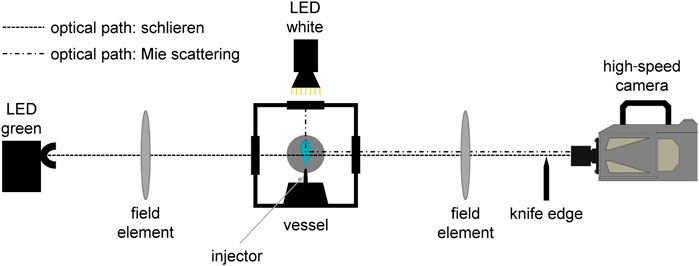
The mixture formation and the combustion inside a diesel engine are very engine-specific due to the number and size of the valves, the positioning of the injector and the resulting charge motion. Furthermore, it is difficult to get optical access to the engine. Therefore, the experiments for the spray investigation are carried out at an optically accessible high-temperature and high-pressure constant volume injection chamber. The test rig is continuously scavenged with gas mixtures, which can be freely adjusted from pure nitrogen to pure air, making it possible to perform both inert and reactive investigations and a simulation of EGR as well. The scavenging gas passes through a three-stage electric heater at each top corner and flows through the chamber at very low velocities so that the gas environment is nearly static compared to the spray velocity. The gas temperature inside the vessel can be set from room temperature to 1,000 K, the pressure can be regulated from 0.1 MPa up to 10 MPa simultaneously. Both parameters are held constant during the experiments. A water cooler is installed at each lower corner to lower the gas temperature to room temperature so that the scavenging gas can be supplied to the exhaust air of the room in a decompressed form. A research fuel system, which can be used with different rails and injectors, provides the required fuel pressure up to 400 MPa. On five sides of the cubic chamber body silica windows are fitted while on the bottom flange an injector housing with an injector is installed. In this housing, the nozzle and the fuel in the nozzle can be conditioned within a temperature range of 243 K–373 K. The tests are usually carried out at a repetition rate of 1 Hz. In order to achieve comparable measurement results at different institutes, the ambient conditions are set according to the specifications of the Spray A operating point of the Engine Combustion Network, as described by (Pickett et al., 2010). A summary can be found in Table 3. Since chemical reactions must be avoided for the mixture formation study, the experiments are carried out under inert conditions. Instead of a mixture of 85 % of nitrogen and 15 % of oxygen, as defined by the Engine Combustion Network, pure nitrogen is used as ambient gas. To obtain data about the fuel spray and its mixture, optical measurement techniques are used. The optics are placed in such a way that the fuel spray is shown in side view. The gaseous penetration is measured with a typical schlieren setup (see Figure 2). Light from a monochromatic LED at 528 nm is parallelized by a lens with a diameter of 152 mm and a focal length of 1,216 mm and guided into the chamber via the optical access. Density gradients due to the spray result in a change of the refractive index, causing the previously parallel beams to be bent in different directions. The light beams are collected through a second lens with the same optical properties as the first one. Light beams of non-parallel origin are cut by a knife edge. The remaining light is recorded with a Photron SA-Z, which is equipped with a Tamron SP 70–200 mm F/2.8, at a framerate of 40,000 fps. To measure the liquid penetration, an additional setup is installed to record Mie scattered light. The green LED has to be switched off. Instead, there are white LED panels attached to the three free windows of the chamber (see Figure 2). The light scattered at the liquid phase is recorded via the schlieren optics, but the knife edge has to be removed. Both at schlieren and Mie scattering, 32 injections each are carried out, filmed and evaluated with a self-developed MATLAB code.
3.2 Mass flow rate measurement
The injected masses as well as the mass flow rates are determined with the commercially available HDA 500 from Moehwald. This device basically consists of a fuel-filled volume, into which the injector injects fuel. With the resulting increase of pressure and the speed of sound inside the volume, the change of mass can be calculated. An integration over the total injection event yields the total injected mass (Zeuch, 1961). For each operation point, 150 injections are recorded and the result is then averaged.
3.3 Injector
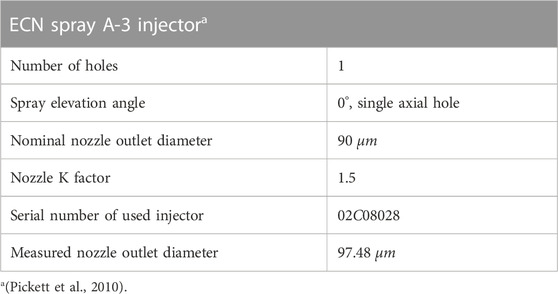
As already mentioned, the results of this work should be comparable with those of other institutes. For this purpose, not only the operating conditions must be standardized, but also the injector. Therefore, the third generation Spray A injector provided by the Engine Combustion Network is used. This injector is piezo actuated and equipped with an axial, convergent single hole nozzle with a diameter of 97 μm. Table 4 presents further information on the injector.
4 Results and discussion
4.1 Experimental results
Since each injection is highly individual and not reproducible in detail, 32 injections are recorded at each operation point for the optical investigations. Each injection is then analyzed separately, but an average value is calculated for the final result. The images are evaluated using a self-developed MATLAB program, which uses the intensity gradients for the processing of the schlieren pictures and a threshold operation for the Mie data. A detailed description can be found in (Peter, 2022) and (Rieß, 2017). In Figure 3, you can see a raw schlieren image on the left side and a Mie scattered image on the right side, both of which are overlaid with the evaluated contour. To calculate the spray cone angle, the definition of the Engine Combustion Network has been implemented (Naber and Siebers, 1996) into the code.
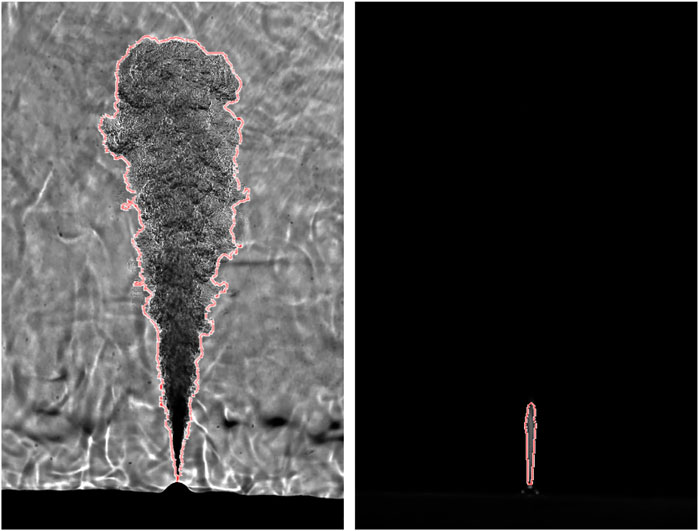
FIGURE 3. Schlieren and Mie scattering raw pictures of a single injection with the processed contour at 1380 μs after the electrical start of injection.
Figure 4 shows the liquid and gaseous penetration depth of the spray at the standard operating point for the three fuels. The time on the abscissa refers to the time after the electrical start of the injection (aeSoI). You can see that the gaseous penetration curves differ only minimally. According to Eq. 4, the penetration depth depends mainly on the nozzle hole geometry, the difference of fuel and ambient pressure, the ambient density and the orifice coefficients. Since only the latter is influenced by the fuel, it can be assumed that the nozzle coefficients are also very similar. Figure 4 also shows the penetration depth of the liquid phase. It can be seen that Dodecane has the shortest liquid length, followed by 1-Octanol and OME3−5. The enthalpy introduced via the air entrainment is relevant for the evaporation. Depending on the specific heat capacity, the boiling point and the enthalpy needed for the evaporation of the fuel, the liquid lengths result. At this point, we will refrain from further analysis, as this is beyond the scope of this paper. The different injection durations result from different energizing times, because the measurements were originally carried out for a different purpose. Since only the steady state, which is achieved with all fuels, is to be considered here, the background of the measurements is not relevant.
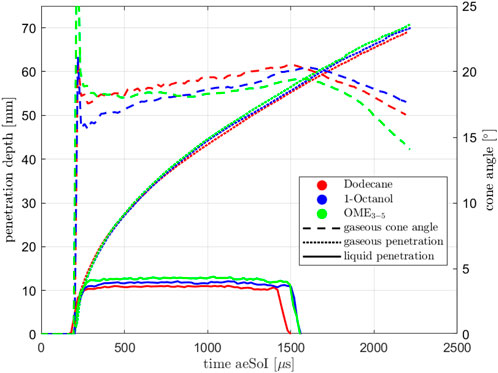
FIGURE 4. Penetration depths (gaseous and liquid) and cone angle at Spray A conditions for single injection.
Furthermore, Figure 4 shows the time-dependent angle of the gaseous penetration depth of the three fuels. The first strong increase of the spray angle results mainly from the evaluation and can be neglected in the following. You can see that Dodecane forms the widest spray, OME3−5 and 1-Octanol the narrowest, depending on the time. (Hiroyasu and Arai, 1990). show with Eq. 14 that there is a relationship between the fuel and the spray cone angle θ.
It can be seen that as the density of the fuel increases, the angle decreases. This is exactly what we observed in our experiment. Compared to Dodecane, OME3−5 and 1-Octanol have higher densities (see Table 2), resulting in smaller spray angles.
Quite similar observations should be expected for the multi-injections since they are basically two single injections which are closely timed to each other. Figure 5 shows the gaseous penetration depth, the liquid penetration depth and the cone angle for the multi-injection. You can see that for the liquid phase the pre-injection looks quite different for the three fuels, even if the same energizing times are chosen. With 1-Octanol, you get the longest injection in terms of time, followed by Dodecane and OME3−5, which is probably due to the different viscosities of the fuels (see Table 2). The penetration curves of the main injection, however, look quite similar to those of the single injection. Again, different energizing times are used for the main injection so that the duration of the injection does not provide any information about the hydraulic behavior. The lines of the gaseous penetration depths and angles no longer fit together like they do with a single injection. There are two explanations for this:
• In case of the multi-injection, the influence of the fuel on the opening and closing behavior of the injector becomes important. The different injection times despite the same energizing times lead to different amounts of mass being in the ambient after the pre-injection. The following main injection thus takes place under different ambient conditions in terms of composition and motion of the ambient gas. The environment is no longer at rest but in motion due to the conservation of momentum. The result is that in multi-injection events where the pre-injection is more intense, the main injection is slowed down less rigidly and thus penetrates more quickly. This is exactly what Figure 5 illustrates.
• Schlieren measurements with OME3−5 provide a quite poor signal compared to Dodecane and 1-Octanol, which is due to the refractive index. In addition, the very low mass of OME3−5 injected during the pre-injection makes the evaluation very difficult. In some cases, no signal can be detected between the first and the second injection, which leads to a quite narrow mean cone angle and a low mean penetration depth. Still, the spray is not expected to collapse at this point, this only results from the measurement technique.
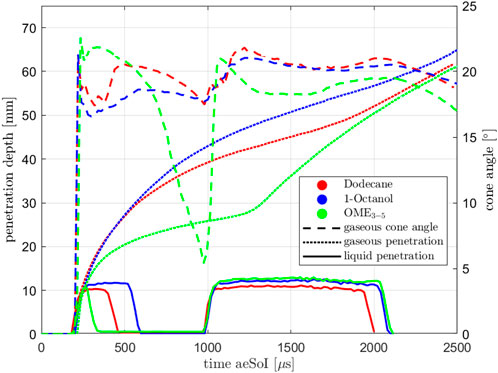
FIGURE 5. Penetration depths (gaseous and liquid) and cone angle at Spray A conditions for multi-injection.
A detailed evaluation of the mass rates and the injected masses as shown in Figure 6 is not presented in order to not exceed the scope of this paper. However, significant findings can be found at (Peter et al., 2020).
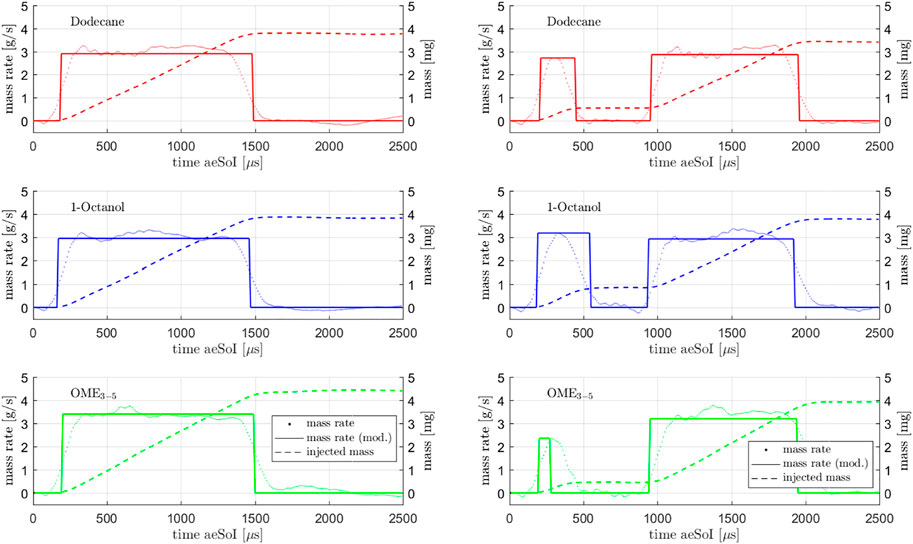
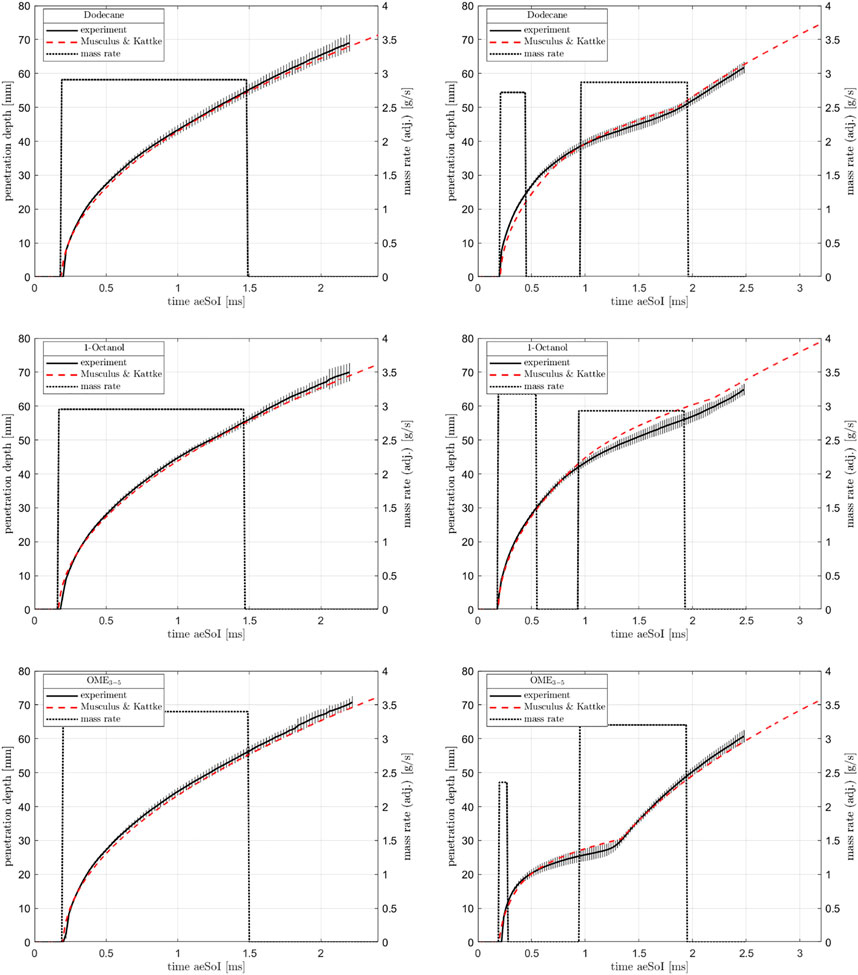
FIGURE 6. Mass rate, modeled mass rate and injected mass for single (left) and multi-injection (right).
4.2 Model-based results
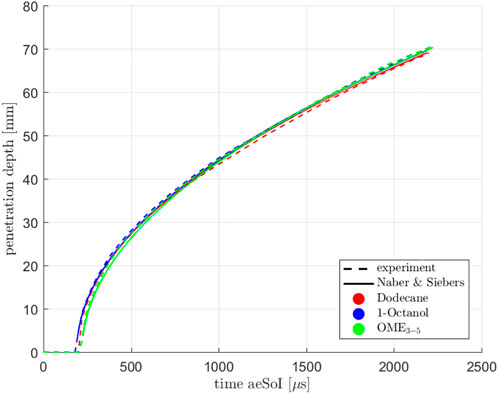
Based on the determined data, the two models are built and adjusted to match the penetration depth of the model with the one of the experiment. Naber and Siebers’ simple model can only handle a static mass flow rate, which is why only single injections can be investigated with it. The only parameters used for this model which have not yet been stated with exact numerical values are the orifice coefficients. Since no cavitation inside the nozzle is expected at these very high injection pressures, the area contraction coefficient can be assumed to be approximately 1. To calculate the velocity coefficient, it is possible to take the indirect way via the discharge coefficient which relates the measured mass flow rate to the theoretically possible mass flow rate. To determine an average mass flow rate from the measured profiles, the steady state section of the injection is used. Since it is not easy to define the start and the end of the injection only from the mass flow profiles, the boundaries are estimated. For Dodecane, we can approximate a mass flow rate of
Since this model is based on quite easy formulas, the results are not really detailed, which is why Musculus and Kattke have further developed the model resulting in almost the same input parameters being used. Based on injection rate profiles, the mass ratio in the entire spray can be calculated with their model. As mentioned several times, the momentum which is defined by mass and velocity plays a central role in the injection. (Pickett et al., 2013) have shown that the mass rate measurements are only partially correct and that the first rising edge is too shallow, meaning the initial momentum is too low. If the actually measured mass rates are used in Musculus and Kattke’s model, the penetration curves run too flat, which is why the measured mass rate curves are modeled according to the following method. The basic idea is to replace the real, measured profile by a rectangular profile. For the single and main injection, this profile is generated by normalizing the total injected mass to the injection time resulting from previous Mie measurements. Compared to the previous method of estimating a rough mean value, you can see that this method produces the same results for the mass flow rate. Since the opening and closing of the injector play a much more important role during the very short pre-injection than during the long main injection or single injection, a slightly different procedure is chosen here. We assume that the maximum measured mass flow rate is present over the entire pre-injection process. Here, too, the start and the end of the injection are determined with the help of the Mie data. Figure 6 shows the curves for the single injection on the left side and the ones for the multi-injection on the right side. Both the pre-injection and the main or single injection are timed in such a way that the calculated penetration curves fit optimally to the experimental ones (see Figure 9). Figures 10, 11 illustrate the calculated final results for the single and multi-injection at 1100 μs after the electrical start of the injection. On the left side, you can see the mass ratio between fuel and ambient gas and on the right side, you can see the air-fuel equivalence ratio. It is immediately noticeable that the spray is shown with a flat head, which does not represent reality. However, this area is not very relevant for the mixture formation. The background of the mass distribution is shown in white to make it easier to see where the fuel is located. A blue background would not provide a high enough contrast. In the case of the air-fuel equivalence ratio distribution, the background is not whitened. It can be seen that with the single injection, the mass distribution and also the penetration depths at the shown point in time are very similar for all three fuels, which is exactly what the previous model predicts. The λ-distribution also behaves as Naber and Siebers’ model shows: Dodecane forms the richest mixture, OME3−5 the leanest in the order of the stoichiometric air requirements of the fuels. It looks like the spray cone is getting narrower with OME3−5. This is only due to the fact that the mixture becomes very lean. The fuel mass distribution within the spray is the same as for Dodecane and 1-Octanol. In the case of multi-injection, the illustration of the mass distribution looks quite different. However, the reason for this is not a wrong model but the given injection profile based on the experimental Mie and schlieren data. As shown in Figure 5, there are already significant differences in the gas penetration depth, which are reproduced very well in the model. As mentioned, these deviations can be explained by the influence of the fuel on the opening and closing behavior of the injector. Furthermore, it can be seen that the pre-injection is “overtaken” by the main injection for all three fuels at this point. In the case of OME3−5, you can observe that the pre-injection forms a very lean mixture into which the main injection takes place. This is due to the low stoichiometric air requirement as well as to the fact that the pre-injection with OME3−5 has the lowest mass in comparison with the two other fuels. Dodecane and 1-Octanol form quite similar mixtures, as these substances are quite similar in their physical properties. Comparing the model results at a later point in time, when a steady state is reached, we obtain quite similar results to the model with the single injection. The mass distribution remains the same, which means that under identical boundary conditions, the mixture depends only on the stoichiometric air requirement of the fuel.
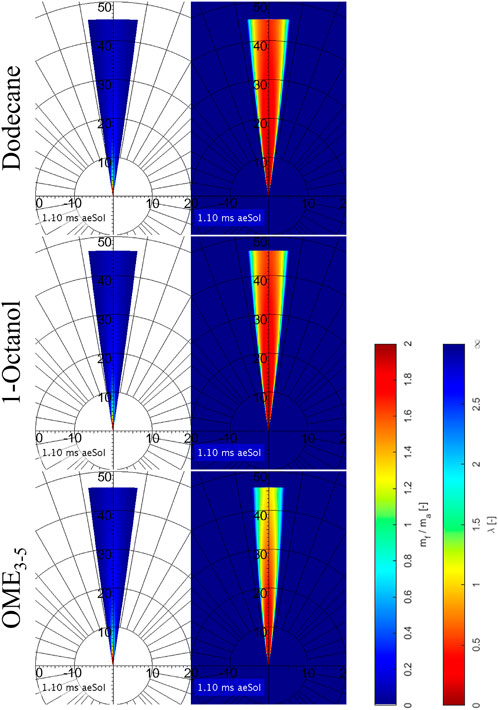
FIGURE 10. Mass ratio (left) and air-fuel ratio (right) calculated with Musculus and Kattke’s model for single injection.
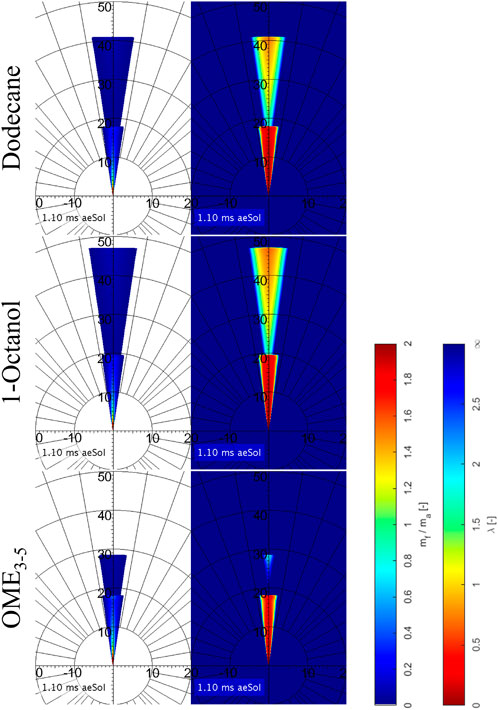
FIGURE 11. Mass ratio (left) and air-fuel ratio (right) calulated with Musculus and Kattke’s model for multi-injection.
5 Conclusion
The main target of this paper is to understand the mixture formation of the e-fuels 1-Octanol and OME3−5 in comparison with the diesel-like Dodecane in more detail. The study is based on experimental measurements on a single hole research injector of the Engine Combustion Network under Spray A reference conditions for single and multiple injections. The mass rates are determined using the commercially available HDA system from Moehwald. The spray geometry is determined applying Mie and schlieren measurement technique on an optically accessible high-pressure and high-temperature combustion test chamber. The measurement data are used to build the two best-known models for mixture formation description, namely Naber and Siebers’ as well as Musculus and Kattke’s. Major findings are:
• Independently of each other, both models provide the same results with different accuracy or with different temporal and spatial resolution.
• A method is presented to correct the errors in mass rate measurements and to model a corresponding injection rate profile.
• For the single injection, both models show that the mass distribution in the spray is independent of the used fuel, but different air-fuel equivalence distributions occur due to the stoichiometric air requirement of the fuels. In general: The lower the stoichiometric air requirement, the leaner the mixture gets as long as the fuel is the only parameter which is changed.
• With the pre-injection, you can clearly see that the viscosity and density of the fuel influences the opening and closing behavior of the nozzle. With OME3−5, the opening process does not only need more time but the injector does not even open completely. With 1-Octanol, it is the other way around. Despite the same energizing time, the injector is open for a longer time. This leads to significantly different mass ratios in temporal and spacial distribution. Nevertheless, Musculus and Kattke’s model shows that from the moment the fuel has left the nozzle, it is not relevant which fuel is used: The momentum balance applies.
For the later application in the engine, these results clearly show that a simple exchange of the fuel from fossil diesel to OME3−5 or 1-Octanol is already impossible due to the mixture formation. This work also serves as a basis for further investigations of the mentioned e-fuels. Mixture formation is the starting point for combustion since liquid substances cannot be ignited and must first be transferred into the gaseous phase and mixed with an oxidant. It is known that OME3−5 in particular burns fundamentally differently from conventional hydrocarbons. Therefore, the ignition properties of OME3−5 and 1-Octanol will be investigated in more detail in a next step.
Data availability statement
The raw data supporting the conclusion of this article will be made available by the authors, without undue reservation.
Author contributions
LS and SR performed by the Professorship for Fluid System Technology (FST) at Friedrich-Alexander-Universität Erlangen-Nürnberg under the direction of MW.
Acknowledgments
This paper is the scientific result of a research project undertaken by the FVV (The Research Association for Combustion Engines e.V.) and performed by the Professorship for Fluid System Technology (FST) at Friedrich-Alexander-Universität Erlangen-Nürnberg under the direction of MW. Special thanks are due to the AiF (German Federation of Industrial Research Associations e.V.) for funding the project. The research project was carried out in the framework of the industrial collective research programme (IGF/CORNET no. 274 EN). It was supported by the Federal Ministry for Economic Affairs and Climate Action (BMWK) through the AiF based on a decision taken by the German Bundestag.
Conflict of interest
The authors declare that the research was conducted in the absence of any commercial or financial relationships that could be construed as a potential conflict of interest.
Publisher’s note
All claims expressed in this article are solely those of the authors and do not necessarily represent those of their affiliated organizations, or those of the publisher, the editors and the reviewers. Any product that may be evaluated in this article, or claim that may be made by its manufacturer, is not guaranteed or endorsed by the publisher.
References
Akhtar, M. K., Dandapani, H., Thiel, K., and Jones, P. R. (2015). Microbial production of 1-octanol: A naturally excreted biofuel with diesel-like properties. Metab. Eng. Commun. 2, 1–5. doi:10.1016/j.meteno.2014.11.001
Deutsches Institut für Normung (2022). DIN EN 590:2022-05. Automotive fuels - Diesel - Requirements and test methods.
Falbe, J., Bahrmann, H., Lipps, W., and Mayer, D. (2013). Ullmann’s encyclopedia of industrial chemistry - alcohols, aliphatic. Hoboken: John Wiley.
Freedman, B., and Bagby, M. O. (1990). Predicting cetane numbers of n-alcohols and methyl esters from their physical properties. J. Am. Oil Chemists’ Soc. 67, 565–571. doi:10.1007/BF02540768
Held, M., Tönges, Y., Perlerin, D., Hartl, M., Wachtmeister, G., and Burger, J. (2019). On the energetic efficiency of producing polyoxymethylene dimethyl ethers from CO2 using electrical energy. Energy Environ. Sci. 12, 1019–1034. doi:10.1039/C8EE02849D
Hiroyasu, H., and Arai, M. (1990). Structures of fuel sprays in diesel engines. SAE Transactions 99 (3), 1050–1061. doi:10.4271/900475
Hiroyasu, K., and Tasaka, S. (1978). Study on the penetration of diesel spray. Trans. JSME 44, 3208–3219. doi:10.1299/kikai1938.44.3208
Kerschgens, B., Cai, L., Pitsch, H., Heuser, B., and Pischinger, S. (2016). Di-n-buthylether, n-octanol, and n-octane as fuel candidates for diesel engine combustion. Combust. Flame 163, 66–78. doi:10.1016/j.combustflame.2015.09.001
Kramer, I. U., Bothe, D., Reger, M., Gatzen, C., Marion, L., Frank, D., et al. (2021). Future fuels: FVV fuels study IV - The transformation of mobility to the GHG-neutral post-fossil age. Future fuels (FVV fuels study IV).
Kramer, U., Ortloff, F., and Stollenwerk, S. (2018). Future fuels: FVV fuels study III - Defossilizing the transportation sector: Options and requirements for Germany. (Frankfurt/Main: FVV).
Lequien, G., Skeen, S., Manin, J., and Pickett, L. (2015). Ignition quality effects on lift-off stabilization of synthetic fuels. SAE Int. J. Engines 8 (2), 625–634. doi:10.4271/2015-01-0792
Liu, J., Wang, H., Li, Y., Zheng, Z., Xue, Z., Shang, H., et al. (2016). Effects of diesel/PODE (polyoxymethylene dimethyl ethers) blends on combustion and emission characteristics in a heavy duty diesel engine. Fuel 177, 206–216. doi:10.1016/j.fuel.2016.03.019
Mahr, B. (2002). “Future and potential of diesel injection systems,” in Conference on Thermo- and Fluid-Dynamic Processes in Diesel Engines (Valencia).
Musculus, M. P. B., and Kattke, K. (2009). Entrainment waves in diesel jets. SAE Int. J. Engines 2 (1), 1170–1193. doi:10.4271/2009-01-1355
Naber, J., and Siebers, D. (1996). Effects of gas density and vaporization on penetration and dispersion of diesel sprays. SAE Transactions 105 (3), 82–111. doi:10.4271/960034
Peter, A., Siewert, B., Riess, S., Strauss, L., Pastoetter, C., and Wensing, M. (2020). Mixture Formation analysis of polyoxymethylenether injection. Atomization Sprays 30, 843–859. doi:10.1615/AtomizSpr.2020035250
Peter, A. (2022). Charakterisierung der Gemischbildung und Zündung in konventionellen Diesel- und Dual-Fuel-Brennverfahren. Düren: Shaker.
Pickett, L. M., Genzale, C. L., Bruneaux, G., and Malbec, L. M. (2010). Comparison of diesel spray combustion in different high-temperature, high-pressure facilities. SAE Int. J. Engines 3 (2), 156–181. doi:10.4271/960034
Pickett, L. M., Manin, J., Genzale, C. L., Siebers, D. L., Musculus, M. P. B., and Idicheria, C. A. (2011). Relationship between diesel fuel spray vapor penetration/dispersion and local fuel mixture fraction. SAE Int. J. Engines 4 (1), 764–799. doi:10.4271/2011-01-0686
Pickett, L. M., Manin, J., Payri, R., and Bardi, M. (2013). Transient rate of injection effects on spray development. SAE Technical Papers 2013-24-0001. doi:10.4271/2013-24-0001
Rieß, S. (2017). Einfluss von Kraftstoff und Abgasrückführung auf Gemischbildung und Verbrennung von dieselmotorischen Sprays (Aachen: Shaker).
Schmidt, P. R., Zittel, W., Weindorf, W., and Rakasha, T. (2016). Future fuels: FVV fuels study II - Renewables in transport 2050. (Frankfurt/Main: FVV).
Schmitz, N., Burger, J., Ströfer, E., and Hasse, H. (2016). From methanol to the oxygenated diesel fuel poly(oxymethylene) dimethyl ether: An assessment of the production costs. Fuel 185, 67–72. doi:10.1016/j.fuel.2016.07.085
Siebers, D. (1999). Scaling liquid-phase fuel penetration in diesel sprays based on mixing-limited vaporization. SAE Transactions 108 (3), 703–728. doi:10.4271/1999-01-0528
Soteriou, C., Andrews, R., and Smith, M. (1995). Direct injection diesel sprays and the effect of cavitation and hydraulic flip on atomization. SAE Transactions 104 (3), 128–153. doi:10.4271/950080
Wakuri, Y., Fujii, M., Amitani, T., and Tsuneya, R. (1960). Studies on the penetration of fuel spray in a diesel engine. Bull. JSME 3, 123–130. doi:10.1299/jsme1958.3.123
Weiß (2021). Optische Untersuchungen zur Gemischbildung, Selbstzündung und Rußbildung von Polyoxymethylendimethylether (OME). Düren: Shaker.
Zeuch (1961). Neue Verfahren zur Messung des Einspritzgesetzes und der Einspritzregelmäßigkeit von Diesel-Einspritzpumpen. MTZ 22, 344–349.
Nomenclature
a correction factor with a value of 0.66
A area (general)
Af cross-sectional area of fuel (in radial direction) exiting nozzle
Af,theo theoretic cross-sectional area of fuel (in radial direction) exiting nozzle
Ca orifice area-contraction coefficient
Cd orifice discharge coefficient
Cv orifice velocity coefficient
D sack chamber diameter of nozzle
d0 nozzle orifice diameter
L nozzle length
mf,theo theoretic maximum fuel mass flow rate
pa ambient gas pressure
pf fuel pressure
S gaseous penetration depth
t time
tb break-up time
tr transition time
U velocity (general)
Uf axial fuel velocity
Uf,theo theoretic (Bernoulli) axial fuel velocity
α full cone angle of the modeled spray
θ full cone angle of the experimental spray
λ air-fuel equivalence ratio
ρa density of the ambient gas
ρf density of the fuel
Keywords: mixture formation, e-fuel, fuel spray, OME, Octanol, Dodecane, ECN Spray A
Citation: Strauß L, Rieß S and Wensing M (2023) Mixture formation of OME3−5 and 1-Octanol in comparison with diesel-like Dodecane under ECN Spray A conditions. Front. Mech. Eng 9:1083658. doi: 10.3389/fmech.2023.1083658
Received: 29 October 2022; Accepted: 12 January 2023;
Published: 30 January 2023.
Edited by:
Noud Maes, Eindhoven University of Technology, NetherlandsReviewed by:
Francescso Di Sabatino, Sandia National Laboratories (DOE), United StatesCarlos Micó, Universitat Politècnica de València, Spain
Jonathan Martin, National Renewable Energy Laboratory (DOE), United States
Copyright © 2023 Strauß, Rieß and Wensing. This is an open-access article distributed under the terms of the Creative Commons Attribution License (CC BY). The use, distribution or reproduction in other forums is permitted, provided the original author(s) and the copyright owner(s) are credited and that the original publication in this journal is cited, in accordance with accepted academic practice. No use, distribution or reproduction is permitted which does not comply with these terms.
*Correspondence: Lukas Strauß, bHVrYXMuc3RyYXVzc0BmYXUuZGU=
 Lukas Strauß
 Sebastian Rieß
 Michael Wensing
