 Per-Anders Thorén1
 David B. Haviland
94% of researchers rate our articles as excellent or good
Learn more about the work of our research integrity team to safeguard the quality of each article we publish.
Find out more
ORIGINAL RESEARCH article
Front. Mech. Eng., 03 December 2021
Sec. Tribology
Volume 7 - 2021 | https://doi.org/10.3389/fmech.2021.765816
This article is part of the Research TopicTribology and Atomic Force Microscopy – Towards Single Asperity ContactView all 6 articles
We study high-speed friction on soft polymer materials by measuring the amplitude dependence of cyclic lateral forces on the atomic force microscope (AFM) tip as it slides on the surface with fixed contact force. The resulting dynamic force quadrature curves separate the elastic and viscous contributions to the lateral force, revealing a transition from stick-slip to free-sliding motion as the velocity increases. We explain force quadratures and describe how they are measured, and we show results for a variety of soft materials. The results differ substantially from the measurements on hard materials, showing hysteresis in the force quadrature curves that we attribute to the finite relaxation time of viscoelastic surface deformation.
Friction is a force that acts in opposition to the velocity of a sliding object. Unlike inertial force, which opposes a change in the velocity of an object with mass, friction is not associated with a fundamental property of matter. Friction depends on the structure and composition of the sliding surfaces, their relative velocity, the presence or absence of lubricant, and the contact force perpendicular to the plane of sliding. Most surfaces of contact are not perfectly planar and friction is concentrated at asperities or protrusions from the plane. The atomic force microscope (AFM) is an ideal instrument for measuring the force of friction on a single sliding asperity—the tip of an AFM probe. Here, we present measurements of friction forces on an AFM tip sliding on soft materials. We use a new method that allows for quantitative, nanometer-scale characterization of friction. We hope that this report will spark interest in using this method to study tribology of soft materials, a field of growing interest driven by a wide variety of applications in fields such as biology, food science, and health and personal care Liamas et al. (2020).
Friction gives rise to a lateral force F that is often assumed to be proportional to the contact force N, normal to the plane of sliding, |F| = μ|N|. This contact force should include adhesion, which depends on the contact area. Adhesion can give rise to different regimes of friction with soft materials, as has been studied in macroscopic contacts Homola et al. (1990), Popov et al. (2021). At the microscopic scale of a single asperity, we expect the coefficient of friction μ to depend on velocity. The Prandtl–Tomlinson model Popov (2010) describes velocity-dependent friction on a point-like asperity moving in a periodic potential, e.g., an AFM tip sliding along the atoms of a crystalline surface. At low velocity, the tip undergoes stick-slip motion, which crosses over to free-sliding motion at higher velocity. In a previous publication by Thorén et al. (2016), we have studied this crossover using a dynamic force measurement technique that we here apply to soft materials. Our previous results were well described by a modified Prantdel–Tomlisson model, which included an elastic or flexible AFM tip Krylov et al. (2006), Reimann and Evstigneev (2010), Martin-Jimenez et al. (2016).
The Prandtl–Tomlison model may be well suited to describe friction on rigid crystalline surfaces, where the periodic atomic potential provides a natural length scale for slipping. However, this model is not a good starting point to describe friction on soft materials that are amorphous and have the ability to flow. Soft materials are both elastic and viscous and both of these properties should play a role in friction. For an asperity with a very small radius of curvature, such as an AFM tip, adhesive capillary forces can dominate the contact mechanics when the tip radius approaches the elastocapillary length L = γ/E, where γ is the interfacial energy of the contacting surfaces and E is the elastic modulus Style et al. (2013). In such situations, the soft material surface may appear more like a liquid than a solid to the sliding AFM tip.
Thus, a stiff tip sliding on a soft surface is related to the problem of lubrication and the question of the slip or no-slip boundary conditions at the fluid-solid interface Neto et al. (2005). AFM has been used to indirectly probe fluid slippage at the 10 μm scale by measuring the normal force needed to drain a viscous fluid when compressed between a flat surface and a colloidal probe Craig et al. (2001), Bonaccurso et al. (2002). At the macroscopic scale, the shear force between a fluid and a solid interface can be detected with a quartz crystal micro-balance (QCM) Johannsmann (2015). The QCM has MHz resonant frequency, which, together with the relatively large amplitude of the bulk shear mode, allows for sensitive dynamic measurement of force at high velocity, but without spatial resolution. Other methods detect fluid slippage on nanometer-scale particles but without the ability to scan and image a surface Chakraborty et al. (2021), Collis et al. (2020). The method presented here combines the advantages of high-frequency dynamic force measurement with the high spatial resolution of AFM.
Shear force on a sliding AFM tip is also measured with a mode of AFM known as Frictional Force Microscopy (FFM) Bennewitz (2015). FFM is often said to probe “dynamic friction” because force is measured when the tip is sliding at constant velocity. However, the measurement of force is actually quasi-static, by which we mean that the force transduction (i.e., conversion of lateral force at the tip to the measured torsion in the cantilever) is made under the assumption that the cantilever is in quasi-static mechanical equilibrium with the force of friction. While sliding, a change in the torsion signal corresponds to a change in the frictional force, allowing one to image friction. Comparing images at various load forces, controlled with the AFM scanning feedback, one can map the friction coefficient of a surface Álvarez-Asencio et al. (2013). For a fixed signal-to-noise ratio, spatial resolution scales inversely with sliding velocity.
Thus FFM relies on the notion that the lateral force due to friction is constant (quasi-static) during the time spent at each image pixel. Here, we employ a dynamic measurement of force, where the cantilever is rapidly oscillating through several hundred oscillation cycles of varying amplitude, all during the time needed to image one pixel (2 ms). The frictional force is measured as a perturbation to this oscillatory motion by capturing it in the frequency domain, where the motion consists of many frequency components close to a cantilever resonance Haviland (2017).
Dynamic transduction of force exploits a resonance with high-quality Q to enhance the transducers’ response to an external force at the oscillation frequency. This factor Q enhancement in responsivity leads to a proportional improvement in measurement sensitivity, the latter being specified by the limiting noise in the measurement. In our experiment, we use the fundamental torsional resonance of the cantilever with Q = 1,567.
Figure 1A demonstrates this enhanced sensitivity, showing a measurement of the power spectral density of the total noise when the tip is free from the surface. We express the noise as an equivalent lateral deflection of the tip. In a narrow band centered on resonance, we can resolve the transducers’ intrinsic thermal noise above the detector noise background. This thermal torsion noise is actual fluctuations of the lateral motion of the tip caused by a frequency-independent torque noise (or lateral force noise at the tip). Resonance converts the torque noise to a frequency-dependent torsion noise, which comes to within a factor of two of the detector noise.
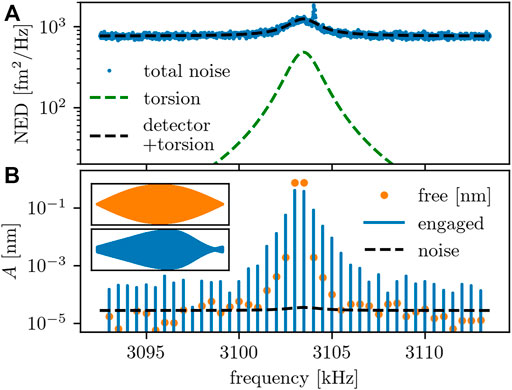
FIGURE 1. Thermal noise and multifrequency lock-in spectra. (A) Measured noise-equivalent-deflection (NED) after 500 averages. The black curve is a fit to a model which sums independent contributions: a frequency-dependent torsional noise of the cantilever and a frequency-independent noise of the detector. This fit calibrates the cantilever and detector, as explained in the text. (B) Measured response at 41 intermodulation product frequencies. Orange dots are the free response far away from the surface and blue bars are the engaged response. These spectra are a frequency-domain representation of the envelope modulating the rapid lateral oscillation of the tip. The time domain is shown in insets.
Dynamic force measurement also probes friction at a very high velocity. The high frequency of torsional resonance, in our case f0 = 3.1 MHz, results in sliding velocity vmax = A2πf0 = 194 cm/s for very small oscillation amplitude A ∼10 nm. This amplitude is roughly equal to the tip radius and it sets the image resolution when scanning.
We inertially actuate the torsional oscillation with a split-piezo shaker. As the tip oscillates back and forth in sinusodial sliding motion x(t), we resolve two components of the frictional force: a conservative force FI(A) in-phase with the harmonic motion and a dissipative force FQ(A) in-phase with the velocity v(t) Haviland (2017).
By slowly modulating A so that it remains approximately constant during the period of a single oscillation cycle T = 1/f0 = 0.32μs, we reveal how these Fourier components of the frictional force behave as functions of A.
We perform the measurement in the frequency domain using a method called Intermodulation Frictional Force Microscopy (ImFFM) Intermodulation Products (2021). The slow modulation of A is made at a frequency Δf ≪ f0 by driving the cantilever at two frequencies close to torsional resonance f1 = nΔf and f2 = (n + 1)Δf, where n is a large integer. The perturbing frictional force is nonlinear in the tip motion and therefore generates intermodulation products of the two drive frequencies, which form a dense comb of response at many frequencies close to resonance (see Figure 1B). A tuned multifrequency lock-in amplifier Intermodulation Products (2021) performs the two-frequency excitation and captures the amplitude and phase of the response at 41 intermodulation product frequencies, at each pixel, while scanning at normal speeds for dynamic AFM. Application of the inverse Fourier transform allows one to directly extract the force quadrature curves FI(A) and FQ(A) without any assumptions or model of the interaction between the tip and surface Platz et al. (2013), Haviland (2017).
Our previous report demonstrated ImFFM on a hard surface Thorén et al. (2016). Here, we report a study of a variety of soft surfaces where we observed hysteresis in the force quadrature curves, i.e., FI(A) and FQ(A), which are different for increasing and decreasing amplitude. This hysteresis is indicative of relaxation of the surface deformation on a time-scale that is longer than the period T of the oscillatory sliding motion. We have explained the observed hysteresis of force quadratures seen in standard ImAFM using a moving surface model of the viscoelastic surface Thorén et al. (2018a). We have not yet derived a similar model for lateral surface deformation to explain the friction force quadratures presented here.
Quantitative measurement of force requires calibration of the transducer. For dynamic force measurement, we must determine three mode constants of the free resonance: stiffness k, mass m, and damping η, or equivalently, stiffness, resonance frequency
We chose an AFM probe with relatively large flexural stiffness (nominal value 200 N/m, Bruker RTESPA-525) in order to counteract attractive tip-surface force so that we could adjust the loading force and avoid the jump-to-contact instability. The nominal tip radius is specified by the manufacturer to be 8 nm (max 12 nm). We measured the thermal motion noise of the lowest flexural mode, finding a resonance frequency of 516 kHz and quality factor 764. From a calculated hydrodynamic damping Sader et al. (2012), we calibrated the flexural stiffness to be 121 N/m.
The torsional mode is more difficult to calibrate because the thermal motion noise is a factor of two below the added noise of the detector. Nevertheless, with enough averaging of the noise data, a reasonable fit can be made (see Figure 1A), giving the lowest torsional resonance frequency f0 = 3.1 MHz and quality factor, Q = 1,500. We apply the method of Sader and Green to find the torsional stiffness Green et al. (2004), Thorén et al. (2018b). With the manufacturer specified tip height of 17 μm, we arrive at the stiffness to the frictional (lateral) force acting on the tip, kt = 2700N/m Thorén et al. (2016). With this stiffness, we apply the equipartition theorem to find the responsivity of the detector to lateral tip motion.
Figure 1B shows the frequency content of torsional response when driven by two strong tones at the two central frequencies in the response spectrum. In the time domain, this free motion corresponds to a beating waveform (see inset to Figure 1B). Some weak intermodulation at non-driven frequencies is seen in the free spectrum above the noise level, indicating weak nonlinearity of the cantilever's torsional resonance. When the cantilever engages the surface, a much stronger intermodulation response is seen to very high order, well above the noise floor. Only the amplitude is plotted in Figure 1B, but the lock-in’s ability to measure the phase at each frequency is crucial to the method.
The intermodulation spectrum is essentially a frequency-domain representation of the effect of friction on the envelope of the beating waveform. By downshifting the spectra and inverse Fourier transform, we compare the envelope of engaged motion to the envelope of free motion to extract the dynamic force quadrature curves FI(A) and FQ(A) Platz et al. (2013), Haviland (2017). When reconstructing the force quadrature curves, it is necessary to separate the tip-surface force from other long-range force contributions, such as electrostatic Law and Rieutord (2002) or lubrication Honig et al. (2010) forces. In order to isolate the frictional force from these “background” contributions, regardless of their origin, we use the method described by Borgani et al. Borgani et al. (2017).
We compare ImFFM measurements with the same cantilever and tip on five different material systems covering a wide range of stiffness, listed in Table 1. We perform a 2 μm square scan of each sample, varying scanning feedback setpoint as the scan progresses. The result is a banded image shown for two representative scans in Figure 2, where each band corresponds to a different setpoint value, input to the software as a percentage of the free amplitude response at frequency f1. The scanning feedback keeps the load force (vertical force) constant. However, we are not able to quantitatively measure the load force as the relatively stiff cantilever shows no discernible vertical deflection signal above the noise level.
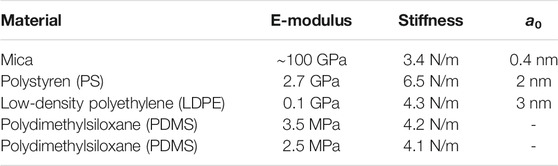
TABLE 1. The different polymer samples studied. E-moduli for polymers are the nominal value reported by the manufacturer.
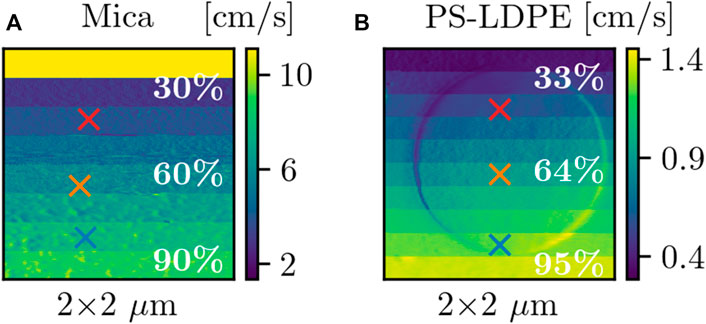
FIGURE 2. Setpoint study on mica and a polymer blend. The amplitude of the first drive frequency during a setpoint scan (setpoint values given in the image) of a mica surface (A) and a PS-LDPE polymer blend sample (B). Each setpoint value corresponds to a percentage of the free amplitude. In (A), the top domain is at a 120% setpoint value, corresponding to free response. The colormap depicts maximum tip velocity, where the velocity is reaching tens of cm/s. The interaction is analyzed at different pixels marked with X, and the force quadrature curves are shown with the corresponding color in Figure 3.
The images of homogeneous materials are essentially featureless, as for mica (Figure 2A), indicating that the surfaces are either atomically flat (as expected for mica) or that our lateral force measurement is not sensitive to surface topography (roughness) at a scale corresponding to the maximum amplitude of oscillation A ∼ 10 nm. The polymer blend does exhibit a large circular domain of LDPE in the PS matrix (Figure 2B). The color in the images maps the highest velocity vmax = A2πf0 reached at every pixel.
At each image pixel, we measure the amplitude dependence of frictional force quadratures FI(A) and FQ(A), which are shown at a few representative pixels and setpoint values in Figure 3, for four different surface materials. We used a crystalline solid mica as a reference surface, on which we measured a response very similar to graphite reported on in our previous publication Thorén et al. (2016). At sufficient loading force (red curves in Figure 3), one observes a characteristic behavior. For small oscillation amplitude A ≲0.25 nm, FI(A) shows a linear region. We showed that this region corresponds to the tip being stuck in a local minimum, where
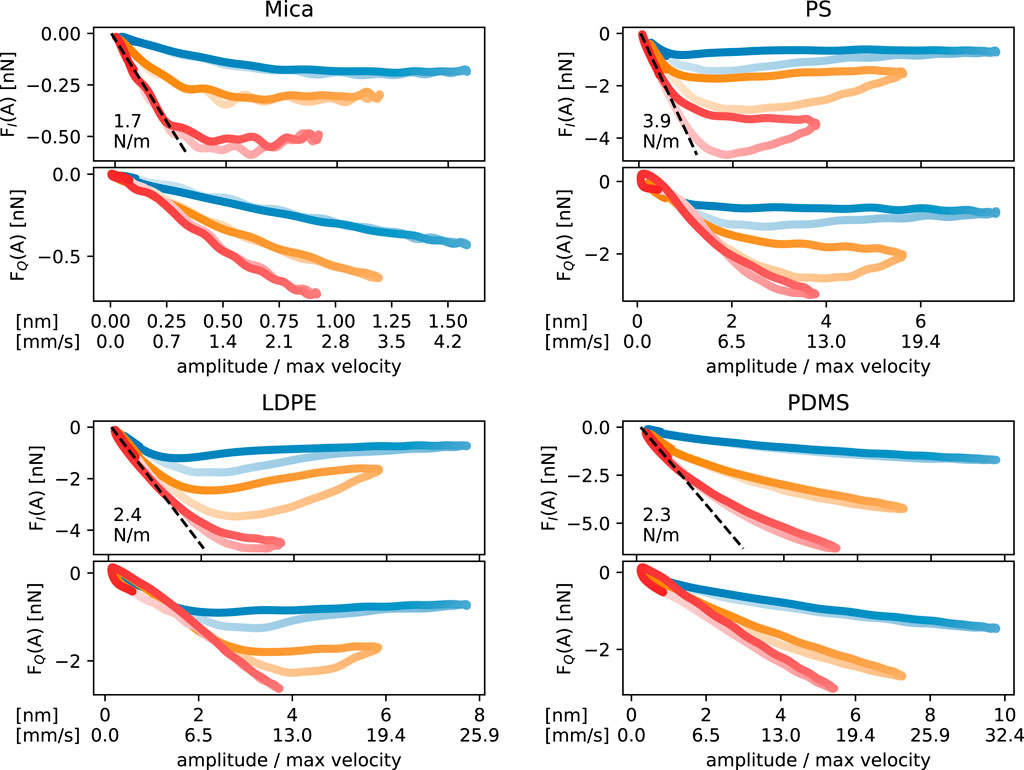
FIGURE 3. Force quadrature curves on mica. The conservative force quadrature FI and the dissipative force quadrature FQ at representative pixels are plotted as a function of the amplitude A of tip motion or maximum velocity vmax = Aω0. From blue → orange → red, the load force is increasing, controlled by the scanning feedback setpoint. Hysteresis is seen for PS and LDPE, where the force quadratures are larger for increasing A (lighter shade) than for decreasing A (darker shade). We explain this hysteresis as a viscoelastic effect due to the relaxation time of the surface deformation being longer than the period of tip oscillation.
On mica, when A ∼ 0.5 nm, corresponding to a few atomic lattice spacings, FI(A) exhibits a broad minimum when the tip is sliding back and forth with stick-slip motion, oscillating between neighboring minima in the periodic atomic potential. With increasing A, stick-slip motion gives way to smooth sliding in the atomic potential, with FI(A) typically decreasing on hard materials, such as graphite and mica. With increasing load |FQ(A)| is always an increasing function of A, corresponding to increasing dissipation or energy loss due to friction.
Qualitatively similar yet distinctly different behavior is seen on the softer materials. Recall that the same AFM tip is used for all materials. For both LDPE and PS (see Figure 3), we see the linear region at low A, but the measured slope is larger than on mica. The minimum in FI(A) occurs at a much larger amplitude than it does on mica. Furthermore, we see hysteresis, where FI(A) is larger for increasing A (lighter shade in Figure 3) and smaller for decreasing A (darker shade in Figure 3). For PDMS, we do not observe hysteresis and we find no distinct minimum in FI(A) for the region probed in the force quadratures.
We do not yet have a quantitative model to explain these experimental observations, but some features can be understood qualitatively. The low-amplitude slope of FI(A) is somewhat larger for soft materials than that observed with hard materials, which may be explained by a conical tip penetrating deeper into the soft material, making the asperity stiffer to friction. This notion of deeper penetration into the material is also consistent with the minimum in FI(A) occurring at larger A in the soft materials, compared to hard surfaces. The transition from the tip being stuck in the surface to stick-slip sliding motion is not associated with a crystalline lattice spacing in the soft material. Rather, it is conceivable that larger amplitude motion is needed to achieve free-sliding if the tip were buried deeper in a soft surface.
The hysteresis seen for LDPE and PS in Figure 3 is indicative of a finite relaxation time for healing of the viscoelastic surface deformation caused by the sliding asperity. One observes hysteresis in FI(A) and FQ(A) when this relaxation or healing time is larger than the period of oscillation, in this case
The raw data supporting the conclusion of this article will be made available by the authors, without undue reservation.
All authors contributed to the development of the methods used in this manuscript. P-AT performed all measurements. P-AT and DH contributed to the writing of this article.
This work was supported by the Swedish Research Council (VR).
DH, RB and DF are part owners of Intermodulation Products AB, which manufactures and sells the equipment used in this research.
The remaining author declares that the research was conducted in the absence of any commercial or financial relationships that could be construed as a potential conflict of interest.
All claims expressed in this article are solely those of the authors and do not necessarily represent those of their affiliated organizations, or those of the publisher, the editors and the reviewers. Any product that may be evaluated in this article, or claim that may be made by its manufacturer, is not guaranteed or endorsed by the publisher.
The authors are grateful to the Swedish Research Council (VR) for supporting this work.
Álvarez-Asencio, R., Pan, J., Thormann, E., and Rutland, M. W. (2013). Tribological Properties Mapping: Local Variation in Friction Coefficient and Adhesion. Tribol. Lett. 50, 387–395. doi:10.1007/s11249-013-0136-8
Bennewitz, R. (2015). Friction Force Microscopy. Cham: Springer International Publishing, 3–16. doi:10.1007/978-3-319-10560-4_1
Bonaccurso, E., Kappl, M., and Butt, H.-J. (2002). Hydrodynamic Force Measurements: Boundary Slip of Water on Hydrophilic Surfaces and Electrokinetic Effects. Phys. Rev. Lett. 88, 076103. doi:10.1103/PhysRevLett.88.076103
Borgani, R., Thorén, P.-A., Forchheimer, D., Dobryden, I., Sah, S. M., Claesson, P. M., et al. (2017). Background-force Compensation in Dynamic Atomic Force Microscopy. Phys. Rev. Appl. 7, 064018. doi:10.1103/PhysRevApplied.7.064018
Chakraborty, D., Uthe, B., Malachosky, E. W., Pelton, M., and Sader, J. E. (2021). Viscoelasticity Enhances Nanometer-Scale Slip in Gigahertz-Frequency Liquid Flows. J. Phys. Chem. Lett. 12, 3449–3455. doi:10.1021/acs.jpclett.1c00600
Collis, J. F., Olcum, S., Chakraborty, D., Manalis, S. R., and Sader, J. E. (2020). The Measurement of Navier Slip on Individual Nanoparticles in Liquid. Nano Lett. 21, 4959–4965. doi:10.1021/acs.nanolett.1c00603
Craig, V. S., Neto, C., and Williams, D. R. (2001). Shear-dependent Boundary Slip in an Aqueous Newtonian Liquid. Phys. Rev. Lett. 87, 054504. doi:10.1103/PhysRevLett.87.054504
Granato, E., and Ying, S. C. (2010). Non-monotonic Velocity Dependence of Atomic Friction. Tribol. Lett. 39, 229–233. doi:10.1007/s11249-010-9595-3
Green, C. P., Lioe, H., Cleveland, J. P., Proksch, R., Mulvaney, P., and Sader, J. E. (2004). Normal and Torsional spring Constants of Atomic Force Microscope Cantilevers. Rev. Scientific Instr. 75, 1988–1996. doi:10.1063/1.1753100
Haviland, D. B. (2017). Quantitative Force Microscopy from a Dynamic point of View. Curr. Opin. Colloid Interf. Sci. 27, 74–81. doi:10.1016/j.cocis.2016.10.00210.1016/j.cocis.2016.10.002
Higgins, M. J., Proksch, R., Sader, J. E., Polcik, M., Mc Endoo, S., Cleveland, J. P., et al. (2006). Noninvasive Determination of Optical Lever Sensitivity in Atomic Force Microscopy. Rev. Scientific Instr. 77, 013701. doi:10.1063/1.2162455
Homola, A. M., Israelachvili, J. N., McGuiggan, P. M., and Gee, M. L. (1990). Fundamental Experimental Studies in Tribology: The Transition from “Interfacial” Friction of Undamaged Molecularly Smooth Surfaces to “normal” Friction with Wear. Wear 136, 65–83. doi:10.1016/0043-1648(90)90072-I
Honig, C. D. F., Sader, J. E., Mulvaney, P., and Ducker, W. A. (2010). Lubrication Forces in Air and Accommodation Coefficient Measured by a thermal Damping Method Using an Atomic Force Microscope. Phys. Rev. E 81, 1–11. doi:10.1103/PhysRevE.81.056305
Hutter, J. L., and Bechhoefer, J. (1993). Calibration of Atomic‐force Microscope Tips. Rev. Scientific Instr. 64, 1868–1873. doi:10.1063/1.1143970
Intermodulation Products (2021). Unique Laboratory Equipment for Nonlinear Physics and Quantum Technology. Available at: http://intermodulation-products.com (Accessed August 27, 2021).
Johannsmann, D. (2015). The Quartz Crystal Microbalance in Soft Matter Research. Springer. doi:10.1007/978-3-319-07836-6
Krylov, S. Y., Dijksman, J. a., Van Loo, W. a., and Frenken, J. W. M. (2006). Stick-slip Motion in Spite of a Slippery Contact: Do We Get what We See in Atomic Friction. Phys. Rev. Lett. 97, 2–5. doi:10.1103/PhysRevLett.97.166103
Law, B. M., and Rieutord, F. (2002). Electrostatic Forces in Atomic Force Microscopy. Phys. Rev. B 66, 035402. doi:10.1103/PhysRevB.66.035402
Liamas, E., Connell, S. D., Ramakrishna, S. N., and Sarkar, A. (2020). Probing the Frictional Properties of Soft Materials at the Nanoscale. Nanoscale 12, 2292–2308. doi:10.1039/C9NR07084B
Martin-Jimenez, D., Chacon, E., Tarazona, P., and Garcia, R. (2016). Atomically Resolved Three-Dimensional Structures of Electrolyte Aqueous Solutions Near a Solid Surface. Nat. Commun. 7, 1–7. doi:10.1038/ncomms12164
Neto, C., Evans, D. R., Bonaccurso, E., Butt, H.-J., and Craig, V. S. J. (2005). Boundary Slip in Newtonian Liquids: a Review of Experimental Studies. Rep. Prog. Phys. 68, 2859–2897. doi:10.1088/0034-4885/68/12/r05
Platz, D., Forchheimer, D., Tholén, E. A., and Haviland, D. B. (2013). Interaction Imaging with Amplitude-Dependence Force Spectroscopy. Nat. Commun. 4, 1360. doi:10.1038/ncomms2365
Popov, V. L., Li, Q., Lyashenko, I. A., and Pohrt, R. (2021). Adhesion and Friction in Hard and Soft Contacts: Theory and experiment. Friction 9, 1688–1706. doi:10.1007/s40544-020-0482-0
Sader, J. E., Borgani, R., Gibson, C. T., Haviland, D. B., Higgins, M. J., Kilpatrick, J. I., et al. (2016). A Virtual Instrument to Standardise the Calibration of Atomic Force Microscope Cantilevers. Rev. Scientific Instr. 87, 093711. doi:10.1063/1.4962866
Sader, J. E., Sanelli, J. A., Adamson, B. D., Monty, J. P., Wei, X., Crawford, S. A., et al. (2012). Spring Constant Calibration of Atomic Force Microscope Cantilevers of Arbitrary Shape. Rev. Scientific Instr. 83, 103705. doi:10.1063/1.4757398
Style, R. W., Hyland, C., Boltyanskiy, R., Wettlaufer, J. S., and Dufresne, E. R. (2013). Surface Tension and Contact with Soft Elastic Solids. Nat. Commun. 4, 2728. doi:10.1038/ncomms3728
Thorén, P.-A., Borgani, R., Forchheimer, D., Dobryden, I., Claesson, P. M., Kassa, H. G., et al. (2018a). Modeling and Measuring Viscoelasticity with Dynamic Atomic Force Microscopy. Phys. Rev. Appl. 10, 024017. doi:10.1103/PhysRevApplied.10.024017
Thorén, P.-A., Borgani, R., Forchheimer, D., and Haviland, D. B. (2018b). Calibrating Torsional Eigenmodes of Micro-cantilevers for Dynamic Measurement of Frictional Forces. Rev. Scientific Instr. 89, 075004. doi:10.1063/1.5038967
Keywords: frictional force microscopy, slip length, force quadratures, intermodulation, atomic force microscopy
Citation: Thorén P-A, Borgani R, Forchheimer D and Haviland DB (2021) High-Velocity Shear and Soft Friction at the Nanometer Scale. Front. Mech. Eng 7:765816. doi: 10.3389/fmech.2021.765816
Received: 27 August 2021; Accepted: 18 October 2021;
Published: 03 December 2021.
Edited by:
Dirk Spaltmann, Federal Institute for Materials Research and Testing (BAM), GermanyReviewed by:
Iakov A. Lyashenko, Technical University of Berlin, GermanyCopyright © 2021 Thorén, Borgani, Forchheimer and Haviland. This is an open-access article distributed under the terms of the Creative Commons Attribution License (CC BY). The use, distribution or reproduction in other forums is permitted, provided the original author(s) and the copyright owner(s) are credited and that the original publication in this journal is cited, in accordance with accepted academic practice. No use, distribution or reproduction is permitted which does not comply with these terms.
*Correspondence: David B. Haviland, aGF2aWxhbmRAa3RoLnNl
Disclaimer: All claims expressed in this article are solely those of the authors and do not necessarily represent those of their affiliated organizations, or those of the publisher, the editors and the reviewers. Any product that may be evaluated in this article or claim that may be made by its manufacturer is not guaranteed or endorsed by the publisher.
Research integrity at Frontiers
Learn more about the work of our research integrity team to safeguard the quality of each article we publish.