
95% of researchers rate our articles as excellent or good
Learn more about the work of our research integrity team to safeguard the quality of each article we publish.
Find out more
ORIGINAL RESEARCH article
Front. Mech. Eng. , 08 November 2021
Sec. Engine and Automotive Engineering
Volume 7 - 2021 | https://doi.org/10.3389/fmech.2021.744283
This article is part of the Research Topic Particulate Matter Emissions from Conventional and Reformulated Fuel Combustion: Advances in Experiments and Simulations View all 9 articles
 Juan J. Cruz 1
 Ignacio Verdugo1
 Nicolás Gutiérrez-Cáceres2
 Felipe Escudero1
 Rodrigo Demarco1
 Fengshan Liu3Jérôme Yon4
 Dongping Chen5
 Andrés Fuentes1*
The main characteristics of pool fire flames are flame height, air entrainment, pulsation of the flame, formation and properties of soot particles, mass burning rate, radiation feedback to the pool surface, and the amount of pollutants including soot released to the environment. In this type of buoyancy controlled flames, the soot content produced and their subsequent thermal radiation feedback to the pool surface are key to determine the self-sustainability of the flame, their mass burning rate and the heat release rate. The accurate characterization of these flames is an involved task, specially for modelers due to the difficulty of imposing adequate boundary conditions. For this reason, efforts are being made to design experimental campaigns with well-controlled conditions for their reliable repeatability, reproducibility and replicability. In this work, we characterized the production of soot in a surrogate pool fire. This is emulated by a bench-scale porous burner fueled with pure ethylene burning in still air. The flame stability was characterized with high temporal and spatial resolution by using a CMOS camera and a fast photodiode. The results show that the flame exhibit a time-varying propagation behavior with a periodic separation of the reactive zone. Soot volume fraction distributions were measured at nine locations along the flame centerline from 20 to 100 mm above the burner exit using the auto-compensating laser-induced incandescence (AC-LII) technique. The mean, standard deviation and probability density function of soot volume fraction were determined. Soot volume fraction presents an increasing tendency with the height above the burner, in spite of a local decrease at 90 mm which is approximately the position separating the lower and attached portion of the flame from the higher more intermittent one. The results of this work provide a valuable data set for validating soot production models in pool fire configurations.
Pool fires are a common form of fire in industrial applications, representing a big concern in terms of fire science research. This point is manifested by the number of relevant studies in the last few decades, with more than 1,000 articles published since 1966 (Liu et al., 2020), still being an active topic. This configuration addresses the study of fires resulting from liquid fuel spills, which may rapidly become a severe fire hazard. Also, pool fires can be produced by the accidental ignition of fuel tanks and containers, generating large fire plumes that can sustain over time, with the subsequent risk to the equipment, infrastructure and safety of the people in the surrounding area of the event.
A pool fire is produced from a round pool filled with liquid fuel and it is a diffusion flame stabilized by the evaporating fuel vapor just above the fuel surface. The heat transfer from the flame to the fuel surface drives the fuel vaporization and fuel pyrolysis, producing a self-sustained naturally pulsating flame. This configuration can also be produced by liquefied gases and also melting plastics which spread over flat surfaces. Joulain (1998) extended the definition of pool fires to the establishment of a diffusion flame on top of a horizontal fuel surface where the buoyancy force is the controlling transport mechanism, grouping various configurations and fuels that produce similar flames. In real fires the heat feedback from the flame is dominated by thermal radiation (Hottel, 1959), which plays the main role in the vaporization of the fuel, controlling the mass burning rate and heat release rate. The last quantity represents the most essential parameter to characterize a pool fire according to Babrauskas (1983).
Soot is the primary species responsible for flame radiation in pool fires, and therefore the dominant contributor to the heat transfer mechanisms that sustain the flame. The large amount of particulate matter and also toxic gases emitted by pool fires have become a serious environmental issue when such events occur. Consequently, there has been a reduced number of large-scale pool fire studies nowadays, as the focus has shifted towards small-scale pool fires of different configurations and conditions (Liu et al., 2020). The decrease in pool fire size leads to a change in the radiation characteristics, as pointed out by Hottel (1959), and results in increased importance of convective heat transfer and/or the pan conduction. Extensive studies have been carried out to validate and improve models to predict the burning rate and the radiation from pool fires of different scales (e.g. Joulain, 1996; Hamins et al., 1999; De Ris et al., 2000; Chatterjee et al., 2015; Chatterjee and Wang, 2021; Noda et al., 2021; Yao et al., 2021). Regardless of the pool fire size, it is important to adequately quantify and model soot production and soot radiation. A large number of studies have also been performed on the characteristics of buoyant diffusion flames above gaseous fuel burners (Joulain, 1998). This configuration replaces the use of a liquid fuel with the injection of a gaseous or a pre-vaporized liquid fuel through a porous flat burner. This “surrogate” configuration removes the main uncertainty related to the fuel vaporization driven by the radiation feedback and allows to control the mass burning rate. By decoupling the problem of liquid fuel vaporization and fuel combustion, soot production and soot radiation can be studied in detail with significantly reduced uncertainty, seeking to reveal the process of soot formation and quantify the soot volume fraction distribution as well as radiative heat transfer. This approach also largely alleviates the 3R challenge in any experimental studies: Repeatability, Reproducibility, and Replicability. Also, this configuration provides clearly defined boundary conditions, enabling improved comparisons between numerical modeling and experimental data for model validation and improvements.
Soot volume fraction measurements in these bench-scale surrogate pool fires have been conducted using different techniques. Sivathanu and Faeth (1990a,b) characterized the overfire and underfire (top and bottom parts of the flames, respectively) by applying the laser attenuation technique on different gaseous flames burning in still air. Measurements were carried out at 632.8 nm with multiple passes across the fire to minimize experimental uncertainties, assuming a refractive index of 1.547 + 0.56i from Dalzell and Sarofim (1969). Köylü and Faeth (1992) then extended the analysis to the overfire zone of over-ventilated flames for various gaseous and liquid fuels, including also transmission electron microscope (TEM) image analysis of sampled soot. Xin and Gore (2005) applied planar laser-induced incandescence (PLII) measurements to methane and ethylene buoyant flames, providing a complete description of turbulent flames in vertical and horizontal planes. LII signals were calibrated through comparison to known soot volume fractions in a laminar coflow ethylene/air flame. Recently, Xiong et al. (2021) carried out LII measurements in ethylene buoyant turbulent flames under reduced oxygen conditions. Although the investigated flames were not bench-scale surrogate pool fires, it is still worth mentioning the studies of Zeng et al. (2019) and Kearney and Grasser (2017) conducted in large scale buoyant flames. These researchers applied the line-of-sight spectral intensity measurement with a pair of fast-infrared spectrometers and simultaneous PLII/CARS techniques, respectively, to obtain simultaneous soot volume fraction and soot/flame temperature.
In an effort to improve the LII technique, Snelling et al. (2005) proposed a calibration-independent technique for soot measurement by detecting the absolute light intensity. This technique is based on the calibration of the detection system by using a radiation source of known radiance. This technique requires the soot particle temperature for calculating the theoretical spectral emission intensity per unit volume of laser heated soot, which can be achieved by detecting LII signals in two spectral bands in the visible and near-infrared spectra. A recently developed version of this technique was proposed by Bouvier et al. (2021), measuring a two-dimensional field of soot volume fraction by using an intensified CCD camera with a relatively long gate to enhance the signal-to-noise ratio and the modeled soot temperature during the camera gate. This approach was applied to low-sooting turbulent flames, allowing to detect low signals by using long acquisition times.
In this study the auto-compensating laser-induced incandescence (AC-LII) technique is applied to measure the local soot volume fraction from an ethylene flame burning in still air, emulating a small-scale pool fire. A porous flat burner is used to slowly inject the gaseous fuel. The effective soot temperature during LII was deduced from the principle of two-color pyrometry. The calibration of the AC-LII technique is carried out with a calibrated integrating sphere. No corrections were applied to the incandescence signal attenuation (signal trapping), since the optical path in this study is fairly small (flame diameter is of 4 cm and the soot volume fractions are relatively low at below 2 ppm). Special attention is paid to the underfire region, before the flame breaks-up because of the turbulence. This zone shows the best conditions to apply the AC-LII technique. To the best of the authors knowledge, this is the first time the AC-LII technique is applied to a buoyancy-controlled diffusion flames.
Figure 1 shows the experimental set-up and optical rig arrangement to carry out AC-LII measurements in flames generated by the surrogate pool fire burner. In this study, photomultiplier tubes (PMT) were utilized to collect time-resolved LII signals in point-wise measurements. The burner used in this work (insert in Figure 1) was designed to establish unsteady non-premixed flames fueled with gaseous and pre-vaporized liquid fuels. In this work pure ethylene was chosen as the target fuel. Previous studies demonstrated that this fuel can emulate small scale pool fire flames of heptane introduced in a porous burner, since their heat of combustion and smoke point are quite similar (Zhang et al., 2016). A thermal mass flow controller (22) (Brooks SLA5850) fed a constant flow rate of 0.72 slpm of pure ethylene through a 40 mm diameter porous plug (2), establishing a flame height of ∼200 mm, similar in height of an ethylene flame studied by Zhang et al. (2016) to emulate a heptane pool fire. Flame lift-off was not observed during the experiments. For this fuel flow, the Froude number was estimated as Fr = 0.043 (Delichatsios 1987), indicating that flame instabilities are driven by buoyancy effects. A thermocouple (3) was installed on the external wall of the fuel chamber, formed by two porous plugs (2), in order to control and maintain the fuel temperature constant at 35°C. A dedicated water cooling re-circulation system (21) was also implemented to avoid potential damages of the porous plugs over an extended period of experiments. Water flows through a hollow ring (1) that surrounds the upper porous plug. A linear motor stage with micrometer resolution was used to move the burner vertically (8).
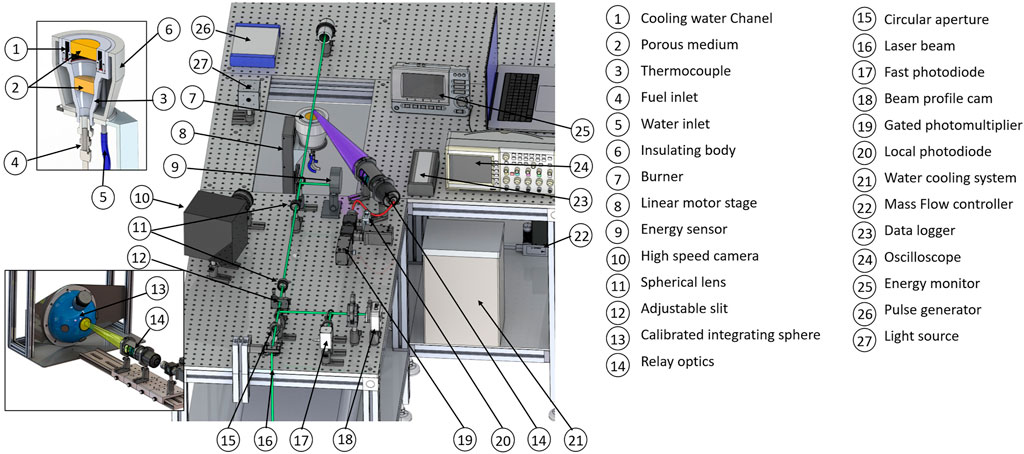
FIGURE 1. Schematic of the optical rig for AC-LII signal and flame intensity measurements, pool burner details and devices for optical calibration.
The flame geometry and structure was characterized with a Photron mini AX50 high speed camera coupled with an AF Nikon 50 mm (10) lens operated at only 250 frames per second (fps). A spectral bandpass filter centered at 800 ± 12.5 nm was coupled to lens to capture essentially the thermal radiation emitted by soot particles. In addition, local measurements of flame luminosity at 1,000 samples per second were carried out by a silicon Thorlabs PDA100A2 photodiode (20) focused to a point in the flame by a relay optics (14).
The second harmonic (532 nm) of a Litron LPY ND:YAG laser (16), operating at 10 Hz, was used to induce the incandescence signal of soot particles. A near top-hat laser energy distribution of 0.9 mm × 2.9 mm was generated and imaged at the burner axis by using a 5 mm circular aperture (15), a adjustable slit (12) and two spherical lens of f = 300 mm (15), according to the work of Snelling et al. (2005). During the experiments, the energy and spatial distribution of laser shots were monitored with a J-50MB-YAG energy sensor (9) coupled to a Coherent Labmax TOP monitor (25) and a LaserCam-HR II 2/3” beam profile (18), respectively. To avoid significant sublimation of soot particles, a laser fluence of 0.07 J/cm2 was used during all measurements. This value was necessary to maximize the signal-to-noise ratio of LII and is still considered in the low fluence region. Also, the temporal profile of each laser shot (12 ns FWHM) was measured with a fast photodetector EOT ET-2030 (17) coupled to a 1 GHz oscilloscope Lecroy WaveSurfer 3104z (24).
The laser induced signal emitted from the measurement volume on the burner axis was collected and transmitted to the photodetector system (19) by an achromatic telescope (1:1) of two 50 mm achromatic lens f = 150 mm (14) and a 1.000 μm optical fiber. The LII signal was spectrally split and filtered with a longpass dichroic filter and two interference filters (λ1 = 660 ± 5 nm and λ2 = 810 ± 5 nm), respectively. Finally, The LII signal was measured with two gated PMTs (Hamamatsu H11526-20) (19) and the voltage output signal was recorded with the 1 GHz oscilloscope. The optical alignment of the achromatic telescope (14) with the laser beam, at the burner axis, was performed by coupling the optical fibers to an light source composed of a small integrating sphere coupled to a tungsten lamp (27). The electronic devices were synchronized through an external Quantum 9,214 pulse generator (26). One thousand AC-LII measurements were captured for each height above the burner, until 100 mm.
An integrating sphere (Labsphere Helios model USLR-V08F-NMNN) (13) and a NIST calibrated spectrometer provide a stable and homogeneous light source (100 W) for calibration of the detection system, as shown in Figure 1. The achromatic telescope was placed in front of the sphere aperture, maintaining the same distance to the axis of the burner, i.e., retaining the focal length from the experiments. This procedure was verified with a commercial laser measuring and level device.
The conventional laser induced incandescence (LII) technique requires a calibration factor
The auto-compensating laser induced incandescence (AC-LII) technique Snelling et al. (2005); De Iuliis et al. (2005, 2007) allows to determine the soot volume fraction by measuring the incandescence temperature, Ts, and the absolute intensity of LII signals. The latter is achieved with the help of a light source of known emissive characteristics (see Figure 1). Therefore, the hypothesis that all soot particles are heated up to a very similar temperature as in conventional LII (Quay et al., 1994; Vander Wal and Weiland, 1994; Shaddix and Smyth, 1996; Ni et al., 1995; Michelsen et al., 2007) is no longer required. The main features of the methodology used in this study are explained below. The signal SLII emitted at a wavelength λ by a volume of uniform soot volume fraction fs and temperature Ts that reaches the photodetector (assuming signal trapping is negligible) is given by:
where τs is a detection efficiency that accounts for the geometric and spectral dependence of the detection system, ϵs = κaΔlv (Kirchoff’s law in the Rayleigh scattering regime) is the monochromatic soot emissivity, Δlv is the thickness of the laser sheet, and Δλ is the spectral window used for measurements which is assumed to be sufficiently narrow, and therefore, the spectral variations over the bandpass filter width are considered negligible.
By capturing the LII signal at two different wavelengths, an effective soot temperature Ts,eff can be derived from the ratio of SLII signals measured at two spectral bands. This Ts,eff represents an average temperature of heated soot particles within the probe volume based on their contributions to the incandescence signals. Note that the objective is to compute soot volume fraction and the determination of Ts,eff is a required step for this purpose. Ts,eff is obtained similarly to two-color pyrometry techniques (Legros et al., 2015; Escudero et al., 2016a; Escudero et al., 2016b; Cruz et al., 2021):
where kb, h and c are the Boltzmann constant, Planck constant, and the speed of light, respectively. The photodetector calibration factor τs can be determined by using a reference light source of known spectral radiance, such as a calibrated diffused light from an integrating sphere (De Iuliis et al., 2007; Crosland et al., 2011):
where Sref is the detector response to the reference source, Bref is the blackbody intensity of the reference source at temperature Tref and wavelength λref, and Gref is the PMT gain used during the calibration.
Assuming that the soot particles are small compared to the detection wavelengths (πdp/λ ≤ 0.3, where dp is the primary particle diameter), the soot volume fraction can be expressed in terms of the detected LII signal (Snelling et al., 2005):
where Gexp is the PMT gain used for the experimental measurements. The calibration and settings of the detection system define Sref, Bref and Gref, whereas the experimental settings define Gexp, whereas λ and Δlv remain unchanged during calibration and experiments. Then, with Sexp measured from experiments, Ts,eff evaluated from Eq. 2 and a model for the spectral dependence of E(m, λ), all the parameters of Eq. 4 are determined, allowing to obtain the soot volume fraction fs,AC−LII (from hereon, simply referred as fs).
Before performing the data processing, a calibration of the detection system is required. The left side of the Figure 2 shows the spectrum of the light source used to the calibration and the spectral bands of filters mounted in front of each PMT. The right side of Figure 2 shows the exponential dependence between the voltage control (PMT gain) and the corresponding voltage signal.
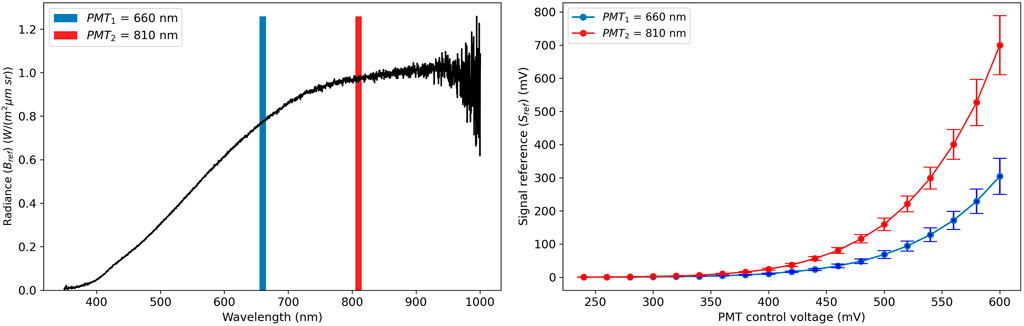
FIGURE 2. On left: Spectral radiance of the broadband light source used for calibration of AC-LII detection system. On right: Photomultiplier tubes (PMT) signal reference (Sref) for different voltage controls (PMT gain), measured during the calibration procedure.
A calibration chart was constructed for different PMT operation points, adjusting the voltage control (which is proportional to gain Gref) and recording the corresponding voltage response, Sref, with the oscilloscope. In all cases, the halogen lamp of integrating sphere was operated at full power and with a PMT gate similar to that used during the experiments (1,300 ns). Then, the LII signal can be computed with these parameters as SLII = BrefSexp/Sref. These parameters also allow us to obtain the calibration factor, τs, described by Eq. 3.
Figure 3 presents a sequence of the visible flame captured with a CMOS camera at 250 fps with an exposure time of 30 μs. The temporal movement of the reaction zone is a characteristic of buoyancy-controlled diffusion flames, where aerodynamic instabilities on the air side affect the flame propagation, causing the deformation of the reaction zone. The flame spreads vertically to reach the maximum height of 200 mm and then separates from the flame base; however, the lower part of the flame below about HAB = 90 mm always anchors on the porous plug burner surface. Similar patterns were observed throughout all the images taken and this behaviour has important implications to the AC-LII measurements. Due to the pulsation and lateral movement of the flame, a greater number of AC-LII measurements are necessary above 90 mm from the burner surface in order to obtain an adequate statistics of fs. The displayed period in Figure 3 (∼130 ms) indicates a pulsation frequency of ∼ 7.7 Hz, which is in agreement with the relationship reported by Joulain (1998) (see Figure 4). Therefore, a persistent zone exists below the detaching region, where an unsteady diffusion flame with annular structure flickers. (Xin and Gore, 2005). This zone is followed by a necking zone (above the persistent zone) that has a spatially fluctuating character and a turbulent plume and turbulent where the surface of the flame is twisted by the air flow.
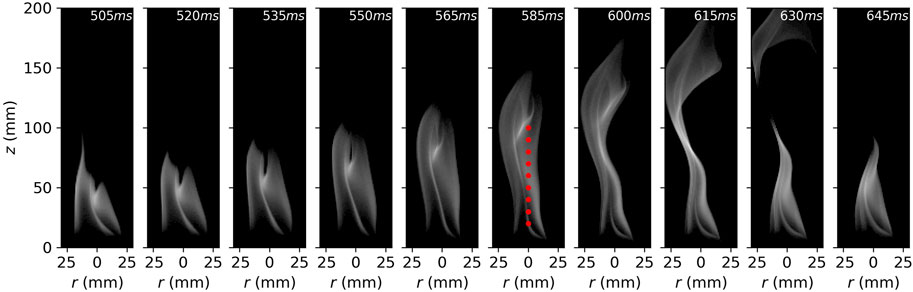
FIGURE 3. Flame sequence captured at 250 fps. The red dots indicate the nine HABs where the AC-LII measurements were performed.
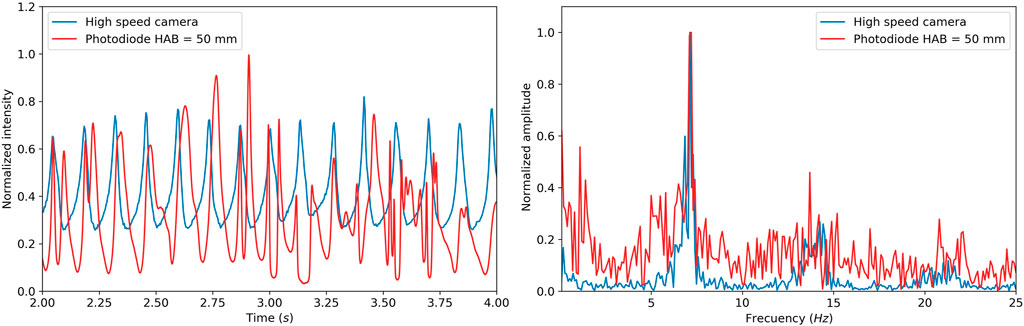
FIGURE 4. Temporal evolution of flame emission at different spectral regions. The high speed camera detected at 800 ± 12.5 nm meanwhile the photodiode detects between 320–1,100 nm. On left: the integration of the high speed camera image intensity and the local photodiode signal at HAB = 50 mm. On right: the Fast Fourier Transform analysis of the high speed camera and photodiode signal.
The left side of Figure 4 shows the temporal variations of flame luminosity signals captured by the fast photodiode, focused on a region of 2 mm diameter at 50 mm above the burner exit, and the flame emission captured by the high speed camera equipped with a bandpass filter entered at 800 nm. As a result of buoyant flow instability, both measurements show quasi-periodic behavior with similar locations of the peaks. The Fast Fourier Transform (FFT) distributions of the total image intensity and photodiode signal are reported in the right side of Figure 4, which display a very similar dominant frequency of 7.5 Hz. This frequency corresponds to the separation of the flame observed in the sequence of flame images (Figure 3).
Figure 5 illustrates the procedure for data analysis for one sample of the measurements at different heights above the burner exit (HABs), each sample in a different row. The first column shows the rime-resolved LII signals obtained from measurements by the PMTs at wavelengths of 660 and 810 nm. The second column shows the effective soot temperature computed with the ratio of SLII signals at both wavelengths (see Eq. 2). The soot absorption function was evaluated from the data of Bescond et al. (2016) who analyzed the behavior of E(m, λ) for flame-generated soot. The values presented for ethylene soot were used, i.e., E(m, 660) = 0.3861 and E(m, 810) = 0.373. With the help of Ts,eff and the SLII, the soot volume fraction can be readily determined. These results are shown on the third column. It is seen that the effective soot temperatures display relatively large scattering. Correspondingly, the soot volume fractions show even stronger scattered values, with a slight tendency to increase and become more scattered from 200 to 1,000 ns. A similar behavior is consistently found for the rest of the dataset. It is worth pointing out that the data at longer times are less reliable due to reduced signal-to-noise ratios.
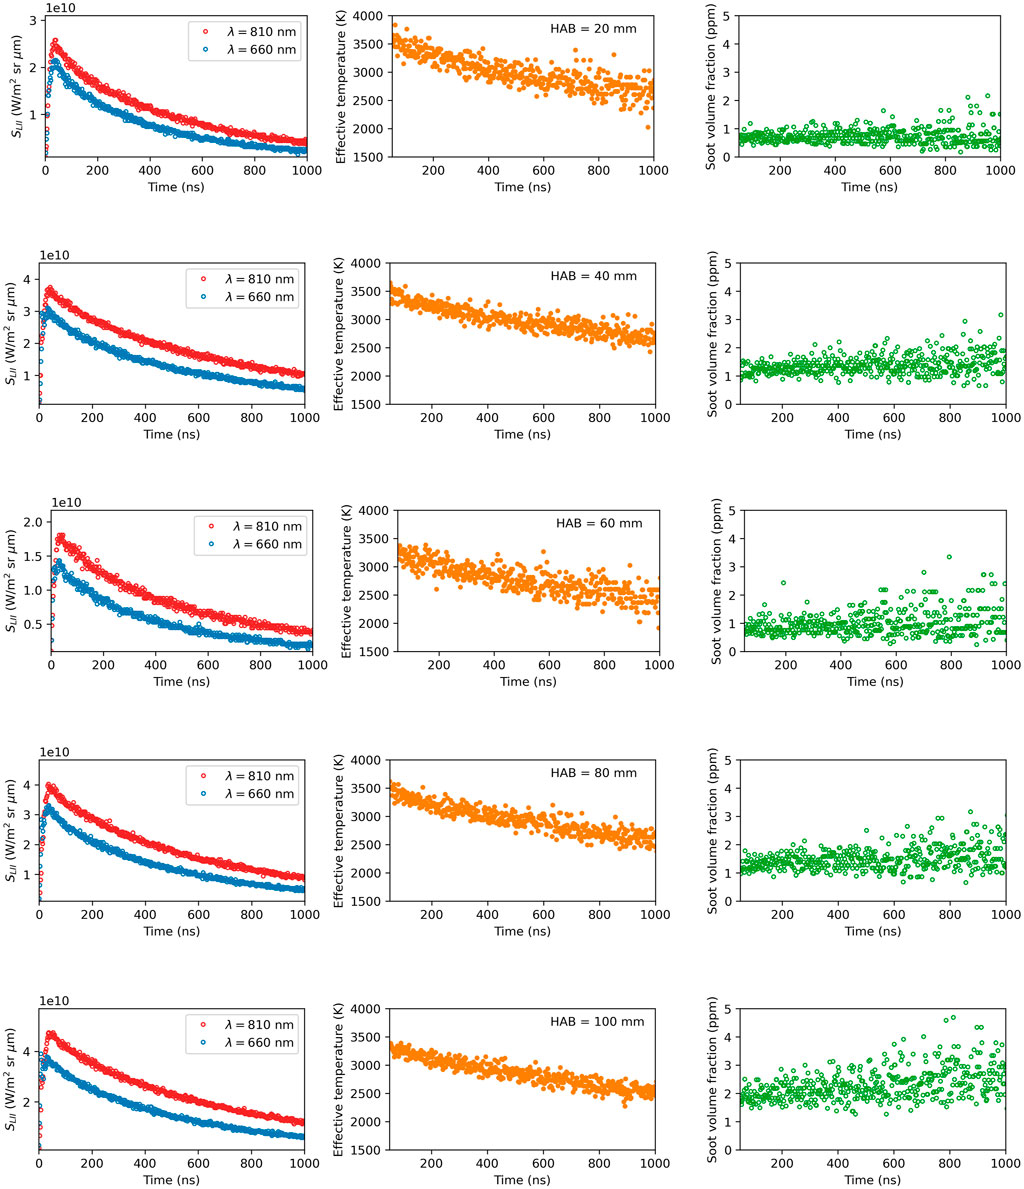
FIGURE 5. Each row represents the instantaneous time-resolved LII signal decay in logarithmic scale (left), the effective soot temperature (center), and soot volume fraction computed at both wavelengths (right), for HABs from 20 to 100 mm. Note that the effective soot temperature and the soot volume fraction are displayed at 35 ns after laser pulse reaches the flame.
The processed values of Ts,eff and fs are averaged between 35 and 60 ns for each sample with detected LII signal and for each height. These results are presented in Figure 6. The complete dataset was filtered in order to avoid measurements when the PMTs captured non-LII signals, such as only flame emission and background noise. The abscissa of the plot represents the number of the sample with detected LII signal. Thus, shorter filtered datasets (such as at HAB = 100 mm) denote a higher intermittency of the flame. The criteria applied for filtering was to retain only the measurements (each signal decay in time as shown in Figure 5) whose standard deviation was higher than 1.5 times the mean of all standard deviations. As the signals composed of mostly background noise or null present a standard deviation close to zero, whereas the exponential decay of LII signal in time results in a standard deviation greater than zero, these criteria correctly filter non-LII signals, which were manually verified. It is noticed that the number of remaining samples for higher HABs is highly reduced due to the intermittency of the soot production causes by the flow instabilities.. This figure also shows the arithmetic mean (dashed) and root mean squared (RMS, dotted) of Ts,eff and fs for each HAB. The turbulent behavior of the flame is captured by the time-resolved values for soot temperature and volume fraction. The effective soot temperature fluctuates between approximately 2800 K and 3500 K for the different HABs considered, whereas the soot volume fraction fluctuates between no soot and approximately 1 ppm for measurements at HABs ≥80 mm.
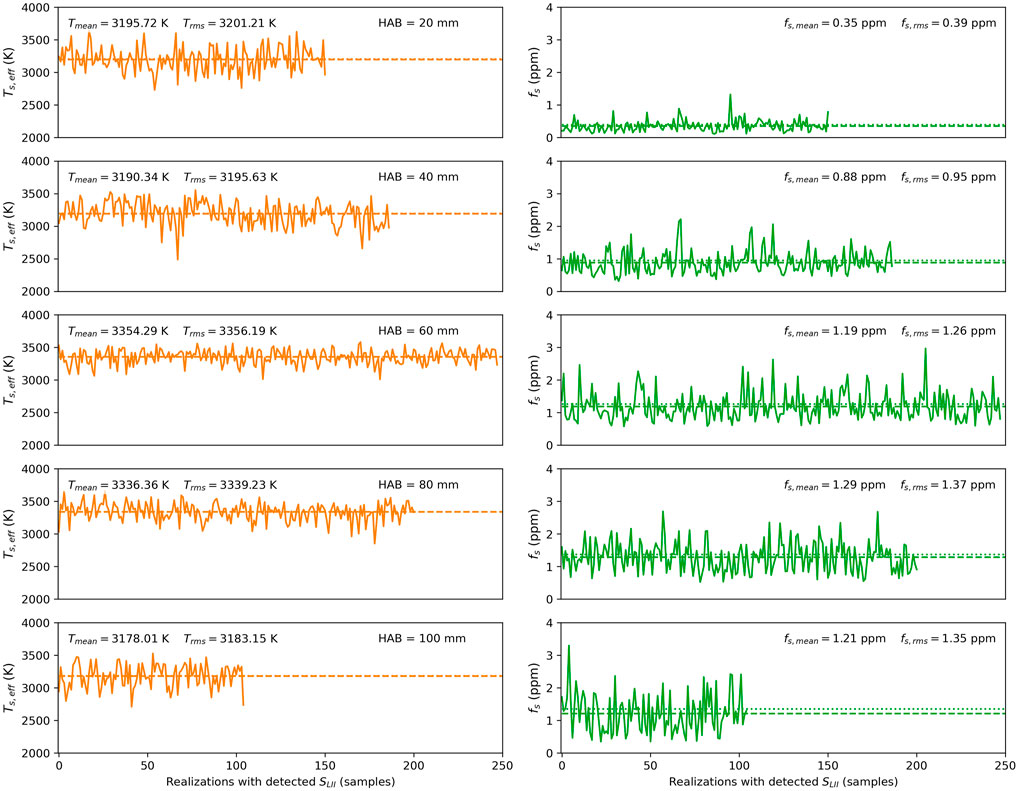
FIGURE 6. Evolution of instantaneous effective soot temperature and volume fraction at different HABs. The figures also show the mean and root mean squared values of the instantaneous values for each soot property. These results are averaged between 35 and 60 ns after the laser pulse.
Figure 7 shows the probability density function (PDF) of soot particles presenting soot volume fraction and temperature between given values, with 0.5 ppm resolution for fs and 100 K for effective temperature. In dashed and dotted lines are also presented the mean and RMS, respectively. Most measurements result in soot volume fractions ranging between 0.5 and 2.5 ppm with few values larger than 2.5 ppm at higher HABs. On the other hand, the effective temperatures range between 2750 K and 3750 K considering all HABs. These results can be also analyzed with the cumulative distribution functions F(x) where x = [fs, Ts,eff], which are plotted in dashed-dotted line (right axis).
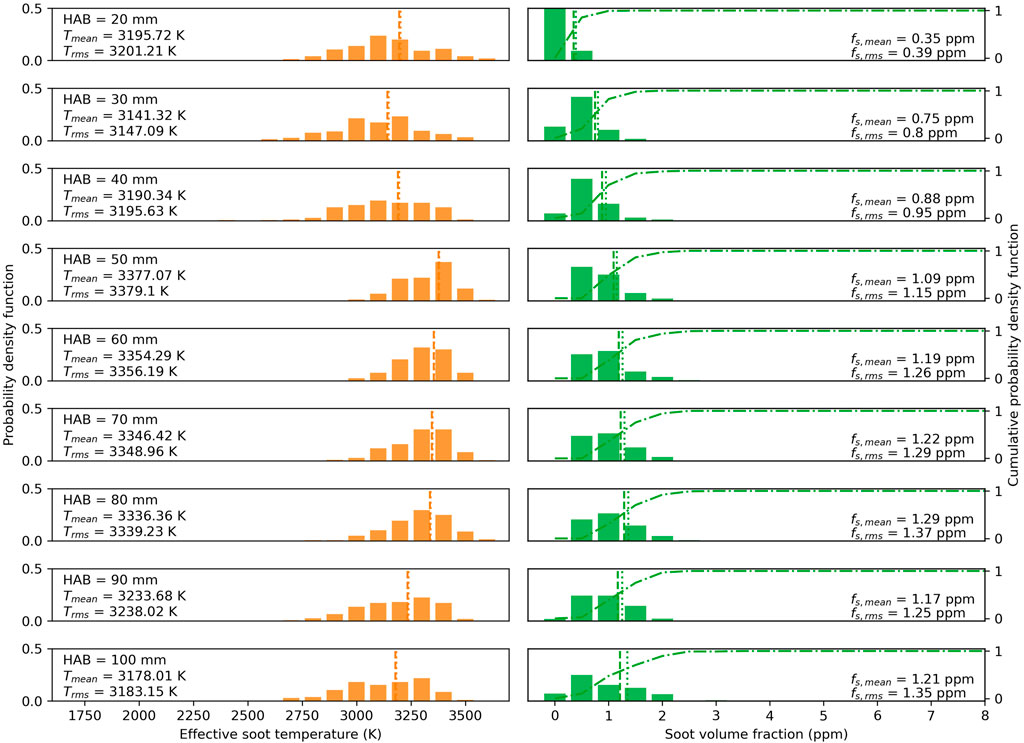
FIGURE 7. Probability density function (PDF, left axis) and cumulative PDF (right axis) of the instantaneous effective soot temperature and soot volume fraction at different HABs. The dashed and dotted vertical lines indicate the mean and RMS presented on Figure 6).
The left plot of Figure 8 shows the measured effective soot temperature used to computed soot volume fraction in terms of the mean and RMS values calculated before, as a function of the HAB. The error bars correspond to the standard deviation of the instantaneous fv and Ts,eff values. The points are slightly and artificially displaced from their actual HAB for better visualization. Ts,eff increases until 50 mm deleted, which is approximately the position separating the lower portion (attached) with the upper one (attached or detached) of the flame. The averaged values of soot volume fraction present an opposite behavior to Ts,eff. At lower heights the flame is more stable, which can be observed by the smaller error bars than those for higher HABs. Indeed, the maximum height analyzed (100 mm) displays the largest error bar. These results can be attributed to various effects. As stated above, a more stable flame behavior is characterized by lower standard deviation flow fluctuations, here represented as error bars in the plot. Thus, more unstable portions of the flame will present a higher probability of finding some high values of fs, contributing to increase the mean and RMS. In addition, the lower portion of the flame always attaches to the burner (see Figure 3); therefore, there is a higher probability of capturing a SLII signal with useful information. Conversely, the upper portion of the flame is either attached to or detached from the rest of the flame depending on the moment in time analyzed. Thus, this contributes to a larger range of values from the intermittent signals. It is noticed that the filtering process for data processing may have an effect on the mean and RMS by discarding the null signals and noise when there is essentially no soot. Therefore, results must be interpreted in terms of the mean quantities only when soot is detectable.

FIGURE 8. On left: Mean and RMS soot volume fraction and effective soot temperature at different HABs. Properties are the averaged values of the instantaneous measurements with detected LII signals, which in turn were the mean values between 35 and 60 ns after the laser pulse. On right: Relative errors of soot volume fraction (δfs/fs) disaggregated in terms of the contributions of each variable.
Figure 8 also shows the results of the error propagation analysis in terms of the contributions of each variable to the total error of soot volume fraction. The uncertainty δ of each variable was assumed or calculated based on experimental measurements. For example, the relative uncertainty of the absorption function was taken as δEm/Em ≈ 10%, which is a conservative estimate given the scattered data in the literature. (Yon et al., 2011). The factor FT multiplying the contribution of temperature to the fs error arises from the exponential dependence of the blackbody intensity with temperature. See the Supplementary Material for the detailed derivation of the error propagation analysis. The highest contribution to the relative error δfs/fs comes from the derivative of the effective soot temperature, whereas the combined contribution from the other sources is approximately 30% for different HABs. The uncertainty analysis results in a high error for HAB = 30 mm due to the inverse dependence of the error with temperature (see Supplementary Material).
The time-resolved and averaged values reported in this study from a surrogate pool fire flame in the persistent and intermittent region are useful to validate soot production models in small scale burner.
To the best of the authors’ knowledge, this work presents for the first time results of soot volume fraction measured by the auto-compensating laser induced incandescence technique applied to a surrogate pool fire flame. Measurements in the persistent flicker zone and the intermittent necking zone were performed with high temporal resolution along the flame centerline. The decay of the incandescence signal over time was measured at two wavelengths to determine an effective soot temperature, which was then used to estimate the soot volume fraction. The time-resolved measurements at different heights show fluctuating values of effective soot temperature and volume fraction. As the soot volume fraction depends exponentially on the effective temperature, fluctuations on effective soot temperature translate to large changes on the retrieved soot volume fraction, which is observed through the standard deviations of their respective instantaneous values. The soot volume fraction probability density function becomes slightly more uniform at locations where the intermittency of the flame is higher, due to the increased probability of detecting a large range of local conditions. The mean and root mean square of the instantaneous soot volume fraction and effective soot temperature show a tendency of increasing soot volume fraction with the height above the burner until 80 mm, except at the height of 90 mm which is approximately the position separating the lower and attached part with the upper and detached portion of the flame. The effective soot temperature evaluated at 35–60 ns after the laser pulse and under the conditions of this study remains in the range of 3000–3400 K for all heights analyzed. In order to complement these results, radiative heat flux measurements and temperature of the reactive zone are also performed. These time-averaged values reported in this study provide rich data for validating numerical models of soot production in a well-controlled original pool fire configuration. Further work is planned to determine the soot temperature and the interaction between the soot production and radiative heat transfer and to characterize the turbulent zone above the necking flame zone.
The raw data supporting the conclusions of this article will be made available by the authors, without undue reservation.
Conceived and designed the experiments: JC, IV, NC, and AF Conducted the experiments: JC, IV, NG, FE. and AF. Analyzed the data: JC, IV, NG, FE, RD, FL, JY, DC. and AF. All the authors discussed the results, wrote the paper, drew conclusions and edited the article.
The authors gratefully acknowledge the support provided by Chile’s National Agency for Research and Development (ANID) through research program PIA/ACT 172095 (Hi-Map Project), Fondecyt/Regular 1191758, Fondecyt/Regular 1191850, Fondecyt/Postdoctoral 3190860 and the Programa de Cooperación Internacional (PCI) NSFC 190009.
The authors declare that the research was conducted in the absence of any commercial or financial relationships that could be construed as a potential conflict of interest.
All claims expressed in this article are solely those of the authors and do not necessarily represent those of their affiliated organizations, or those of the publisher, the editors, and the reviewers. Any product that may be evaluated in this article, or claim that may be made by its manufacturer, is not guaranteed or endorsed by the publisher.
The Supplementary Material for this article can be found online at: https://www.frontiersin.org/articles/10.3389/fmech.2021.744283/full#supplementary-material
Babrauskas, V. (1983). Estimating Large Pool Fire Burning Rates. Fire Technol. 19, 251–261. doi:10.1007/BF02380810
Bescond, A., Yon, J., Ouf, F.-X., Rozé, C., Coppalle, A., Parent, P., et al. (2016). Soot Optical Properties Determined by Analyzing Extinction Spectra in the Visible Near-Uv: Toward an Optical Speciation According to Constituents and Structure. J. Aerosol Sci. 101, 118–132. doi:10.1016/j.jaerosci.2016.08.001
Bouvier, M., Yon, J., Liu, F., Cabot, G., and Grisch, F. (2021). Application of Planar Auto-Compensating Laser-Induced Incandescence to Low-Sooting Turbulent Flames and Investigation of the Detection Gate Width Effect. Aerosol Sci. Techn. 55, 1–16. doi:10.1080/02786826.2021.1935699
Chatterjee, P., Wang, Y., Meredith, K. V., and Dorofeev, S. B. (2015). Application of a Subgrid Soot-Radiation Model in the Numerical Simulation of a Heptane Pool Fire. Proc. Combust. Inst. 35, 2573–2580. doi:10.1016/j.proci.2014.05.045
Chatterjee, P., and Wang, Y. (2021). Numerical Simulations of Soot-Radiation from Buoyant Turbulent wall-bounded Diffusion Flames. Fire Saf. J. 120, 103105. doi:10.1016/j.firesaf.2020.103105
Crosland, B. M., Johnson, M. R., and Thomson, K. A. (2011). Analysis of Uncertainties in Instantaneous Soot Volume Fraction Measurements Using Two-Dimensional, Auto-Compensating, Laser-Induced Incandescence (2d-Ac-Lii). Appl. Phys. B 102, 173–183. doi:10.1007/s00340-010-4130-7
Cruz, J. J., Escudero, F., Álvarez, E., Figueira da Silva, L. F., Carvajal, G., Thomsen, M., et al. (2021). Three-wavelength Broadband Soot Pyrometry Technique for Axisymmetric Flames. Opt. Lett. 46, 2654–2657. doi:10.1364/ol.424529
Dalzell, W. H., and Sarofim, A. F. (1969). Optical Constants of Soot and Their Application to Heat-Flux Calculations. J. Heat Transfer 91, 100–104. doi:10.1115/1.3580063
De Iuliis, S., Cignoli, F., and Zizak, G. (2005). Two-color Laser-Induced Incandescence (2c-Lii) Technique for Absolute Soot Volume Fraction Measurements in Flames. Appl. Opt. 44, 7414–7423. doi:10.1364/ao.44.007414
De Iuliis, S., Migliorini, F., Cignoli, F., and Zizak, G. (2007). 2d Soot Volume Fraction Imaging in an Ethylene Diffusion Flame by Two-Color Laser-Induced Incandescence (2c-Lii) Technique and Comparison with Results from Other Optical Diagnostics. Proc. Combust. Inst. 31, 869–876. doi:10.1016/j.proci.2006.07.149
De Ris, J. L., Wu, P. K., and Heskestad, G. (2000). Radiation Fire Modeling. Proc. Combust. Inst. 28, 2751–2759. doi:10.1016/s0082-0784(00)80696-7
Delichatsios, M. A. (1987). Air Entrainment into Buoyant Jet Flames and Pool Fires. Combust. Flame 70, 33–46. doi:10.1016/0010-2180(87)90157-X
Escudero, F., Fuentes, A., Consalvi, J.-L., Liu, F., and Demarco, R. (2016a). Unified Behavior of Soot Production and Radiative Heat Transfer in Ethylene, Propane and Butane Axisymmetric Laminar Diffusion Flames at Different Oxygen Indices. Fuel 183, 668–679. doi:10.1016/j.fuel.2016.06.126
Escudero, F., Fuentes, A., Demarco, R., Consalvi, J.-L., Liu, F., Elicer-Cortés, J. C., et al. (2016b). Effects of Oxygen index on Soot Production and Temperature in an Ethylene Inverse Diffusion Flame. Exp. Therm. Fluid Sci. 73, 101–108. doi:10.1016/j.expthermflusci.2015.09.029
Hamins, A., Yang, J. C., and Kashiwagi, T. (1999). [Dataset]. A Global Model for Predicting the Burning Rates of Liquid Pool Fires. doi:10.6028/NIST.IR.6381
Hottel, H. C. (1959). Certain Laws Governing the Diffusive Burning of Liquids-A Review. Fire Res. Abstr. Rev. 1, 41–44.
Joulain, P. (1996). Convective and Radiative Transport in Pool and wall Fires: 20 Years of Research in Poitiers. Fire Saf. J. 26, 99–149. doi:10.1016/0379-7112(96)00004-5
Joulain, P. (1998). The Behavior of Pool Fires: State of the Art and New Insights. Symp. (International) Combust. 27, 2691–2706. doi:10.1016/s0082-0784(98)80125-2
Kearney, S. P., and Grasser, T. W. (2017). Laser-diagnostic Mapping of Temperature and Soot Statistics in a 2-m Diameter Turbulent Pool Fire. Combust. Flame 186, 32–44. doi:10.1016/j.combustflame.2017.07.018
Köylü, Ü. Ö., and Faeth, G. M. (1992). Structure of Overfire Soot in Buoyant Turbulent Diffusion Flames at Long Residence Times. Combust. Flame 89, 140–156. doi:10.1016/0010-2180(92)90024-J
Legros, G., Wang, Q., Bonnety, J., Kashif, M., Morin, C., Consalvi, J.-L., et al. (2015). Simultaneous Soot Temperature and Volume Fraction Measurements in axis-symmetric Flames by a Two-Dimensional Modulated Absorption/emission Technique. Combust. Flame 162, 2705–2719. doi:10.1016/j.combustflame.2015.04.006
Liu, J., Li, J., and Fan, C. (2020). A Bibliometric Study of Pool Fire Related Publications. J. Loss Prev. Process Industries 63, 104030. doi:10.1016/j.jlp.2019.104030
Melton, L. A. (1984). Soot Diagnostics Based on Laser Heating. Appl. Opt. 23, 2201. doi:10.1364/AO.23.002201
Michelsen, H. A., Liu, F., Kock, B. F., Bladh, H., Boïarciuc, A., Charwath, M., et al. (2007). Modeling Laser-Induced Incandescence of Soot: a Summary and Comparison of Lii Models. Appl. Phys. B 87, 503–521. doi:10.1007/s00340-007-2619-5
Ni, T., Pinson, J. A., Gupta, S., and Santoro, R. J. (1995). Two-dimensional Imaging of Soot Volume Fraction by the Use of Laser-Induced Incandescence. Appl. Opt. 34, 7083–7091. doi:10.1364/ao.34.007083
Noda, S., Merci, B., Tanaka, F., and Beji, T. (2021). Experimental and Numerical Study on the Interaction of a Water Mist spray with a Turbulent Buoyant Flame. Fire Saf. J. 120, 103033. doi:10.1016/j.firesaf.2020.103033
Quay, B., Lee, T.-W., Ni, T., and Santoro, R. J. (1994). Spatially Resolved Measurements of Soot Volume Fraction Using Laser-Induced Incandescence. Combust. Flame 97, 384–392. doi:10.1016/0010-2180(94)90029-9
Shaddix, C. R., and Smyth, K. C. (1996). Laser-induced Incandescence Measurements of Soot Production in Steady and Flickering Methane, Propane, and Ethylene Diffusion Flames. Combust. Flame 107, 418–452. doi:10.1016/s0010-2180(96)00107-1
Sivathanu, Y. R., and Faeth, G. M. (1990a). Soot Volume Fractions in the Overfire Region of Turbulent Diffusion Flames. Combust. Flame 81, 133–149. doi:10.1016/0010-2180(90)90060-5
Sivathanu, Y. R., and Faeth, G. M. (1990b). Temperature / Soot Volume Fraction Correlations in the Fuel-Rich Region of Buoyant Turbulent Diffusion Flames. Combust. Flame 81, 150–165. doi:10.1016/0010-2180(90)90061-U
Snelling, D. R., Smallwood, G. J., Liu, F., Gülder, Ö. L., and Bachalo, W. D. (2005). A Calibration-independent Laser-Induced Incandescence Technique for Soot Measurement by Detecting Absolute Light Intensity. Appl. Opt. 44, 6773–6785. doi:10.1364/AO.44.006773
Vander Wal, R. L., and Weiland, K. J. (1994). Laser-induced Incandescence: Development and Characterization towards a Measurement of Soot-Volume Fraction. Appl. Phys. B 59, 445–452. doi:10.1007/bf01081067
Xin, Y., and Gore, J. P. (2005). Two-dimensional Soot Distributions in Buoyant Turbulent Fires. Proc. Combust. Inst. 30, 719–726. doi:10.1016/j.proci.2004.08.126
Xiong, G., Zeng, D., Panda, P. P., and Wang, Y. (2021). Laser Induced Incandescence Measurement of Soot in Ethylene Buoyant Turbulent Diffusion Flames under normal and Reduced Oxygen Concentrations. Combust. Flame 230, 111456. doi:10.1016/j.combustflame.2021.111456
Yao, Y., Li, Y. Z., Ingason, H., Cheng, X., and Zhang, H. (2021). Theoretical and Numerical Study on Influence of Wind on Mass Loss Rates of Heptane Pool Fires at Different Scales. Fire Saf. J. 120, 103048. doi:10.1016/j.firesaf.2020.103048
Yon, J., Lemaire, R., Therssen, E., Desgroux, P., Coppalle, A., and Ren, K. F. (2011). Examination of Wavelength Dependent Soot Optical Properties of Diesel and Diesel/rapeseed Methyl Ester Mixture by Extinction Spectra Analysis and Lii Measurements. Appl. Phys. B 104, 253–271. doi:10.1007/s00340-011-4416-4
Zeng, D., Chatterjee, P., and Wang, Y. (2019). The Effect of Oxygen Depletion on Soot and thermal Radiation in Buoyant Turbulent Diffusion Flames. Proc. Combust. Inst. 37, 825–832. doi:10.1016/j.proci.2018.05.139
Keywords: porous burner, unsteady flame, soot concentration, diffusion flame, fuel surrogate
Citation: Cruz JJ, Verdugo I, Gutiérrez-Cáceres N, Escudero F, Demarco R, Liu F, Yon J, Chen D and Fuentes A (2021) Soot Volume Fraction Measurements by Auto-Compensating Laser-Induced Incandescence in Diffusion Flames Generated by Ethylene Pool Fire. Front. Mech. Eng 7:744283. doi: 10.3389/fmech.2021.744283
Received: 20 July 2021; Accepted: 28 September 2021;
Published: 08 November 2021.
Edited by:
Cinzia Tornatore, CNR—Istituto di Scienze e Tecnologie per l'Energia e la Mobilità Sostenibili (STEMS), ItalyReviewed by:
Vinny Gupta, The University of Sydney, AustraliaCopyright © 2021 Cruz , Verdugo, Gutiérrez-Cáceres, Escudero, Demarco, Liu, Yon, Chen and Fuentes. This is an open-access article distributed under the terms of the Creative Commons Attribution License (CC BY). The use, distribution or reproduction in other forums is permitted, provided the original author(s) and the copyright owner(s) are credited and that the original publication in this journal is cited, in accordance with accepted academic practice. No use, distribution or reproduction is permitted which does not comply with these terms.
*Correspondence: Andrés Fuentes, YW5kcmVzLmZ1ZW50ZXNAdXNtLmNs
Disclaimer: All claims expressed in this article are solely those of the authors and do not necessarily represent those of their affiliated organizations, or those of the publisher, the editors and the reviewers. Any product that may be evaluated in this article or claim that may be made by its manufacturer is not guaranteed or endorsed by the publisher.
Research integrity at Frontiers
Learn more about the work of our research integrity team to safeguard the quality of each article we publish.