- 1CNR Istituto di Scienze e Tecnologie per l’Energia e la Mobilità Sostenibili (STEMS), Naples, Italy
- 2Grastim J.V. S.r.l., Naples, Italy
A numerical study of the energy conversion process occurring in a lean-charge cogenerative engine, designed to be powered by natural gas, is here conducted to analyze its performances when fueled with mixtures of natural gas and several percentages of hydrogen. The suitability of these blends to ensure engine operations is proven through a zero–one-dimensional engine schematization, where an original combustion model is employed to account for the different laminar propagation speeds deriving from the hydrogen addition. Guidelines for engine recalibration are traced thanks to the achieved numerical results. Increasing hydrogen fractions in the blend speeds up the combustion propagation, achieving the highest brake power when a 20% of hydrogen fraction is considered. Further increase of this last would reduce the volumetric efficiency by virtue of the lower mixture density. The formation of the NOx pollutants also grows exponentially with the hydrogen fraction. Oppositely, the efficiency related to the exploitation of the exhaust gases’ enthalpy reduces with the hydrogen fraction as shorter combustion durations lead to lower temperatures at the exhaust. If the operative conditions are shifted towards leaner air-to-fuel ratios, the in-cylinder flame propagation speed decreases because of the lower amount of fuel trapped in the mixture, reducing the conversion efficiencies and the emitted nitrogen oxides at the exhaust. The link between brake power and spark timing is also highlighted: a maximum is reached at an ignition timing of 21° before top dead center for hydrogen fractions between 10 and 20%. However, the exhaust gases’ temperature also diminishes for retarded spark timings. Lastly, an optimization algorithm is implemented to individuate the optimal condition in which the engine is characterized by the highest power production with the minimum fuel consumption and related environmental impact. As a main result, hydrogen addition up to 15% in volume to natural gas in real cogeneration systems is proven as a viable route only if engine operations are shifted towards leaner air-to-fuel ratios, to avoid rapid pressure rise and excessive production of pollutant emissions.
Introduction
Decarbonizing energy generation is today a main issue, as related to the ONU Agenda 2030 as well as to fulfill the commitments assumed at a global level regarding the release of greenhouse gases (GHGs) within tolerable limits, so as to mitigate negative effects of climate changes. Currently considered measures to reduce the environmental impact deriving from the exploitation of fossil fuels in reciprocating internal combustion engines (ICEs), for both energy direct use and transportation purposes, include various alternatives.
Natural gas’ (NG) chemical properties and its easy use due to diffused accessibility to national distribution networks and/or to storage facilities make this fuel a largely used option for steady cogeneration purposes (Sandalci et al., 2019). NG is mainly composed by methane (CH4) and has a low carbon-to-hydrogen (C/H) ratio, so as to provide relatively low specific CO and CO2 emissions deriving from its combustion in spark ignition (SI) engines, combined with an intrinsically high knocking resistance that allows increasing the ICE compression ratio with consequent better overall efficiency (Çeper, 2012).
Issues related to the environmental impact of fossil-fuel–powered energy systems have recently brought increased attention towards the use of hydrogen (H2), due to the intrinsic possibility of this energy carrier to produce only water vapor from its combustion. This fuel is a valuable candidate for energy storage (Liu et al., 2020), especially for the so-called seasonal storage, to exploit possible electricity surpluses during peak power production periods to efficiently generate energy during shortage ones (Uchman et al., 2020) and to also avoid selling of electricity surpluses during low market price intervals. The problem, indeed, regards today many already installed cogeneration plants, especially in Italy, having up to the recent past profited of incentives to power generation and delivery to the national grid, but that, due to a massive energy production, currently undergo economic losses due to a scenario of overall lower energy selling prices.
In specific, the conversion of surplus of electric energy into chemical energy is the core element of the so-called power-to-gas concept and is performed through the process of water electrolysis, where electrical energy by only renewables can be used to derive both hydrogen and oxygen from water (Schiebahn et al., 2015). The hydrogen reconversion to electrical energy may occur through fuel cells, although its direct use in SI cogeneration engines is often a preferable route, especially to avoid investment costs in further components beside electrolyzers. The interest towards hydrogen use for combustion in SI engines, indeed, is gaining a renewed attention by energy saving companies (ESCos), as a way to reach an overall higher efficiency of cogenerative systems over a continuous yearly basis.
When dealing with hydrogen combustion in SI ICEs, its larger flammability limits compared to NG and gasoline and a knocking more resistant behavior must be considered: its oxidation process greatly differs from that of conventional fuels and would need proper redesign of the combustion chamber to face the higher propagation speed and the resulting higher pressure gradients and temperatures within the combustion chamber. Blending hydrogen with NG is an effective solution to profit of this energy vector without modifying too much the existing facilities and to simultaneously achieve greater efficiency in power production under electrical energy surplus occurrence. Hydrogen–NG blends also allow engine operation with lean mixtures with consequent positive effects on operating costs.
A summary of the main properties of NG, hydrogen, hydrogen-enriched compressed natural gas (HCNG, 10% of hydrogen in volume), and gasoline is reported in Table 1. Blending hydrogen with NG is not straightforward and always convenient as the hydrogen fraction needs to be optimized according to the specific engine operating condition. As the level of hydrogen increases at a fixed engine operative point, the in-cylinder temperature increases too, while the combustion duration reduces. The overall effect can be summarized in lower unburned hydrocarbons (UHC) and CO emissions, but in augmented nitrogen oxide (NOx) emissions, due to the higher combustion temperature and enhanced heat losses (Yan et al., 2018).

TABLE 1. Property comparison among NG, hydrogen, hydrogen–natural gas blend and gasoline (Çeper, 2012).
Many laboratory experiments were performed on hydrogen–NG or hydrogen–methane combustion to assess the advantages of these blends up to the release of a commercialized gas in the United States with the registered trademark of Hythane, a mixture of 15% H2 and 85% of NG in volume by Kavathekar et al. (2007). The achieved results are described into detail in the next section of this article. The benefits of hydrogen addition in reducing the overall noxious emissions and in improving thermal efficiencies are also demonstrated in the study by Pede et al. (2007).
However, despite the high number of conducted works, there are still some open challenges, for example, the choice of the right amount of hydrogen fraction allowable to avoid rapid pressure rises and, more importantly, defining the optimal combination that exists between hydrogen addition, the excess air ratio, and spark timing (Alrazen and Ahmad, 2018; Visciglio, 2019). This is especially relevant to cogeneration purposes, where SI engines, also of very large size, are powered extremely lean and with high supercharging pressure, so as to reach extremely interesting thermal efficiencies for this kind of combustion concept.
The present study intends to give a contribution in this direction. In this perspective, a numerical simulation approach is followed, as it can provide useful tips for a deeper understanding of hydrogen–NG blend combustion characteristics with reduced costs as compared to experiments. Zero or monodimensional (0–1D) models are typically employed to conduct fast parametric analyses to investigate the optimal tradeoff between power output, fuel consumption, and emissions (Yan et al., 2018). A model of this kind is developed here within the GT-Power environment, with reference to a real cogenerative engine designed to operate under NG fueling, in order to virtually characterize this retrofitting option for already installed systems.
A more comprehensive summary of the main experimental and numerical studies conducted for hydrogen–natural gas blend fueling of ICEs is first introduced in the subsequent section, with emphasis on SI reciprocating engine applications. This is then followed by a description of the numerical model proposed here, as validated on available technical data. The main novelty of the present study relies on the characterization of the engine performances when fueled with different hydrogen–NG blends by virtue of an original predictive approach able to correctly reproduce the blend combustion speed within the engine combustion chamber, according to the actual volumetric fractions of the components of the mixture. Engine performances are analyzed with the aim of assessing the suitability of several hydrogen–NG blends by varying the spark advance, the air-to-fuel ratio, and the hydrogen fraction. Lastly, an optimization study is conducted in order to identify the optimal condition in which the engine is characterized by the highest power production with the minimum fuel consumption and related environmental impact.
The achieved results provide guidelines for optimization according to the user’s energetic demand, giving particular attention to the environmental impact of the engine in terms of noxious emissions and to the structural limits of the system, these lasts identified by keeping the derivative of pressure within coherent limits with those assumed by the original manufacturer.
State of the Art of Hydrogen–NG-Fueled SI Engines
This section gives a look over the main experimental and numerical studies focused on the analysis of the performances of hydrogen–NG-fueled SI engines.
Several already existing studies in the literature give comprehensive reviews dealing with hydrogen–NG blends in SI engines. The first efforts are attributed to Nagalingam et al. (1983), where experiments on the performance and emission characteristics of a research engine fueled by various blends with hydrogen content were conducted. Later, Swain et al. (1993) tested a 20% H2–80% NG mixture over several SI research engines operating at different engine speeds and loads, registering an increase in the NOx and a reduction in the CO and UHC emissions, with a general increase in the flammability limits.
Higher percentages of hydrogen volume fraction were also tested by Sierens and Rosseel (1999), suggesting the need to operate with an upper limit of the 20% fraction of hydrogen to guarantee a moderate increase in the NOx emissions below the imposed limits, while Bauer and Forest (2001) provided an optimum operative condition for a fuel mixture with 60% of hydrogen in volume.
It is also worth mentioning the work conducted by Mehra et al. (2017), where an overview over the technical approaches followed for hydrogen–NG combustion optimization (such as lean-burn combustion, exhaust gas recirculation (EGR), and direct injection (DI) systems) is presented, together with numerical procedures as the quasidimensional models.
The several processes that can lead to NG and hydrogen production are summarized from both a technical and economical point of view in the review study of Alrazen and Ahmad (2018), where the effects of hydrogen–NG blends in SI engines are described with a closer look to the noxious emissions. The environmental impact of hydrogen–NG-fueled engines is also largely discussed by Yan et al. (2018), together with a wide description of the influence of the hydrogen fraction over the individual thermochemical properties (LHV, autoignition temperature, flammability limits, and ignition delay) of the resulting blends.
As an overall guide to balance emissions and performances at different operative conditions, Ma et al. (2010) recommended a mixture with 20% in volume of hydrogen while Moreno et al. (2012) suggested using a 30% blend. These percentages are also advised by Flekiewicz et al. (2012) to avoid abnormal phenomena as knocking in SI engines. Several authors (Ma et al., 2010; Hoekstra, Collier et al., 1995; Huang, Wang et al., 2007) investigated on hydrogen–NG fueled engines operating with lean mixtures, achieving a significant extension of flammability limits and lower NOx emissions (40–50%) with respect to natural gas.
As already said, among the numerical simulations performed in this field, quasidimensional models are the most adopted ones due to their intrinsic flexibility and simplicity to predict the overall engine combustion and emission performances, despite the fact that no information can be achieved regarding the in-cylinder flow-field and thermochemical property evolution (Ma et al., 2008; Verhelst and Sheppard, 2009; Djouadi and Bentahar, 2016). On the other hand, a high detailed characterization of the internal flow-field may derive from high-computational approaches such as computational fluid dynamics (CFD) models, although heavy burdening of the computational time is required (Zaker et al., 2015; Costa and Piazzullo, 2018).
A good compromise solution between these two approaches is represented by monodimensional (1D) models, where the Navier–Stokes equations are solved in a monodimensional discretization and the combustion and pollutant emission formation is predicted through suitable and validated submodels based on empirical correlations. Among these approaches, it is worth mentioning the work of Mariani et al. (2012) that studied the performances and emissions of a SI ICE fueled by NG–hydrogen blends under a stoichiometric condition in order to assure an efficient exhaust after treatment adopting a three-way catalyst, while Kamil and Rahman (2015) studied the effects of hydrogen–NG blends on a single-cylinder port injection engine.
In general, the exploitation of hydrogen–NG blends in ICEs has proven valuable to improve thermal efficiency and to produce less noxious emissions. The challenge of parameter optimization still needs to be faced, especially for ultralean mixture conditions. The developed formulation based on a 0–1D approach is here proposed to find a relationship helping to calibrate the engine as based on the hydrogen fraction in the blend, this last being a mandatory aspect poorly discussed in the literature if cogenerative applications have to be considered (Alrazen and Ahman, 2018).
Engine Model Development and Validation Under NG Fueling
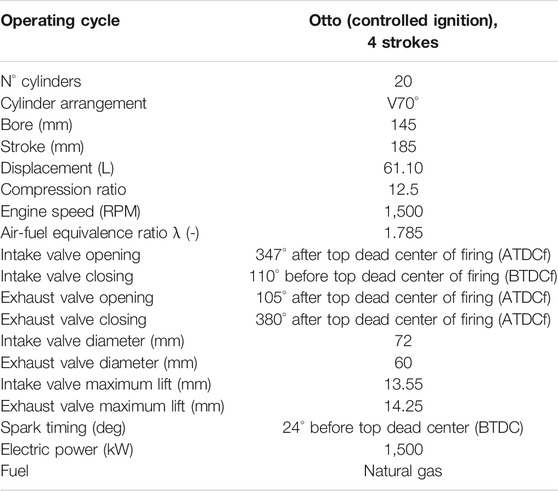
The proposed numerical model is developed with reference to the Jenbacher JMS 420 engine, of the type-4 class, employed for lean-burn cogenerative purposes under NG fueling and characterized by a high power density and outstanding efficiency. The engine is equipped with an ABB TPS 52-F32 turbocharger, while a bypass circuit serves, downstream of the compressor, to the regulation of the output power and as a protection device (Chvatal et al., 1997). The main geometrical characteristics and operative conditions are reported in Table 2.
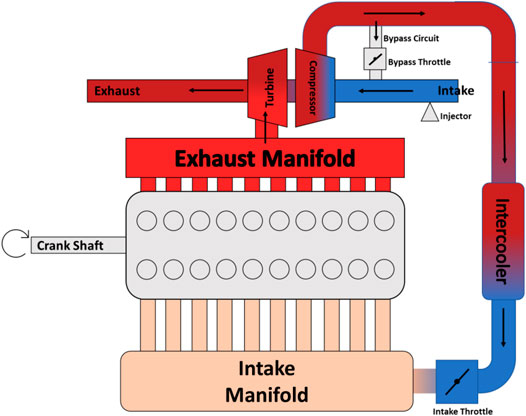
The engine performances under NG and hydrogen–NG fueling are evaluated through a 0–1D numerical model developed within the GT-Power™ (Gtisoft Website, 2021) environment. The model solves the Navier–Stokes equations in a one-dimensional framework; thus, all quantities are averaged on pipe sections and are assumed as changing only along the flow. Pipes and flow splits are discretized into subvolumes, to better approximate every bend or restriction. In each volume, scalar variables as pressure and temperature are assumed to be uniform, while vector variables are calculated at each boundary. All the engine components are modeled, from the intake to the exhaust ducts, the throttle, the valves, and the cylinders, whose geometrical properties are attained from an available CAD model of the engine. The engine model representation is shown in Figure 1, where the presence of a wastegate valve is also clearly visible. This makes for a correct turbomatching between the compressor and the turbine and serves to regulate the maximum attainable boost pressure under each operative condition.
The air compressor is modeled by relying on the similar ABB TPS 57-D compressor whose map is available in the literature (ABB Website, 2021), while the turbine performances are simulated by relying on the operative map available in the software after a proper tuning of the relevant mass flow rates.
The combustion phase is modeled through the predictive model named “EngCylCombSITurb” (Hernandez et al., 2005). This approach is preferred to the classical Wiebe function (Heywood, 1988), where the fuel burned mass fraction is defined through a sigmoid-like function, as this last is validated for traditional fuels but it fails for nontraditional ones as for hydrogen–NG blends, whose chemical characteristics and combustion behavior depend upon the volumetric fractions of the components (Caputo et al., 2018; Caputo et al., 2019).
The adopted model calculates the laminar speed through the following expression:
where
•
•
•
•
•
• α is a parameter expressing the dependency of the laminar speed with the temperature compared to the reference conditions
• β depends upon the equivalence ratio and is an indicator of the decrease in speed with pressure
These parameters are already tuned and listed for different traditional fuels as methane in the GT-Power™ library, but not for hydrogen–methane mixtures. Therefore, these parameters are here calculated for each mixture within the Chemkin™ environment by relying on the detailed kinetic mechanism Gri-Mech 3.0 (Smith et al., 1999), so as to build a more customized combustion model as the hydrogen fraction varies in the fuel mixture. The validation of this approach was previously performed by Caputo et al., 2019, with reference to a ternary mixture of H2–CH4–CO with respect to experimental measurements under reference conditions. Figure 2 reports the calculated laminar flame speed as a function of the equivalence ratio for NG, hydrogen, and three blends of hydrogen–NG (hydrogen volume fraction at 10, 20, and 30%) at standard pressure and temperature and by varying the fuel–air equivalence ratio. Increasing the hydrogen percentage in the fuel blend obviously leads to higher laminar flame speeds and moves the maximum value of the bell-shaped curve toward fuel-richer mixtures. Lastly, in the engine model, the wall heat transfer phenomenon is described through the work of Woschni (1967), while Zel’dovich’s chemical mechanism Zeldovich et al. (1947) is adopted for the prediction of the NOx emissions.
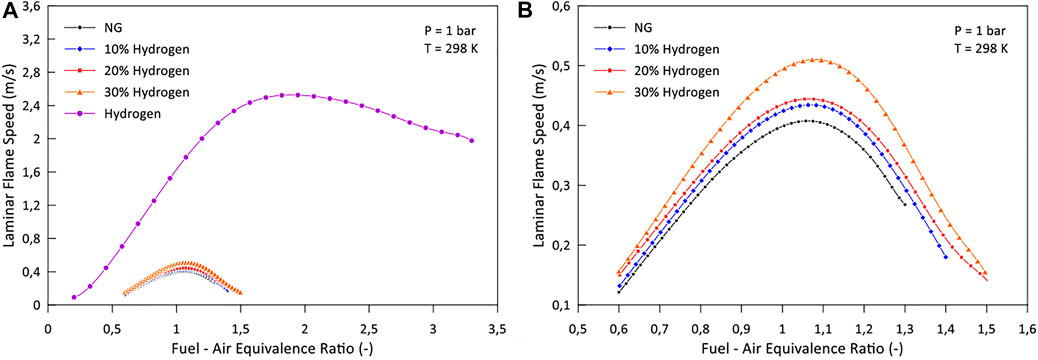
FIGURE 2. (A) Calculated laminar speeds of NG, hydrogen, and hydrogen–NG blends as a function of the equivalence ratio at standard conditions; (B) detail for NG and hydrogen–NG blends.
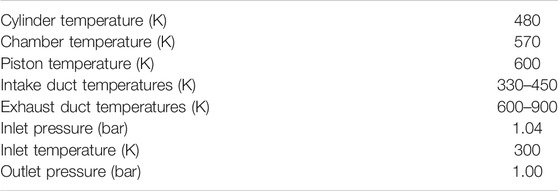
Model validation is performed under NG fueling at the steady-state condition under full and 75% load by comparing the datasheet brake power, brake efficiency, fuel and the mixture mass flow rate, brake specific fuel consumption (BSFC), and brake mean effective pressure (BMEP) of the real engine under study with the results achieved by the model. The simulations under both loads are conducted after a proper regulation of the throttle valve angle aimed at achieving the desired power. The imposed initial and boundary conditions are shown in Table 3.
The comparison between the datasheet and calculated results under both loads is reported in Table 4. The brake efficiency is evaluated as the ratio of the brake power and the primary power, this last obtained by multiplying the fuel mass flow rate by the lower heating value of NG. The results can be said to have good agreement, as a maximum absolute error slightly below the 2% can be noticed for the brake efficiency at the 75% load case, as derived from a numerical overprediction of the total mixture mass flow rate.

TABLE 4. Comparison between the datasheet and calculated values of the main operative parameters (SOS = 24° BTDC and λ = 1.785).
The brake efficiency of the considered engine is very high due to the lean operation and supercharging as for the new-generation cogenerative engines by the main current original equipment manufacturers (OEMs).
Numerical Simulations of the Engine Under Hydrogen–NG Blend Fueling
The feasibility of using hydrogen–NG blends is evaluated by replacing NG with increasing percentages of hydrogen, in a range between 10 and 30% by volume. Properties of each blend are shown in Table 5 in terms of density, stoichiometric air-to-fuel, and LHV. A parametric analysis is performed for each blend by varying the spark timing and air-to-fuel ratio in order to study the influence of these parameters over the engine efficiency, the combustion characteristics, and the formation of noxious emissions.

TABLE 5. Main physicochemical properties of blends obtained by increasing the volumetric percentage of hydrogen.
Parametric Analysis As a Function of the Air-to-Fuel Ratio
The air-to-fuel ratio is varied between 1.75, 1.785, and 1.82 at a fixed spark timing equal to 24° BTDC under full-load operation. As shown in Figure 3A, an increase of the fuel primary power with increasing percentages of hydrogen can be noticed up to a 20% volumetric percentage, as mainly related to the increase in the LHV of the mixture (Table 5). For greater hydrogen amounts, the reduction of the blend density (Table 5) and the fuel mass flow rate, this last shown in Figure 3B, becomes dominant, with a general decrease of the primary power related to the mixture trapped within the combustion chamber. The related engine volumetric efficiency shown in Figure 3C is a result of the engine response to blends characterized by increased hydrogen fractions and as resulting from the specific turbine–compressor matching for each case. The primary power obviously also increases with lower values of the air-to-fuel ratio regardless of the considered hydrogen fraction.
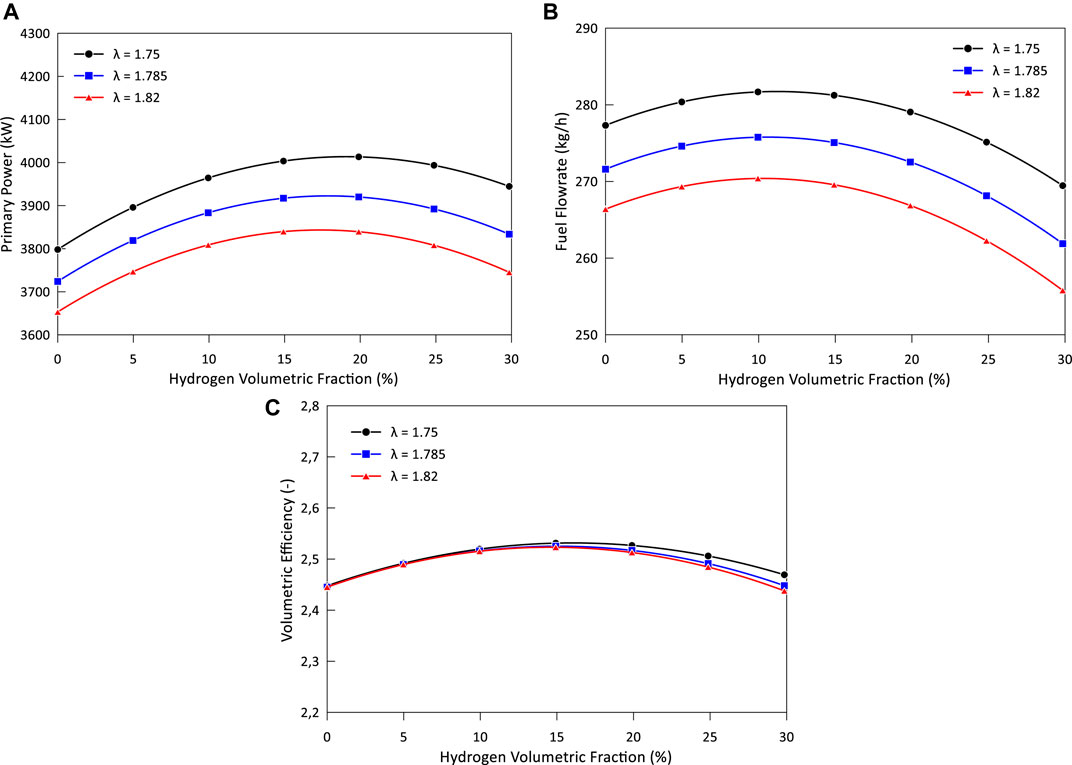
FIGURE 3. (A) Fuel primary power, (B) fuel mass flow rate, and (C) volumetric efficiency at different hydrogen volumetric percentages and air-to-fuel ratios and spark timing equal to 24° BTDC.
The trend of the produced brake power shown in Figure 4A, therefore, is to be intended a consequence of the combined effects related to the evolution of the volumetric efficiency and the fuel mass flow rate. A maximum power gain equal to the 13% with respect to the baseline NG operative condition is achieved at the highest air-to-fuel ratio being considered (λ = 1.75) and for a hydrogen fraction equal to the 20%. Increasing percentages of hydrogen up to the 20% results in enhanced brake powers due to faster combustion and, thus, higher peaks of pressure. This circumstance, indeed, can be appreciated by looking at Figures 4B,C, where the combustion duration and the pressure peaks are reported. The combustion duration is intended as the crank angle difference between the angle where the 90% of the mixture is burned and that corresponding to a 10% burned fraction. The pressure peaks also shift towards the TDC, as shown by the peak angle θpeak in Figure 4D; thus, for hydrogen fractions higher than 20%, both the primary energy exploited during the expansion phase and the resulting brake power reduce.
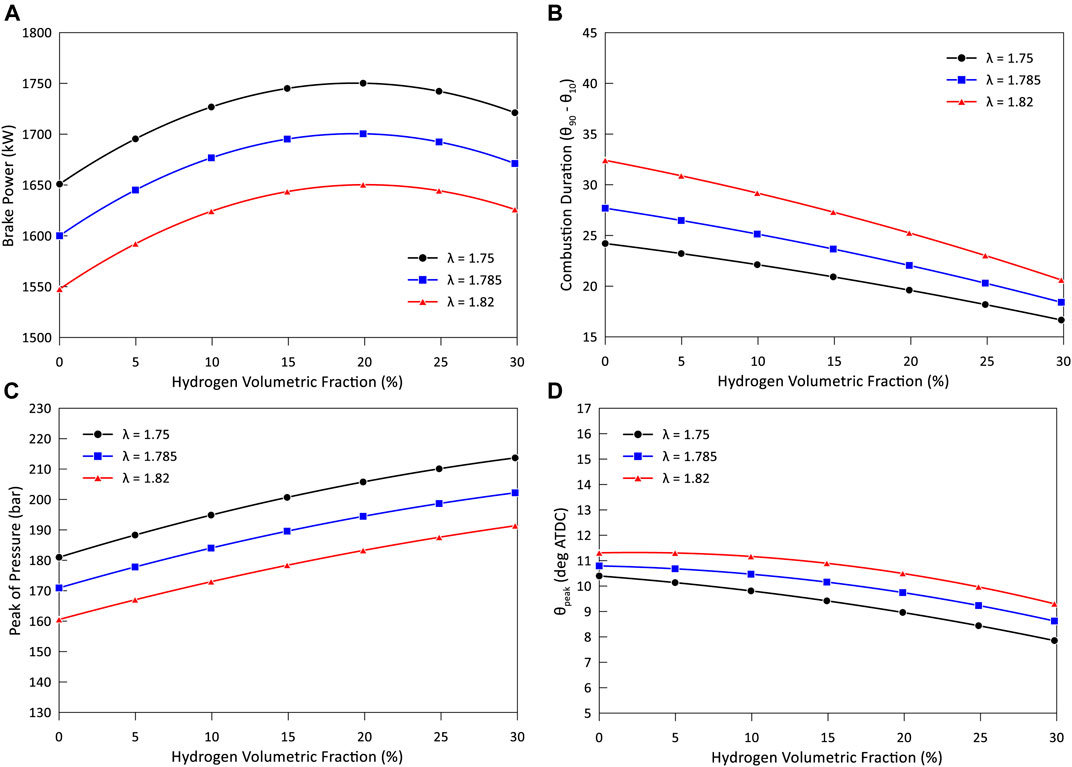
FIGURE 4. (A) Engine power produced, (B) combustion duration, (C) pressure peaks, and (D) peak of pressure angles at different hydrogen volumetric percentages in the blend and air-to-fuel ratios and spark timing equal to 24° BTDC.
Despite the combined effects of less-exploitable primary fuel power and reduced net power delivered to the piston during the expansion phase for mixtures with more than the 20% volume fraction of hydrogen, an overall boost of the engine brake efficiency and a decrease of the BSFC can be noticed as the hydrogen percentage increases. The trend of these variables is shown in Figures 5A,B.
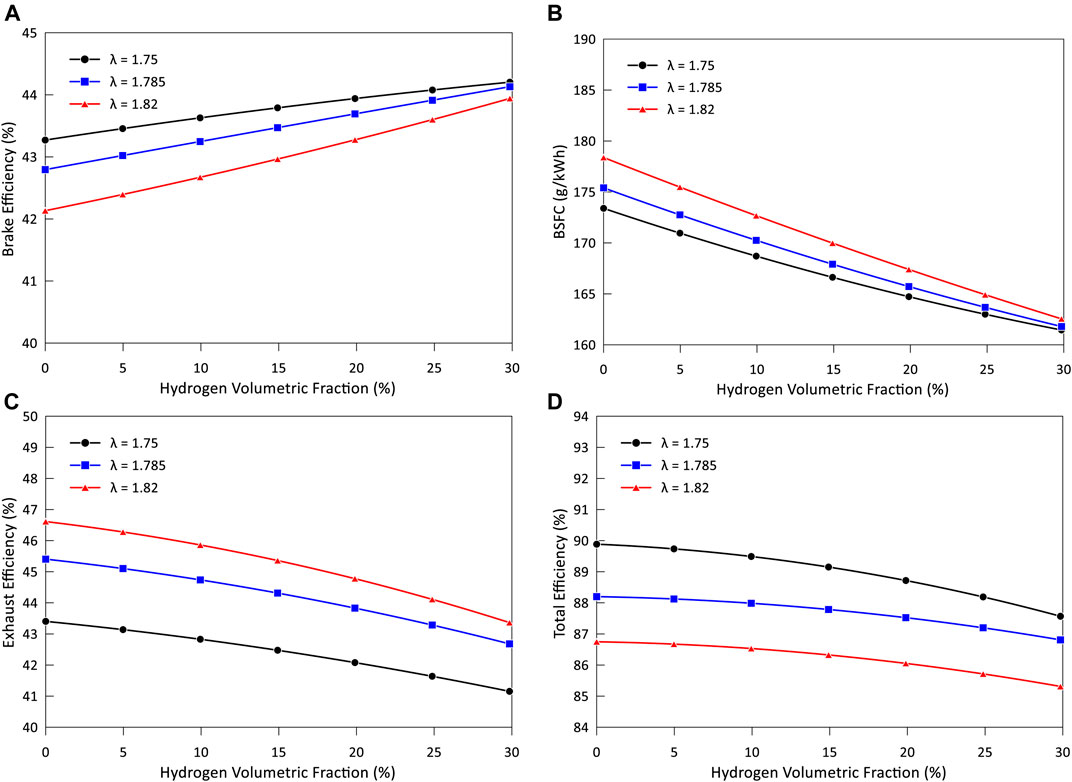
FIGURE 5. (A) Engine brake efficiency, (B) BSFC, (C) engine exhaust efficiency, and (D) engine total efficiency at different hydrogen volumetric percentages and air-to-fuel ratios and spark timing equal to 24° BTDC.
On the other hand, the efficiency related to the exploitation of the enthalpy of the exhaust gases decreases as the hydrogen fraction increases. Indeed, as shown in Figures 4C,D, higher peaks of pressure and shorter combustion durations lead to lower temperatures at the exhaust, with an overall reduction in the related efficiency (Figure 5C). It is worth noticing the tradeoff occurring for a λ equal to 1.75, as the highest brake efficiency and the lowest exhaust efficiency are, respectively, achieved. Lastly, the descending trend of the total efficiency, here considered as the sum of the brake and exhaust efficiencies, with the hydrogen fraction is shown in Figure 5D.
The enhancement of the brake efficiency with the hydrogen fraction also influences the pollutant emitted. Indeed, despite the lower power produced at the highest hydrogen fraction in the blend (30%), higher flame speed and faster combustion phases have a direct influence over the reduction of the UHC emitted at the exhaust. These are shown in Figure 6A. However, the higher pressures, and, thus, higher temperatures, achieved also influence the formation of the NOx, in accordance with the Zeldovich mechanism adopted, as can be seen in Figure 6B.
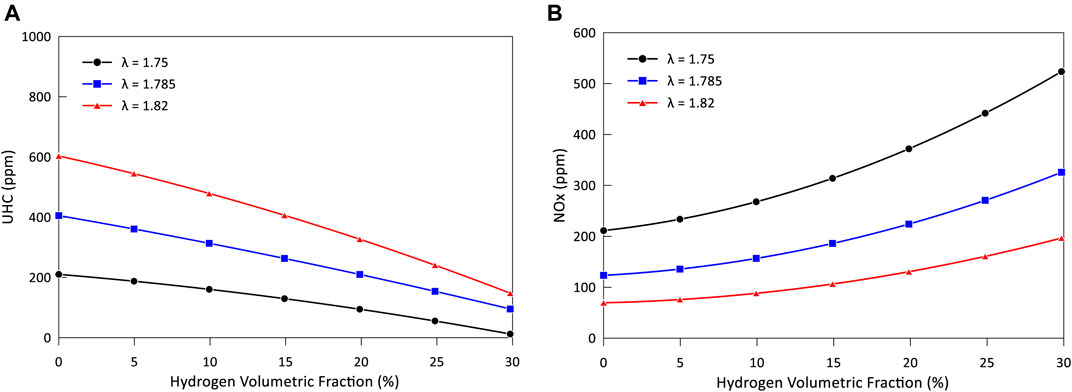
FIGURE 6. (A) UHC and (B) NOx emitted at the engine exhaust at different hydrogen volumetric percentages and air-to-fuel ratios and spark timing equal to 24° BTDC.
Lastly, when the engine operates at leaner air-to-fuel ratios, the in-cylinder flame propagation speed decreases and, consequently, the combustion duration increases, leading to retarded and lower peaks of pressure and deteriorated conversion efficiencies. Therefore, the amount of UHC produced increases, while the overall NOx formation falls. However, it must be noticed from Figure 5A that the influence of the increase in the hydrogen fraction over the engine performances at leaner mixtures is generally more effective, as the brake efficiency at λ = 1.82 increases of the 4.5% with respect to the 2.1% when λ = 1.75.
Parametric Analysis As a Function of the Spark Timing
The analysis of the engine performances is here performed by varying the spark timing between 18°, 21°, 24°, and 27° BTDC at an air-to-fuel ratio equal to 1.785.
The effects on the evolution of the fuel primary power and of the fuel mass flow rate as the spark timing varies are shown, respectively, in Figures 7A,B. As the start of spark (SOS) changes, the combustion phase, the exhaust gas enthalpy, and the subsequent operative conditions at which the turbocharger operates also vary. Indeed, as the spark timing is anticipated, lower pressure and temperature values are achieved upstream of the turbine and, thus, less power is requested for the expansion phase. The boost power resulting from the matching compressor also reduces, with a net side effect on the mixture mass flow rate undergoing the engine operative cycle and, thus, of the volumetric efficiency (Figure 7C).
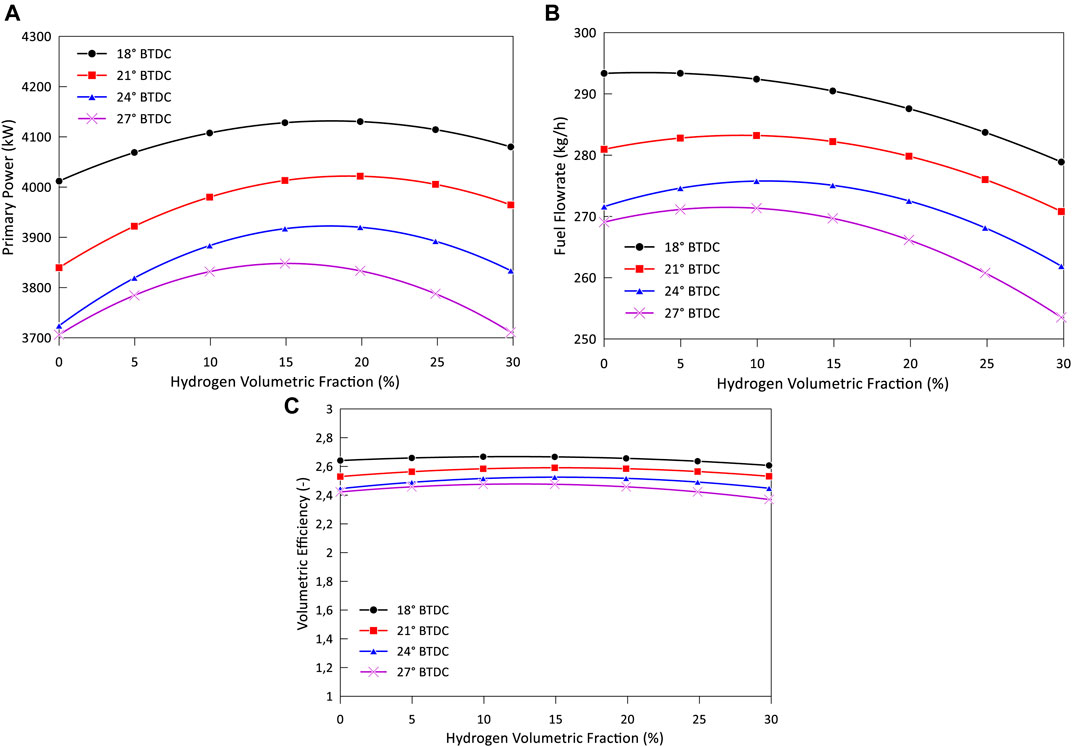
FIGURE 7. (A) Fuel primary power, (B) fuel mass flow rate, and (C) volumetric efficiency at different hydrogen volumetric percentages and spark timings and lambda equal to 24° BTDC.
The parabolic evolution of the fuel mass flow rate and primary energy with the increase in the hydrogen fraction was already discussed in the previous section. The brake power produced is shown in Figure 8A. It also reduces by anticipating the spark timing. However, for hydrogen fractions between 10 and 20%, a maximum relative at an SOS of 21° BTDC is achieved.
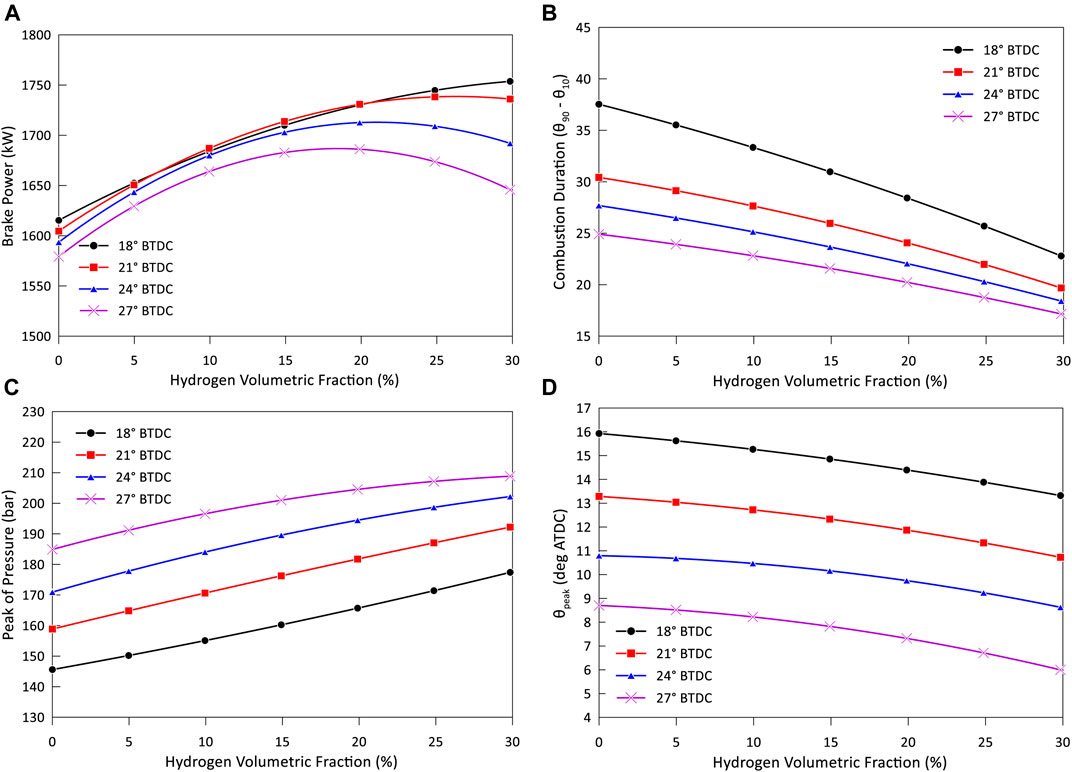
FIGURE 8. (A) Engine power produced, (B) combustion duration, (C) pressure peaks, and (D) peak of pressure angles at different hydrogen volumetric percentages and spark timings and lambda equal to 24° BTDC.
As the spark timing shifts towards the TDC, longer combustion phases are determined as shown in Figure 8B, while Figures 8C,D show how the pressure cycles are characterized by lower and delayed peak values.
Despite the lower brake power produced by the engine as the SOS anticipates, an enhancement of the brake efficiency reported in Figure 9A and a reduction of the BSFC in Figure 9B can be noticed. The explanation again lies in the shorter duration of the combustion process, which results in a faster and more complete oxidation of the trapped fuel. However, the lower temperature achieved at the exhaust when anticipating the SOS again results in a reduction of the related exhaust efficiency, as shown in Figure 9C. The minimum of the engine total efficiency shown in Figure 9D is indeed achieved for an SOS of 27° BTDC.
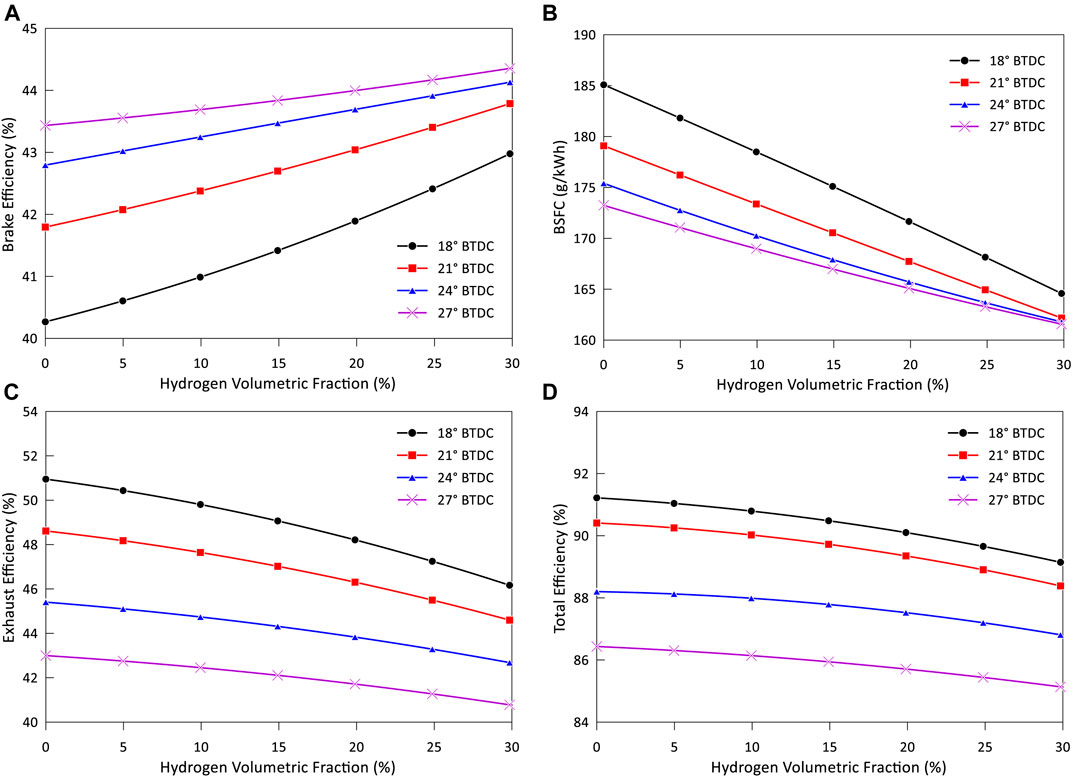
FIGURE 9. (A) Engine brake efficiency, (B) BSFC, (C) engine exhaust efficiency, and (D) engine total efficiency at different hydrogen volumetric percentages and spark timings and lambda equal to 24° BTDC.
Lastly, a direct reduction of the UHC emitted at the exhaust is again achieved as shown in Figure 10A, but the higher heat release and pressure during the combustion phase also determine an enhanced formation of NOx, as can be appreciated by looking at Figure 10B.
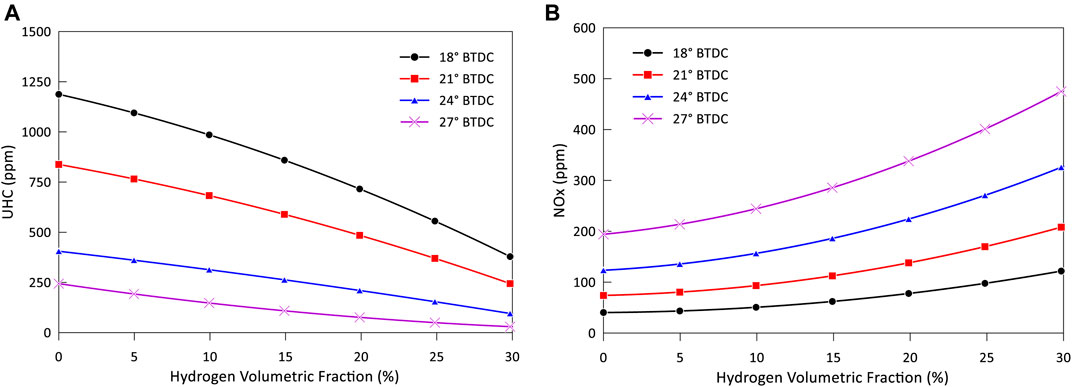
FIGURE 10. (A) UHC and (B) NOx emitted at the engine exhaust at different hydrogen volumetric percentages and spark timings and lambda equal to 24° BTDC.
Engine Performance Optimization
The parametric analysis conducted in the previous sections helped highlighting the quantitative influence of the spark timing, the air-to-fuel ratio, and the hydrogen fraction over the performances and environmental impact of the considered cogenerative engine under hydrogen–NG blend fueling.
The present section is dedicated to the solution of an optimization problem aimed at finding the condition of engine operation resulting the best in terms of power production with the minimum fuel consumption and related environmental impact.
The problem being considered, into more detail, is the optimization of the engine power output and the minimization of the BSFC, NOx, and UHC emissions. The genetic algorithm NSGA-II (nondominated sorting genetic algorithm–II) is here chosen as suitable to deal with multiobjective optimization problems (Costa et al., 2019). The initial design of experiments (DOE) is composed of 40 operative conditions, generated through a quasirandom uniform Sobol sequence in a range of variation of λ being between 1.75 and 1.82, a spark timing comprised between 18° BTDC and 27° BTDC, and a hydrogen volumetric fraction in the blend being between 0 and 30%. The total number of evaluated designs is 200 over a period of time of 36 h parallelized over 4 CPUs @3.30 GHz.
Between the operative conditions analyzed by the optimization procedure, those corresponding to pressure cycles that are prohibitive for the structural limits of the system must be discarded. Indeed, the excessive pressure rise and the risk of an incipient knocking regime for high-load operation must be considered, which increases as the hydrogen fraction increases, due to the influence of this species on the combustion speed (Figure 2) which results in a faster rate of heat release by the mixture trapped within the combustion chamber. The maximum derivative of pressure (MDP), equal to the maximum value of the derivative of the pressure cycle over the crank angle, is here considered as it correlates very well with the well-known maximum amplitude of pressure oscillation (MAPO) indicator (Lounici et al., 2017). In the literature, authors generally refer to an MDP value between 3 and 3.5 bar/deg as the knocking limit (Boccardi et al., 2016) for light-duty spark ignition engines. However, with reference to the baseline operative case assumed here (SOS of 24° BTDC and a λ of 1.785) in which the real engine runs under NG fueling, the MDP results equal to 5.7 bar/deg that can indeed be considered an admissible limit in the case of steady cogenerative engines. This value is here considered as the higher limit, as referring to a condition in which a real commercially available engine operates without problems of excessive solicitations related to abnormal combustion processes.
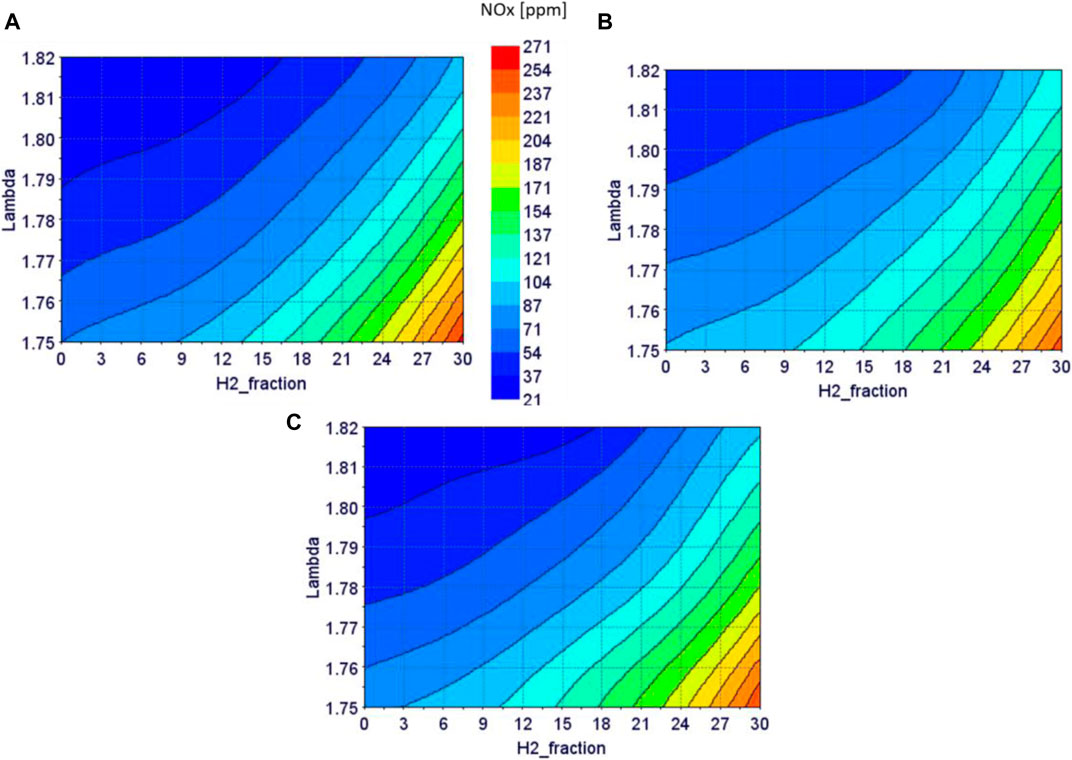
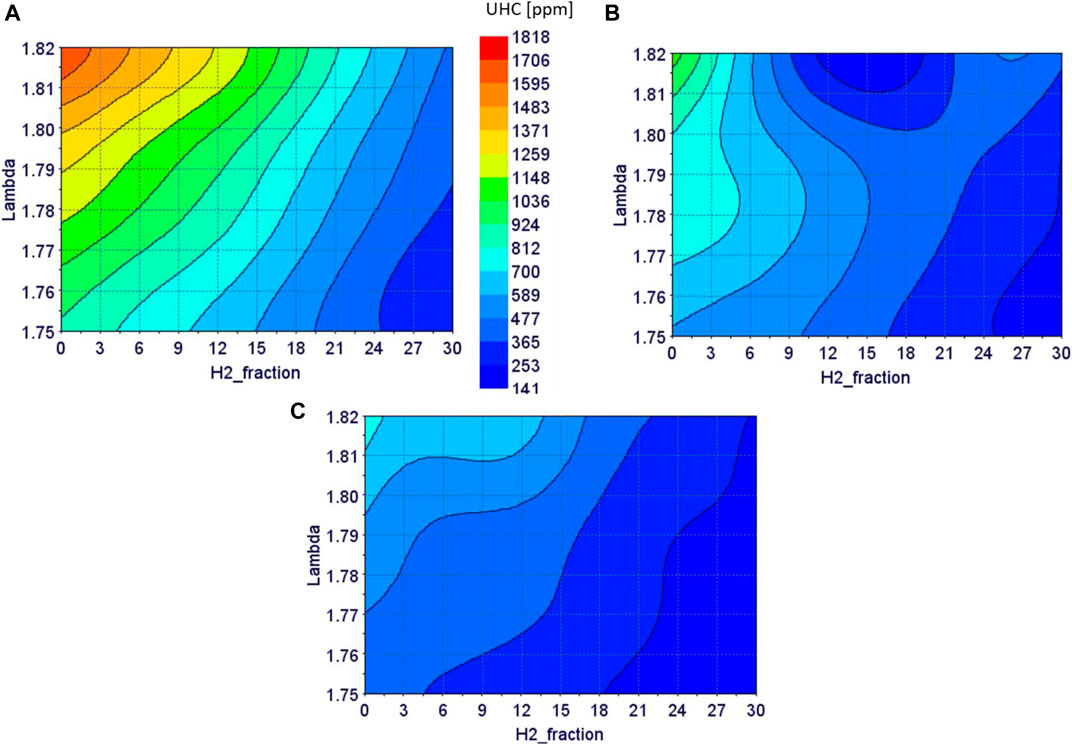
As a matter of fact, with respect to the reference case where the engine is fueled by only NG at an SOS of 24° BTDC and a λ of 1.785, the solutions individuated by the parametric analysis performed in the previous sections and characterized by more anticipated SOS or richer air-to-fuel ratios must surely be discarded, as the related MDP overwhelms the imposed limit due to the faster rate of pressure rise, despite the hydrogen fraction considered. An analogous reasoning can be made for the operative cases under H2–NG fueling characterized by an SOS of 24°, as the hydrogen addiction enhances the combustion speed. As concerns the remaining cases studied within the parametric analysis, Table 6 reports the percent variations of the BSFC, NOx, and UHC emitted and of the brake power produced by the engine with respect to the baseline condition under NG fueling. Each cell in the table is colored in shades of green and red according to the relevant variation.

TABLE 6. Percent variation of the BSFC, NOx, and UHC emitted and brake power produced by the engine in different configurations with respect to the baseline case under NG fueling.
An increase in the produced brake power is always achieved for the engine operative cases at an air-to-fuel ratio of 1.785 and different SOS. However, these conditions are always counterbalanced by an increase in the pollutant emissions produced or by an increase in the BSFC. On the other hand, if a shift towards leaner air-to-fuel ratios, as 1.82, is considered, along with a proper tuning of the SOS with the H2 fraction in the blend, the best performances with respect to the baseline condition can be guaranteed in each aspect. Therefore, it is expected that the optimal condition evaluated by the optimization procedure should point towards leaner engine operations.
The results of the optimization procedure are shown in Figure 11 in a parallel chart. Among the optimal cases individuated by the algorithm, the ones which, at the same time, guarantee higher brake power produced and lower BSFC and emitted NOx and UHC, without burdening the structural limits of the system, are cases 27 and 196, whose characteristics are also summarized in Table 7. As expected, both conditions refer to operative conditions shifted towards leaner air-to-fuel ratios. A maximum of 24% of volume hydrogen fraction in the blend can be reached if the SOS is slightly retarded up to 20.5° BTDC. However, the NOx amount produced in this case is equal to the one characterizing the reference case under only NG fueling; thus, further increases in the hydrogen fraction are not allowed.
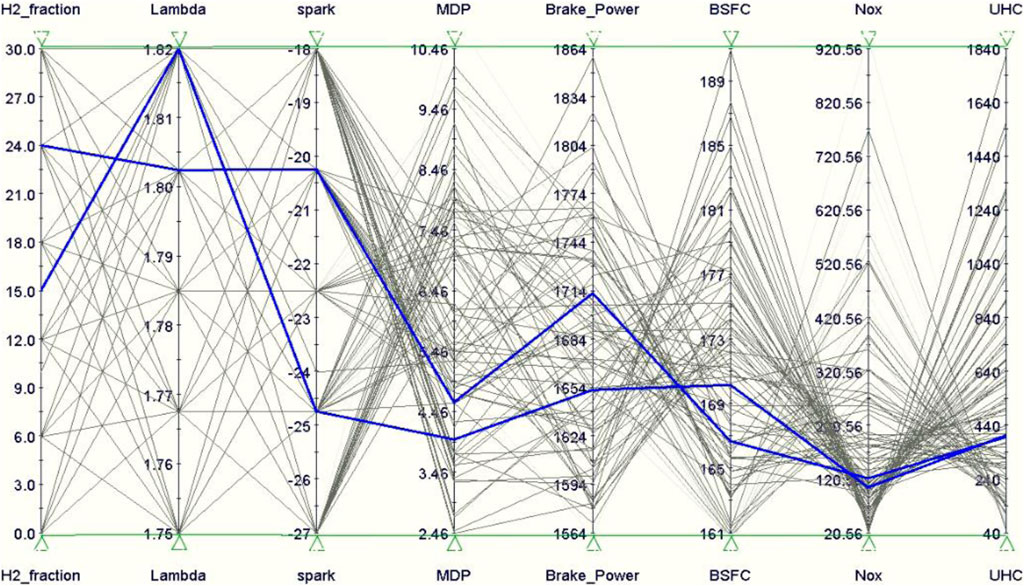
FIGURE 11. Parallel chart of the 200 operative cases analyzed by the optimization algorithm. The optimal conditions are enlightened in bold blue.

TABLE 7. Comparison between the performances of the studied engine under the reference case (only NG fueling) with the cases evaluated by the optimization procedure.
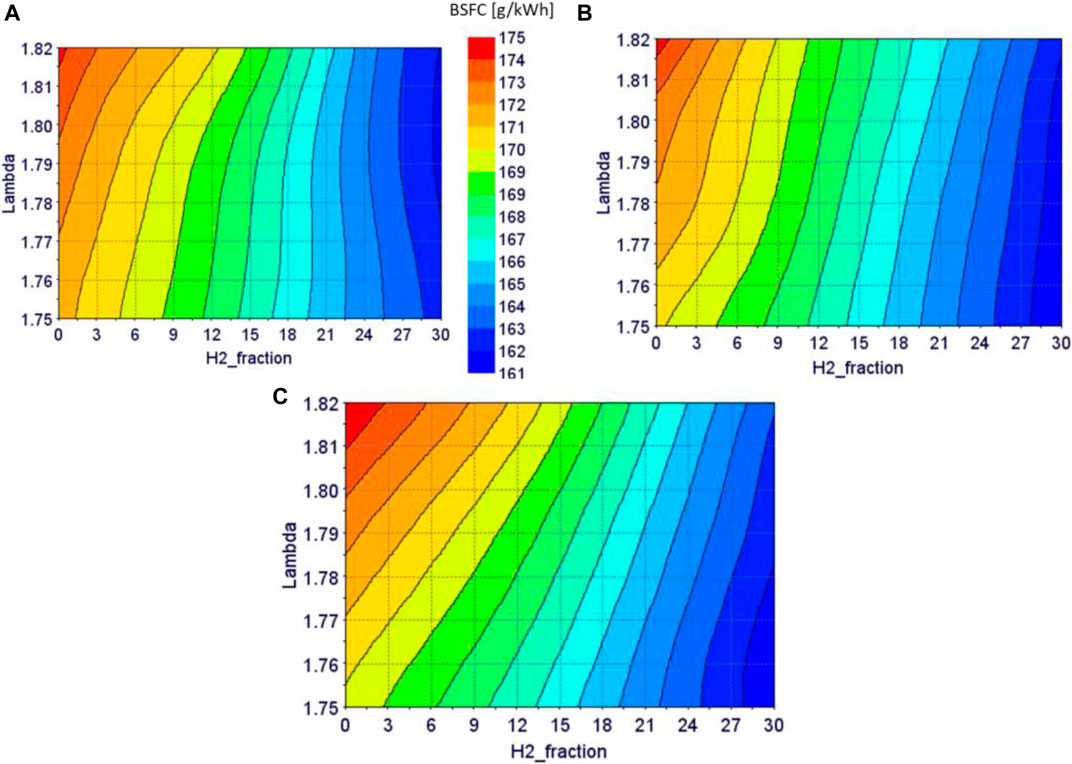
Lastly, the 200 operative cases analyzed by the optimization algorithm are also interpolated by employing the regression Kriging algorithm by using a Gaussian variogram, as it provides good linear assumptions of the analyzed values (Velásquez et al., 2017). Figures 12–15 better highlight the effects of each controlling variable on the engine performances, displaying the response surfaces, respectively, for the brake power, the BSFC, and the NOx and UHC emitted as a function of the hydrogen fraction and the air-to-fuel ratio at different spark timings. The results are consistent with the evolution trends depicted from the previously conducted parametric analysis.
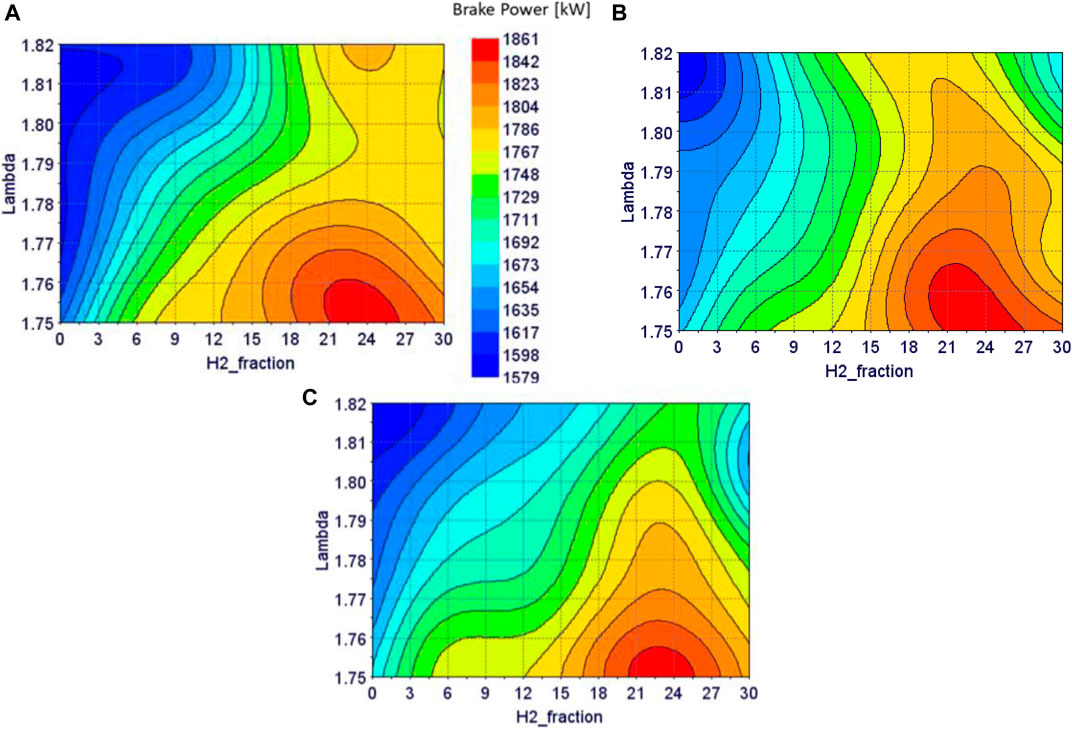
FIGURE 12. Produced brake power at various spark timings: (A) 18° BTDC, (B) 22° BTDC, and (C) 27° BTDC.
Conclusion
A numerical model of a real turbocharged SI engine for cogenerative applications, developed in GT-Power environment, is presented here. The engine model is first validated under NG fueling, and then, its performances are numerically evaluated by substituting a certain percentage of natural gas with hydrogen. A parametric analysis highlights the quantitative influence of the spark timing and the air-to-fuel ratio over the engine performances and noxious emission formation as the hydrogen fraction is varied.
The main results show that
• higher amounts of hydrogen fractions in the hydrogen–NG blend speed up the combustion propagation, determining higher and more anticipated pressure peaks. The combustion efficiencies and fuel consumptions enhance, but the formation of the NOx pollutants grows exponentially with the hydrogen fraction. A 20% of hydrogen fraction in the blend guarantees the highest brake power regardless of the air-to-fuel ratios and spark timing, as a further increase in the hydrogen fraction leads to reduced volumetric efficiencies.
• on the other hand, the efficiency related to the exploitation of the enthalpy of the exhaust gases decreases as the hydrogen fraction increases, as higher peaks of pressure and shorter combustion durations lead to lower temperatures at the exhaust.
• at leaner air-to-fuel ratios, the in-cylinder flame propagation speed decreases because of the lower amount of fuel trapped in the mixture, leading to retarded and lower peaks of pressure, reduced conversion efficiencies, and a lower NOx production. The influence of the hydrogen fraction over the engine performances at leaner mixtures is generally more effective.
• the brake power reduces with anticipated spark timing, but a maximum is reached at an SOS of 21° BTDC for hydrogen fractions between 10 and 20%. Despite this trend, an enhancement of the brake efficiency and a reduction of the BSFC are registered at anticipated SOS, but the higher heat release and pressure cycles during the combustion phase also determine an enhanced formation of NOx.
• the lower temperature achieved at the exhaust when anticipating the SOS results in a reduction of the related exhaust efficiency, with a minimum of the engine total efficiency for an SOS of 27° BTDC.
Lastly, an optimization procedure is carried out, aimed at individuating the best condition in which the engine operates with the maximum power output and the minimum BSFC, NOx, and UHC emissions without burdening the system with excessive solicitations. In summary, shifting to leaner air-to-fuel ratios is generally preferred to avoid rapid pressure rises, especially if the blend is characterized by a hydrogen fraction higher than 15%.
Data Availability Statement
The raw data supporting the conclusions of this article will be made available by the authors, without undue reservation.
Author Contributions
MC: data curation, supervision, and writing—review and editing. DP: conceptualization and writing—original draft. AD: writing and editing.
Conflict of Interest
Author AD was employed by the company Grastim J.V. S.r.l.
The remaining authors declare that the research was conducted in the absence of any commercial or financial relationships that could be construed as a potential conflict of interest.
Publisher’s Note
All claims expressed in this article are solely those of the authors and do not necessarily represent those of their affiliated organizations, or those of the publisher, the editors and the reviewers. Any product that may be evaluated in this article, or claim that may be made by its manufacturer, is not guaranteed or endorsed by the publisher.
Abbreviations
0D, zero dimensional; 1D, monodimensional; 3D, three dimensional; ATDC, after top dead center (deg); BMEP, brake mean effective pressure (bar); BSFC, brake specific fuel consumption (g/kWh); BTDC, before top dead center (deg); CFD, computational fluid dynamics; CH4, methane; CO, carbon monoxide; CO2, carbon dioxide; DI, direct injection; EGR, exhaust gas recirculation; GHG, green house gases; H2, hydrogen; HCNG, hydrogen-enriched compressed natural gas; ICE, internal combustion engine; LFS, laminar flame speed (m/s); LHV, lower heating value; MAPO, maximum amplitude of pressure oscillations; MBT, maximum break torque (N*m); MDP, maximum derivative of pressure (bar/deg); NG, natural gas; NOx, nitrogen oxides; NTP, normal temperature and pressure; RPM, revolutions per minute; SI, spark ignition; SOS, start of spark (deg); TDC, top dead center (deg); and UHC, unburned hydrocarbons.
References
ABB Website (2021). Available at: https://library.abb.com.[Accessed June 2021]
Alrazen, H. A., and Ahmad, K. A. (2018). HCNG Fueled Spark-Ignition (SI) Engine with its Effects on Performance and Emissions. Renew. Sustain. Energ. Rev. 82, 324–342. doi:10.1016/j.rser.2017.09.035
Bauer, C. G., and Forest, T. W. (2001). Effect of Hydrogen Addition on the Performance of Methane-Fueled Vehicles. Part I: Effect on SI Engine Performance. Int. J. Hydrogen Energ. 26 (1), 55–70. doi:10.1016/S0360-3199(00)00067-7
Boccardi, S., Catapano, F., Costa, M., Sementa, P., Sorge, U., and Vaglieco, B. M. (2016). Optimization of a GDI Engine Operation in the Absence of Knocking through Numerical 1D and 3D Modeling. Adv. Eng. Softw. 95, 38–50. doi:10.1016/j.advengsoft.2016.01.023
Caputo, C., Cirillo, D., Costa, M., Di Blasio, G., Di Palma, M., Piazzullo, D., et al. (2019). Multi-Level Modeling of Real Syngas Combustion in a Spark Ignition Engine and Experimental Validation. SAE Tech. Paper 2019, 24–0012. doi:10.4271/2019-24-0012
Caputo, C., Cirillo, D., Costa, M., La Villetta, M., Tuccillo, R., and Villani, R. (2018). Numerical Analysis of a Combined Heat and Power Generation Technology from Residual Biomasses. J. Energ. Power Eng. 12, 300–321. doi:10.17265/1934-8975/2018.06.003
Çeper, B. A. (2012). Use of Hydrogen-Methane Blends in Internal Combustion Engines. Hydrogen Energy-Challenges Perspect. 180, 175–200. doi:10.5772/50597
Chvatal, D., Fahringer, A., Gruber, F., Lutz, B., and Plohberger, D. (1997). U.S. Patent No. 5. Washington, DC: U.S. Patent and Trademark Office, 694–899.
Costa, M., and Piazzullo, D. (2018). Biofuel Powering of Internal Combustion Engines: Production Routes, Effect on Performance and CFD Modeling of Combustion. Front. Mech. Eng. 4, 9. doi:10.3389/fmech.2018.00009
Costa, M., Rocco, V., Caputo, C., Cirillo, D., Di Blasio, G., La Villetta, M., et al. (2019). Model Based Optimization of the Control Strategy of a Gasifier Coupled with a Spark Ignition Engine in a Biomass Powered Cogeneration System. Appl. Therm. Eng. 160, 114083. doi:10.1016/j.apenergy.2020.115418
Djouadi, A., and Bentahar, F. (2016). Combustion Study of a Spark-Ignition Engine from Pressure Cycles. Energy 101, 211–217. doi:10.1016/j.energy.2016.02.013
Flekiewicz, B., Flekiewicz, M., and Kubica, G. (2012). Identification of Optimal CNG-Hydrogen Enrichment Ratio in the Small SI Engines. SAE Tech. Paper 2012, 32–0015. doi:10.4271/2012-32-0015
Gtisoft Website (2021). Available at: www.gtisoft.com.
Hernandez, J. J., Lapuerta, M., and Serrano, C. (2005). Estimation of the Laminar Flame Speed of Producer Gas from Biomass Gasification. Energy & Fuels 19 (5), 2172–2178. doi:10.1021/ef058002y
Hoekstra, R., Collier, K., Mulligan, N., and Chew, L. (1995). Experimental Study of a Clean Burning Vehicle Fuel. Int. J. Hydrogen Energ. 20, 737–745. doi:10.1016/0360-3199(95)00008-2
Huang, Z., Wang, J., Liu, B., Zeng, K., Yu, K., and Jiang, D. (2007). Combustion Characteristics of a Direct-Injection Engine Fuelled with Natural Gas-Hydrogen Blends under Different Ignition Timings. Fuel 86, 381–387. doi:10.1016/j.fuel.2006.07.007
Kamil, M., and Rahman, M. M. (2015). Performance Prediction of Spark-Ignition Engine Running on Gasoline-Hydrogen and Methane-Hydrogen Blends. Appl. Energ. 158, 556–567. doi:10.1016/j.apenergy.2015.08.041
Kavathekar, K. P., Rairikar, S. D., and Thipse, S. S. (20072007). Development of a CNG Injection Engine Compliant to Euro-IV Norms and Development Strategy for HCNG Operation. SAE Tech. Paper, 26–029. doi:10.4271/2007-26-029
Liu, J., Sun, W., and Harrison, G. P. (2020). The Economic and Environmental Impact of Power to Hydrogen/power to Methane Facilities on Hybrid Power-Natural Gas Energy Systems. Int. J. Hydrogen Energ. 45 (39), 20200–20209. doi:10.1016/j.ijhydene.2019.11.177
Lounici, M. S., Benbellil, M. A., Loubar, K., Niculescu, D. C., and Tazerout, M. (2017). Knock Characterization and Development of a New Knock Indicator for Dual-Fuel Engines. Energy 141, 2351–2361. doi:10.1016/j.energy.2017.11.138
Ma, F., Wang, M., Jiang, L., Deng, J., Chen, R., Naeve, N., et al. (2010). Performance and Emission Characteristics of a Turbocharged Spark-Ignition Hydrogen-Enriched Compressed Natural Gas Engine under Wide Open Throttle Operating Conditions. Int. J. Hydrogen Energ. 35 (22), 12502–12509. doi:10.1016/j.ijhydene.2010.08.053
Ma, F., Wang, Y., Wang, M., Liu, H., Wang, J., and Ding, S. (2008). Development and Validation of a Quasi-Dimensional Combustion Model for SI Engines Fuelled by HCNG with Variable Hydrogen Fractions. Int. J. Hydrogen Energ. 33, 4863–4875. doi:10.1016/j.ijhydene.2008.06.068
Mariani, A., Morrone, B., and Unich, A. (2012). Numerical Evaluation of Internal Combustion Spark Ignition Engines Performance Fuelled with Hydrogen–Natural Gas Blends. Int. J. Hydrogen Energ. 37 (3), 2644–2654. doi:10.1016/j.ijhydene.2011.10.082
Mehra, R. K., Duan, H., Juknelevičius, R., Ma, F., and Li, J. (2017). Progress in Hydrogen Enriched Compressed Natural Gas (HCNG) Internal Combustion Engines - A Comprehensive Review. Renew. Sustain. Energ. Rev. 80, 1458–1498. doi:10.1016/j.rser.2017.05.061
Moreno, F., Muñoz, M., Arroyo, J., Magén, O., Monné, C., and Suelves, I. (2012). Efficiency and Emissions in a Vehicle Spark Ignition Engine Fueled with Hydrogen and Methane Blends. Int. J. Hydrogen Energ. 37, 11495–11503. doi:10.1016/j.ijhydene.2012.04.012
Nagalingam, B., Duebel, F., and Schmillen, K. (1983). Performance Study Using Natural Gas, Hydrogen-Supplemented Natural Gas and Hydrogen in AVL Research Engine. Int. J. Hydrog. Energ. 8, 715–720. doi:10.1016/0360-3199(83)90181-7
Pede, G., Rossi, E., Chiesa, M., and Ortenzi, F. (2007). Test of Blends of Hydrogen and Natural Gas in a Light Duty Vehicle. SAE Tech. Paper 2007, 01–2045. doi:10.4271/2007-01-2045
Sandalci, T., Işın, Ö., Galata, S., Karagöz, Y., and Güler, İ. (2019). Effect of Hythane Enrichment on Performance, Emission and Combustion Characteristics of a CI Engine. Int. J. Hydrogen Energ. 44 (5), 3208–3220. doi:10.1016/j.ijhydene.2018.12.069
Schiebahn, S., Grube, T., Robinius, M., Tietze, V., Kumar, B., and Stolten, D. (2015). Power to Gas: Technological Overview, Systems Analysis and Economic Assessment for a Case Study in Germany. Int. J. Hydrogen Energ. 40 (12), 4285–4294. doi:10.1016/j.ijhydene.2015.01.123
Sierens, R., and Rosseel, E. (1999). Variable Composition Hydrogen/natural Gas Mixtures for Increased Engine Efficiency and Decreased Emissions. J. Eng. Gas Turbines Power 122 (1), 135–140. doi:10.1115/1.483191
Smith, G. P., Golden, D. M., Frenklach, M., and Moriarty, N. W. (1999). GRI-mech 3.0. Berkeley: Berkley University 2017. Available at: http://combustion.berkeley.edu/grimech/version30/text30.html.
Swain, M. R., Yusuf, M. J., and Dulger, Z. (1993). The Effects of Hydrogen Addition on Natural Gas Engine Operation. SAE Tech. Paper, 932775. doi:10.4271/932775
Uchman, W., Skorek-Osikowska, A., Jurczyk, M., and Węcel, D. (2020). The Analysis of Dynamic Operation of Power-To-SNG System with Hydrogen Generator Powered with Renewable Energy, Hydrogen Storage and Methanation Unit. Energy 213, 118802. doi:10.1016/j.energy.2020.118802
Velásquez, E. I. G., Coronado, C. J., Cartagena, J. G. Q., Carvalho, J. A., Mendiburu, A. Z., Andrade, J. C., et al. (2017). Prediction of Flammability Limits for Ethanol-Air Blends by the Kriging Regression Model and Response Surfaces. Fuel 210, 410–424. doi:10.1016/j.fuel.2017.08.089
Verhelst, S., and Sheppard, C. G. W. (2009). Multi-zone Thermodynamic Modelling of Spark Ignition Engine Combustion – an Overview. Energ. Convers. Manage. 50, 1326–1335. doi:10.1016/j.enconman.2009.01.002
Visciglio, P. M. (2019). CFD Analysis of Combustion in CNG/HCNG Engines. Politecnico di Torino: Doctoral dissertation.
Woschni, G. (1967). A Universally Applicable Equation for the Instantaneous Heat Transfer Coefficient in the Internal Combustion Engine. SAE Tech. Paper, 670931. doi:10.4271/670931
Yan, F., Xu, L., and Wang, Y. (2018). Application of Hydrogen Enriched Natural Gas in Spark Ignition IC Engines: from Fundamental Fuel Properties to Engine Performances and Emissions. Renew. Sustain. Energ. Rev. 82, 1457–1488. doi:10.1016/j.rser.2017.05.227
Keywords: hydrogen, natural gas, cogeneration, numerical modelling, hydrogen–NG
Citation: Costa M, Piazzullo D and Dolce A (2021) Hydrogen Addition to Natural Gas in Cogeneration Engines: Optimization of Performances Through Numerical Modeling. Front. Mech. Eng 7:680193. doi: 10.3389/fmech.2021.680193
Received: 13 March 2021; Accepted: 30 June 2021;
Published: 05 August 2021.
Edited by:
Vincenzo Mulone, University of Rome Tor Vergata, ItalyReviewed by:
Georgios Mavropoulos, National Technical University of Athens, GreeceBheru Lal Salvi, Maharana Pratap University of Agriculture and Technology, India
Copyright © 2021 Costa, Piazzullo and Dolce. This is an open-access article distributed under the terms of the Creative Commons Attribution License (CC BY). The use, distribution or reproduction in other forums is permitted, provided the original author(s) and the copyright owner(s) are credited and that the original publication in this journal is cited, in accordance with accepted academic practice. No use, distribution or reproduction is permitted which does not comply with these terms.
*Correspondence: Michela Costa, bWljaGVsYS5jb3N0YUBzdGVtcy5jbnIuaXQ=
 Michela Costa
 Daniele Piazzullo
 Alessandro Dolce2