 D. Kouprianoff
 I. Yadroitsava
 A. du Plessis
 N. Luwes
 I. Yadroitsev
- 1Department of Mechanical and Mechatronic Engineering, Central University of Technology, Bloemfontein, South Africa
- 2Research Group 3D Innovation, Stellenbosch University, Stellenbosch, South Africa
- 3Department of Mechanical Engineering, Nelson Mandela University, Port Elizabeth, South Africa
- 4Department of Electrical Engineering, Central University of Technology, Bloemfontein, South Africa
Quality concerns in laser powder bed fusion (L-PBF) include porosity, residual stresses and deformations during processing. Single tracks are the fundamental building blocks in L-PBF and their shape and geometry influence subsequent porosity in 3D L-PBF parts. The morphology of single tracks depends primarily on process parameters. The purpose of this paper is to demonstrate an approach to acoustic emission (AE) online monitoring of the L-PBF process for indirect defect analysis. This is demonstrated through the monitoring of single tracks without powder, with powder and in layers. Gas-borne AE signals in the frequency range of 2–20 kHz were sampled using a microphone placed inside the build chamber of a L-PBF machine. The single track geometry and shape at different powder thickness values and laser powers were studied together with the corresponding acoustic signals. Analysis of the acoustic signals allowed for the identification of characteristic amplitudes and frequencies, with promising results that support its use as a complementary method for in-situ monitoring and real-time defect detection in L-PBF. This work proves the capability to directly detect the balling effect that strongly affects the formation of porosity in L-PBF parts by AE monitoring.
Introduction
Metal additive manufacturing (AM) has grown significantly in recent years in industries such as aerospace, medical, automotive, and other high-tech areas. Additively manufactured parts can be produced with high resolution and excellent mechanical properties, in some cases even superior to cast or forged metal alloys, as described in detail in the review paper (DebRoy et al., 2018). The current economic and other considerations for cases where AM parts are viable and hold particular advantages are discussed in detail in DebRoy et al. (2019).
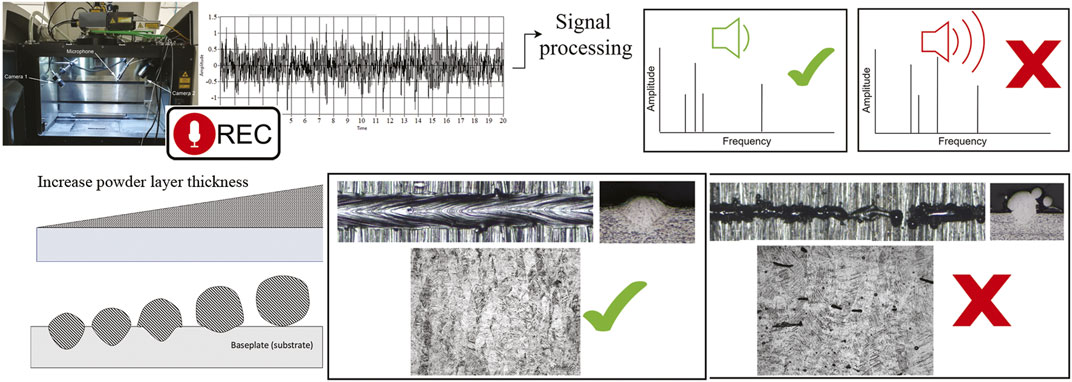
GRAPHICAL ABSTRACT
Laser powder bed fusion (L-PBF) is a widely used AM technology (du Plessis et al., 2019; Leary, 2020; Schmidt et al., 2017), with many commercial systems available. The L-PBF process involves many variables and a non-optimal setting (or variation) of these variables can result in reduced part quality, and these quality changes cannot always be easily detected. This is further complicated by the fast-growing field with different types of systems and the general lack of standards (Seifi et al., 2016; Seifi et al., 2017). The current state is such that published reports on mechanical and especially fatigue properties vary widely between different studies (Lewandowski and Seifi, 2016). The causes of these differences are often attributed to porosity (du Plessis et al., 2020), surface roughness (Beretta et al., 2020), microstructure (Gu et al., 2012) and residual stress (Bartlett and Li, 2019). These issues can be mitigated to some extent by post processing (du Plessis and Macdonald, 2020; Cai et al., 2016) or by process optimization (Yadroitsev et al., 2018).
There is a high demand for in-situ monitoring in AM generally, and especially in laser powder bed fusion, as evidenced by a series of reviews on the topic in recent years (Tapia and Elwany, 2014; Everton et al., 2016; Spears and Gold, 2016; Grasso and Colosimo, 2017; Lu and Wong, 2018). Possible defects in 3D parts are partly due to the high number of process variables, as discussed in more detail in a comprehensive review of in-situ monitoring in (Grasso and Colosimo, 2017). In this review, the concept of stability of single track formation is particularly discussed—as single tracks are the basic building blocks of the L-PBF process. Single tracks are often used to optimize process parameters for a particular powder material and L-PBF system. A stable single track is a primary necessity for fully dense 3D part production. Strictly speaking, there are no stable processes at the formation of a single track from powder material. L-PBF is a nonlinear process that depends on a set of input parameters and environmental conditions. The term “stable process” is a convention at the macro level, when smooth and even tracks alongside one another result in smooth and even layers, followed by the next layer above this with sufficient penetration depth into the previous layer, and the final result is the production of non-porous L-PBF parts with excellent mechanical properties. Hereafter in this paper the term “stability” is used in this context to define the formation of a smooth continuous single track/uniform single layer. When forming uneven tracks, for example in the case of the humping or balling effects, the tracks are irregular, which lead to adjacent tracks and successive layers insufficiently melting and, as a result, lack-of-fusion porosity occurs. The correlation between the shape and size of the melt pool/single tracks and porosity in 3D parts has been proven in many investigations (Yadroitsev, 2009; Tran and Lo, 2019; Kuo et al., 2020). The occurrence of defects during the L-PBF process was also described in detail in Kyogoku and Ikeshoji (2020) and Oliveira et al. (2020).
Only a few commercial in-situ monitoring systems are available so far as outlined in Everton et al. (2016), mainly in the form of imaging devices (cameras) and pyrometers. Cameras monitor the homogeneity of the selectively melted layer and/or the powder layer deposited by the powder delivery system. Thermal cameras are also used to monitor the melt pool size and shape, temperature, and aim to measure the stability of the melt pool. Variations in the characteristics of the melt pool are indicative of potential defect formation or an irregular process which can lead to porosity formation. Thermal cameras are also used to check local temperature hotspot generation for example in sharp corners of parts, as high temperatures lead to an irregular process with higher likelihood for porosity formation or surface roughness. Despite the efforts in this domain and the availability of commercial tools, the approach is still not optimized and limited success has been achieved. Some of the drawbacks are the large data sizes and the challenges in handling large data sets at high processing speed. Not all forms of irregularities or instabilities are necessarily detectable by these cameras, which also provides a motivation for additional (possibly complimentary) in-situ monitoring tools such as acoustic emission (AE).
ASTM E1316 and ISO 12716:2001 on non-destructive examinations defines AE as a “class of phenomena whereby transient elastic waves are generated by the rapid release of energy from localized sources within a material, or the transient waves so generated”. Online monitoring using AE is a versatile method as it can be developed and applied in various approaches for each specific need. In a first approach, called hit-based AE processing, a signal that exceeds a specific threshold compels a system channel to accumulate and process this data. In a second approach, time-driven AE processing, some characteristics of AE signals are studied on fixed time intervals. In a third approach, long waveform streams are used: AE signals emitted from the whole process are recorded to then identify events taking place during the process (cracking, damages, other specific defects). This third method was used in the present work to acquire data as recommended in ASTM E749-12 “Standard practice for AE monitoring during continuous welding.”
AE can be divided into gas- and structure-borne emission as a result of stress waves induced by changes in the internal structure of the part being processed. For structural monitoring, qualitative types of AE signals are burst (discrete) and continuous. “Burst” signals are especially useful for the detection of delamination and crack initiation under deformation. Acoustic signals from diffusive phase transformations or coalescence of microcracks can be classified as continuous signals. AE in materials that undergo phase transformations, deformations and fractures depends on the physical properties of the material as well as environmental factors.
AE has been used with great success in laser welding and cutting (Duley and Mao, 1994; Gu and Duley, 1994; Nakamura et al., 2000; Schiry et al., 2016; Yusof et al., 2017; Stepanova et al., 2019). In laser processes such as laser welding, ablation, cutting, fusion and surface treatment, various phenomena are observed, such as vaporization, melting and solidification, interaction of materials with the protective atmosphere, shrinkage, solid-state phase transformations, plastic deformations and cracking. These phenomena are all related to unique acoustic signals. It was shown that the acoustic energy and spectrum for laser-material interactions showed a strong correlation with laser power, speed, and laser spot size (Bordatchev and Nikumb, 2006; Yusof et al., 2017; Kacaras et al., 2019; Wu et al., 2020). Different AE signatures were found to distinguish the behavior of optimal and faulty laser welding (Eschner et al., 2018).
Acoustic emission was mentioned in reviews of non-destructive and in-situ monitoring methods for AM (Wu et al., 2016; Lu and Wong, 2017; Lu and Wong, 2018; Wu et al., 2019). AE signatures as a function of various process-parameters during metal AM was studied in Fisher et al. (2016), Gaja and Liou (2017), Koester et al. (2018), Wasmer et al. (2018), Taheri et al. (2019). Fisher et al. (2016) showed measurable and repeatable differences in the acoustic signatures of the L-PBF process as a function of laser power. Wasmer et al. (2018) found a correlation of AE data from a fibre Bragg grating acoustic sensor and porosity of samples manufactured at different scanning speeds. Gaja et al. (2017), Koester et al. (2018), Taheri et al. (2019) recorded AE signals during laser metal deposition (LMD/DED) processes and found correlations between AE events, various process conditions and defects. AE has also been applied with success to the crack monitoring in fatigue tests of additively manufactured titanium, which also illustrates the sensitivity to crack detection of the technique (Strantza et al., 2017). A non-contact acoustic in-situ monitoring method for AM was recently patented by General Electric (Redding et al., 2017; Gold and Spears, 2018) and Renishaw (Hall, 2016). In Redding et al. (2017), the AE sensors are used to compare signals from a reference defect-free part (confirmed by other methods), to real-time AE data of the printed part. It is alleged that sudden deviations in the amplitude of acoustic signals indicate a fault in the process.
Acoustic emission holds promise as a simple, low-cost process monitoring tool, however, AE in-situ monitoring devices are not yet commercially available. In a L-PBF process, a simple microphone was used to monitor the process signature in Ye et al. (2017) and machine learning methods were employed to find process signals correlating to irregular track formation and porosity formation due to balling and overheating, showing great promise for the method (Ye et al., 2018). Under less severe conditions with smaller porosities, a similar approach was recently found to be successful, though using a more specialized microphone (fiber Bragg grating) (Shevchik et al., 2018; Wasmer et al., 2018; Wasmer et al., 2019). A similar concept is under development and preliminary results reported in (Eschner et al., 2018). All the above-mentioned methods combine machine learning with AE, with the aim to find irregular process signatures and potentially correct these—for example by inducing a full remelting of a defective layer.
An ultrasonic probe attached to the bottom of the build plate was shown to be sensitive to residual stress and also some forms of porosity formation in-situ (Rieder et al., 2014). Another related approach which showed some promise is Spatially Resolved Acoustic Spectroscopy, first demonstrated in an offline case in Smith et al. (2016) and later demonstrated for online inspection using deep learning in Williams et al. (2018). Recently, the method was used to identify crystallographic textures, initially in an offline scenario but potentially also deployable for in-situ process monitoring (Dryburgh et al., 2019). The detection of artificial cavities of only 0.2 mm in size has recently been demonstrated using laser-induced phased arrays, although the response is not equal throughout the volume (Pieris et al., 2020). All these afore-mentioned techniques are technologically challenging in some ways, either in hardware or in machine learning required.
Overall, the ultimate aim is to contribute to the in-situ detection of process-induced defects for improving part quality and even assisting in efforts to create a digital twin of AM processes (Redding et al., 2017; Gaikwad et al., 2020). At optimal process-parameters, L-PBF of Ti6Al4V ELI samples can show very high density (>99.9%) and only randomly distributed small pores (Yadroitsev et al., 2018). However, non-homogenous powder delivery or redistribution of the powder layer during processing of complex-shaped samples can cause too-thick powder layers or, inversely, create areas without powder. In the case of a critically thick powder layer, there will not be metallurgical contact between the melt pool and the previous solidified layer/substrate. Laser processing of areas without powder will only result in re-melting of the previously solidified layer. When applying the subsequent powder layer, a thicker layer will be obtained, which can cause a balling effect characterized by irregular tracks with highly varying widths and heights up to a chain of beads. Early online detection of the unstable or irregular formation of single tracks due to these problems could prove to be an effective way of preventing porosity and other defects in L-PBF manufactured parts.
It is important to estimate the critical (threshold) thickness of the powder layer where irregular track formation and hence associated porosity in 3D objects initiate. This was investigated in the present study by manufacturing 3D samples with intentionally designed horizontal cavities where the laser beam does not melt areas of between 30 and 300 µm in height. In this way, the critical layer thickness for porosity formation can be evaluated at a certain laser power density and scanning speed, since when these parameters change, the critical layer thickness will also change. In order to evaluate the porosity quantitatively, samples were micro-CT scanned and also cross-sectioned for optical microscopy. Single tracks were subsequently manufactured at different process parameters and with different layer thicknesses. The present work demonstrates the analysis of unique AE signatures associated with the formation of a single track with optimal process parameters, as well as identification of tracks manufactured at powder-free areas and at too-thick powder layers.
As is known, there are different instabilities in the L-PBF process; some have a stronger effect on the appearance of defects than others. In this investigation, we studied the influence of the balling effect on changes in the acoustic signal, with the constant presence of other instabilities, since the balling phenomena due to thick powder layers is one of the most important effects that influences the porosity of L-PBF parts. The novelty in the work lies in the direct detection of specific markers of unstable conditions leading to the balling effect, which in turn causes lack of fusion porosity. The simple algorithm and methodology demonstrated can potentially be applied in-situ for correcting errors in a feed-back control scheme, which is extremely important in manufacturing high quality L-PBF parts (Hall, 2016; Druzgalski et al., 2020).
Materials and Methods
The system used for L-PBF manufacturing was an EOSINT M280 machine (EOS GmbH) with building platform of 250 × 250 mm, equipped with an ytterbium fiber laser operating at 1,075 nm wavelength, TEM00 Gaussian profile and 80 µm spot size. The experiments were carried out on a Ti6Al4V substrate in Ar protective atmosphere. Pre-alloyed gas atomized powder Ti6Al4V ELI (extra low interstitial) from TLS Technik GmbH & Co. Spezialpulver KG (Germany) was used. The equivalent diameters of the powder particles were d10 = 12.03 μm, d50 = 21.38 μm, and d90 = 31.15 μm. Values of d10, d50, and d90 correspond to the percentages 10, 50, and 90% of particles (weighted by volume) under the reported particle size.
Firstly, preliminary tests investigating the critical powder layer thickness which causes lack of fusion porosity in 3D L-PBF parts were conducted. Secondly, AE signals under different layer thickness and laser powers were studied for single track formation. The third part of the experiments was performed with three powder layer thicknesses: no powder, reference (optimal) powder layer thickness and critical (too large) powder layer thickness in order to develop and demonstrate a simple layer thickness recognition algorithm using AE.
Preliminary Tests on 3D Sample With Artificial Porosity
A test sample with artificial rectangular cavities was designed to find the critical powder layer thickness at which pores start to form (du Plessis et al., 2016). The thickness of the designed cavities varied from 1–6 times that of a single powder layer (30–180 µm), as shown in Figure 1. The resulting porosity found by CT scans and cross-sections in each of these cases aim to demonstrate what the critical layer thickness is for optimal process parameters.
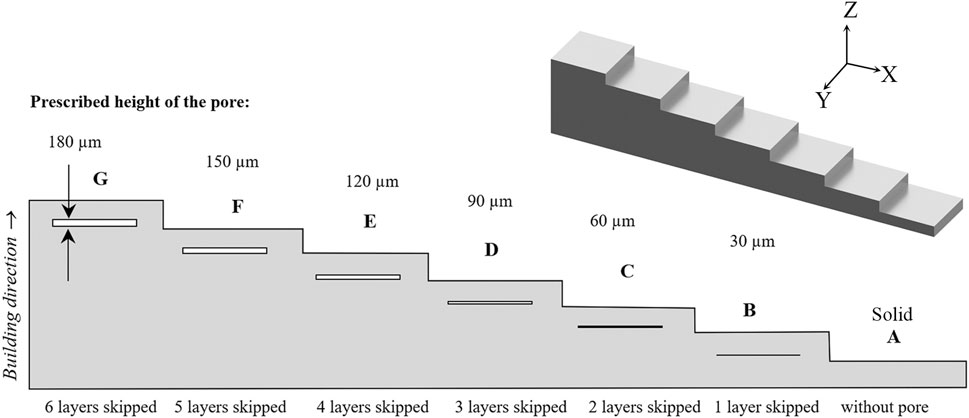
FIGURE 1. Test sample, solid part (A) and parts with prescribed internal cavities of 30–180 µm (1–6 powder layers skipped) (B–G), axis Z is the building direction, XY is the scanning plane (top image).
Design of Experiments With Single Tracks for Acoustic Emission Tests
To establish a correlation between the sound pressure level (SPL), the frequency spectrum of the sound and the shape of the single tracks, a series of experiments were performed. First, two tracks per set with individual tracks 48 mm in length were manufactured on a substrate without powder and with different thicknesses of the powder layer (30, 60, 120, 150, and 300 µm) at a laser power of 170 W and scanning speed of 1.2 m/s, which is optimal for 30 μm layer thickness (Yadroitsava et al., 2015). The signals from each set of tracks were split into four parts, and average values of eight signals were analyzed. Secondly, to study the effect of laser power, single tracks (two tracks in each set) were produced on a substrate without powder at 100, 170, and 340 W at a fixed scanning speed of 1.2 m/s. The lengths of these tracks were also 48 mm.
Layer Thickness Recognition Algorithm
To investigate the repeatability of the AE signals, three sets of ten tracks each with 90 mm length were produced at 170 W and 1.2 m/s scanning speed. Tracks for the reference layer thickness of 30 μm, tracks without any powder and tracks with a 120 µm thick layer were produced. This series of experiments simulates extreme scenarios of non-homogeneous powder layer thickness in L-PBF. From the preliminary test, a critical powder layer thickness (120 μm) was chosen to trigger the balling effect, which is known to provoke porosity in 3D-printed L-PBF parts. Single layers (square areas) of 10 mm × 10 mm were produced at the same laser parameters with a unidirectional scanning strategy and 100 µm hatch distance.
Acoustic Emission Signal Processing
AE signal analysis was performed by post-processing, compiled and implemented using LabView (National Instruments) and its signal processing algorithms library. The sound propagating through the surrounding protective atmosphere was recorded and analyzed subsequent to the L-PBF process. A 1/2″ pre-polarized free-field condenser microphone 378B02 model (PCB Piezotronics, Inc., United States) was installed at an angle of 20° to the vertical and 240 mm above the edge of the building platform and used to record the AE signal (Figure 2). The microphone has an optimal frequency range of 3.75–20,000 Hz (±2 dB). According to the Nyquist criterion, the sampling frequency for Fast Fourier Transform (FFT)-based measurements is required to be at least twice the maximum frequency component in the signal. In the present investigations, the AE data for each test was acquired at a sampling frequency of 102.4 kHz, i.e., ∼5 times higher than the maximum measured frequency of 20 kHz.
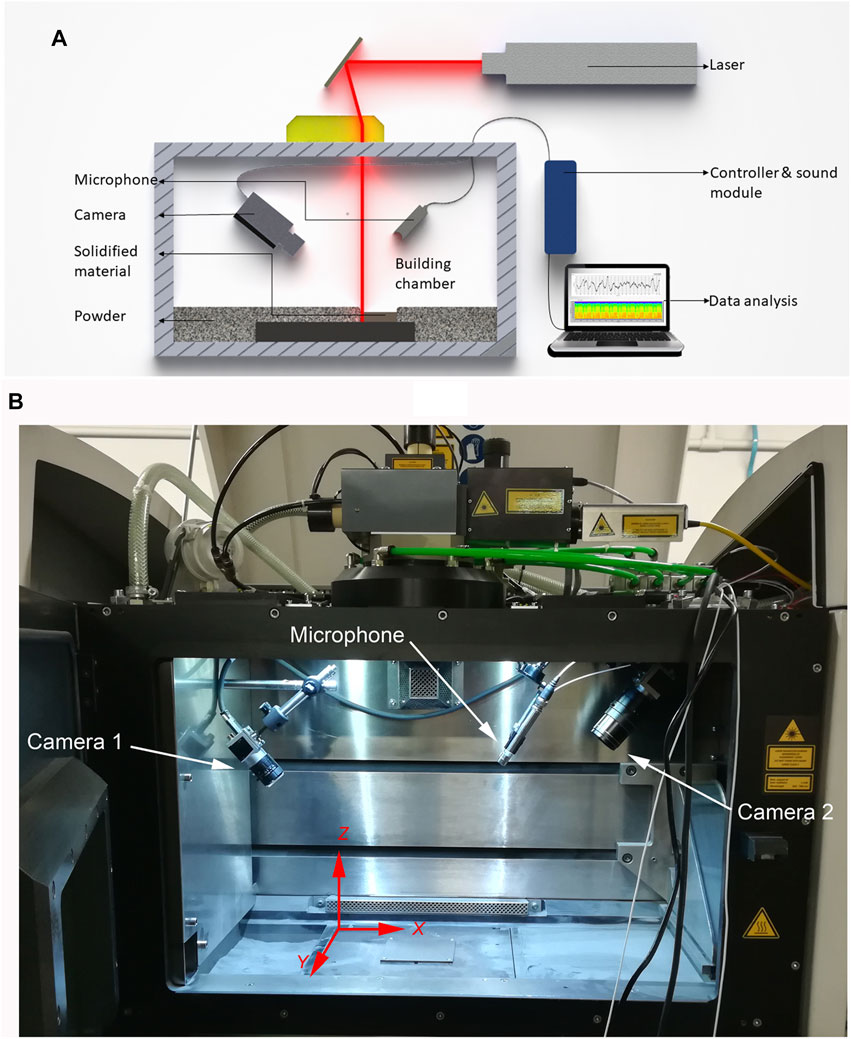
FIGURE 2. Schematic of experimental setup (A) and building chamber view showing the location of the microphone and cameras (B). The laser scanning direction is along the Y axis; Ar also flows in the positive Y direction.
In order to develop an AE signal model that can recognize the layer thickness, one would firstly need to calculate the signal-to-noise ratio (SNR) of the AE. The AE registered signal was comprised of a sound from the environment and from the L-PBF process. It was found that after applying a 2 kHz high pass filter, the start and end of the tracks were clearly distinguishable. The signal to noise ratio was calculated from FFT as the ratio of cumulative amplitudes at 0–2 kHz to 2–20 kHz frequency components. The signal-to-noise values were −10.2, −4.7, and −3.7 dB for tracks without powder, with 30 µm and with 120 µm powder thickness, respectively. Analysis of the dominant frequencies was performed using FFT.
To identify the model required for the recognition of irregular morphology of tracks through AE, the recorded data was also processed using Short Time Fourier Transform (STFT). To obtain an initial general conception of the sound emitted during the L-PBF process, STFT was selected as it is relatively easy to implement and interpret. A STFT spectrogram of ten tracks for each set was done without powder (0), one layer (1, reference 30 µm layer), and critical (thick 120 µm layer) powder thickness. To create the models, ten tracks for each layer thickness were used. These ten tracks were then split into two groups. One group was used to build the model and another group for testing. The model was built using the first six tracks. The remaining four tracks were each tested against the model.
The steps in the forming of the algorithm are:
• Apply 2 kHz high pass filter to remove the noise from the signal;
• Calculate the frequency domain and identify the frequency content of studied thickness;
• Use the identified frequency content and create a model that could recognize a deviation.
The aim of the model is to make use of the identified frequency content to determine regimes of scanning without powder or on a thick layer when the “balling” phenomena starts.
Results
Powder Layer Thickness and Pore Formation in 3D Samples
The heights of the rectangular cavities in the 3D test sample were designed in the range of 30–180 µm. Up to 180 µm (six skipped powder layers), an entirely open cavity was not produced as expected, and the designed rectangular pore has the appearance of a chain of irregular pores as observed in CT scans (du Plessis et al., 2016) and as shown in physical cross-sections (Figure 3). The cross section of the sample showed that the internal cavities had irregular shapes and pronounced lack of fusion defects started only at 120 µm thickness of the powder layer (E–G), Figure 3. In areas with rectangular cavities designed at 30, 60, and 90 μm in height, only random small pores with size less than 50 μm were found. Thus, at the selected laser power and scanning speed, a designed thickness at (and above) 120 µm led to a chain of pores, or extensive “lack of fusion porosity”.
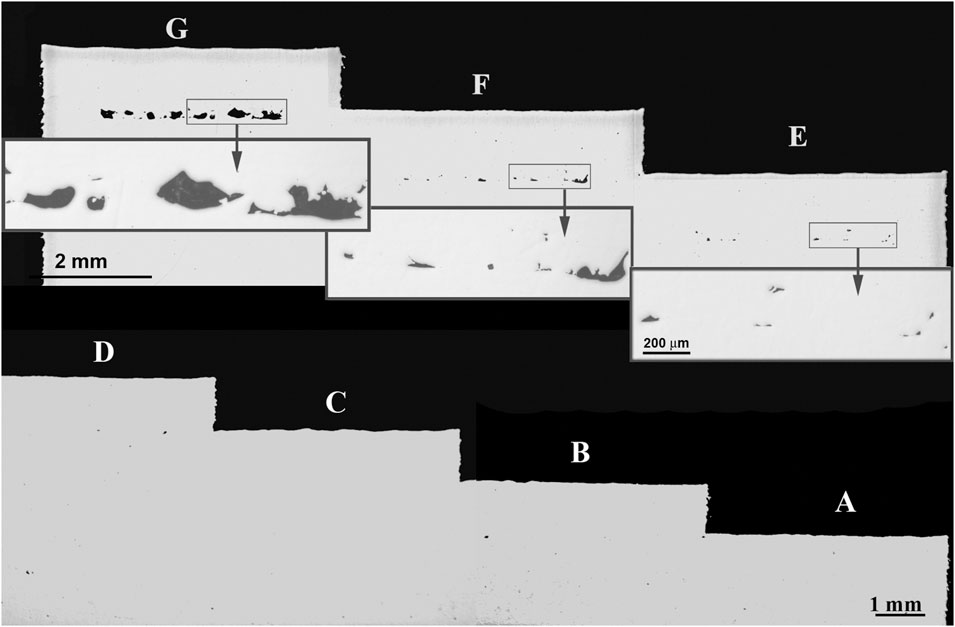
FIGURE 3. Images from optical microscope of cross-sections of the 3D test sample with designed internal cavities of 30–180 µm (see also Figure 1).
The shape of single tracks at different powder layer thickness was analyzed further at similar laser power and scanning speed (Figure 4). The progression of increasing track irregularity with increasing powder thickness is clear, up to the balling effect at high thickness.
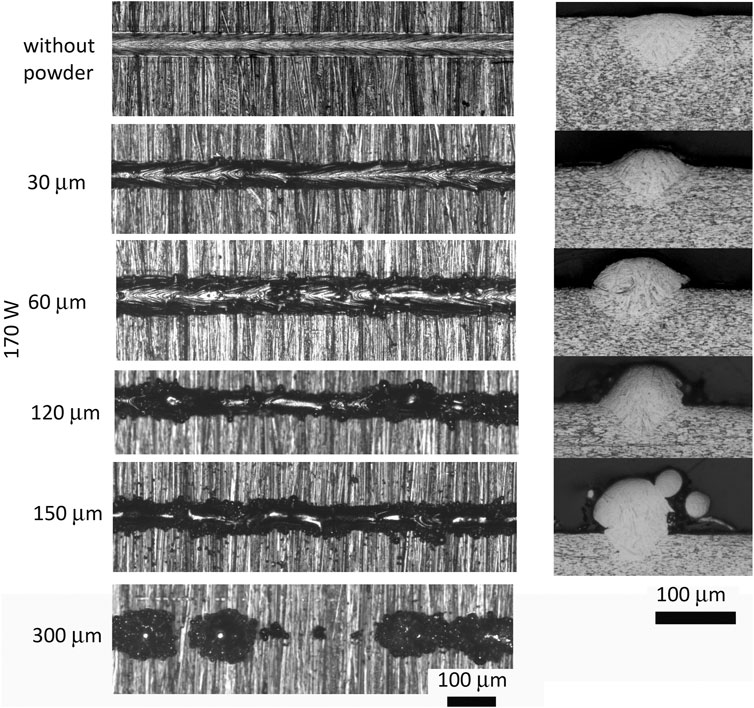
FIGURE 4. Typical view of single tracks on the substrate at different powder layer thickness: top view (A) and cross-sections (B), scanning speed of 1.2 m/s and laser power of 170 W.
Morphology and Acoustic Emission of Single Tracks Manufactured at Different Layer Thicknesses
In the first series of AE experiments with single tracks, clear differences in track morphology were observed from the top and cross-sectional views at different layer thicknesses (Figure 4). Note the uniform smooth tracks on the substrate without powder, while regular continuous tracks were produced with powder up to layer thickness of 60 μm.
Irregular tracks started at 120 µm powder layer thickness. At this thickness, a pre-balling effect begins, where tracks were still continuous but had an irregular shape in the form of a sequence of beads interconnected by curved tapering tracks. The tracks on the 300 µm thick powder layer had no regular metallurgical contact with the substrate—only some molten beads were slightly attached to the substrate at random areas. This means that at this laser power, spot size and scanning speed, the laser power is not enough to melt both the 300 µm powder layer and the substrate material.
With an increase in powder layer thickness, more material is involved in the process that increases the size of the top part of the track and decreases the depth of penetration into the substrate and reduces the contact zone (Figures 4, 5). A decreased penetration depth into the substrate material (or previously remelted/processed layer) ultimately caused lack of fusion porosity (Yadroitsev, 2009; Oliveira et al., 2020). During the process of the formation of a single track, the value of the recorded SPL increases with increasing layer thickness up to 120 µm and then a turning point occurs (Figure 5). The analysis of the cross section showed a similar behavior of the contact zone, which also reached a maximum at a layer thickness of 120 µm (Figure 5). When more powder and substrate material were involved in the process, this corresponded to higher AE intensity. Then, when the track lost continuous contact with the substrate, the SPL decreased. For the selected laser power of 170 W and scanning speed of 1.2 m/s any layer thickness greater than 120 μm results in insufficient metallurgical contact with the substrate. Thus, the substrate begins to be excluded from the process. Any further increase in the powder thickness will lead to absorption of the emitted sound by the powder and ultimately stabilize the SPL value.
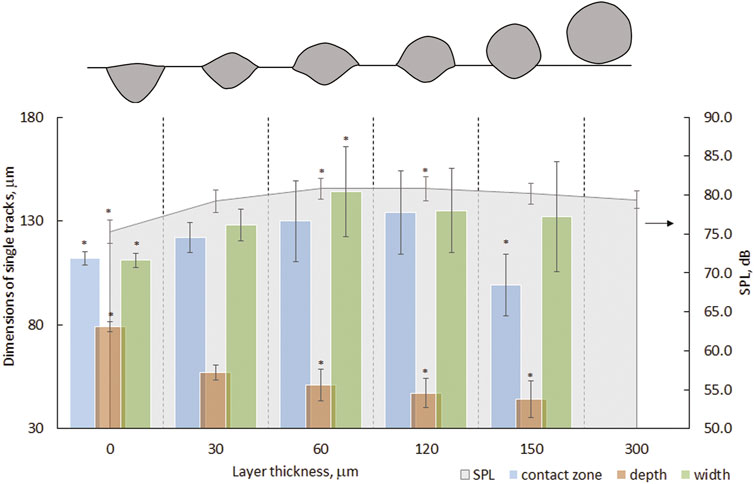
FIGURE 5. Geometrical characteristics of single tracks at 170 W and 1.2 m/s and the corresponding total sound pressure level in dB referenced to 20 µPa. Statistically significant differences in average values (t-test, p < 0.05) in comparison with 30 μm layer thickness group are indicated by “*”). A schematic model of the evolution of the cross-section of the track with powder layer thickness is shown in the top.
Spectral analysis of the signal for the single tracks showed that, with an increase in the thickness of the powder layer, not only the total SPL changes, but also the spectral frequency of the sound (Figure 6). FFT amplitudes of single tracks had 20–150% coefficients of variation (i.e., ratio of standard deviation to average value). Thus, non-parametric median values of the AE frequency spectrum were used.
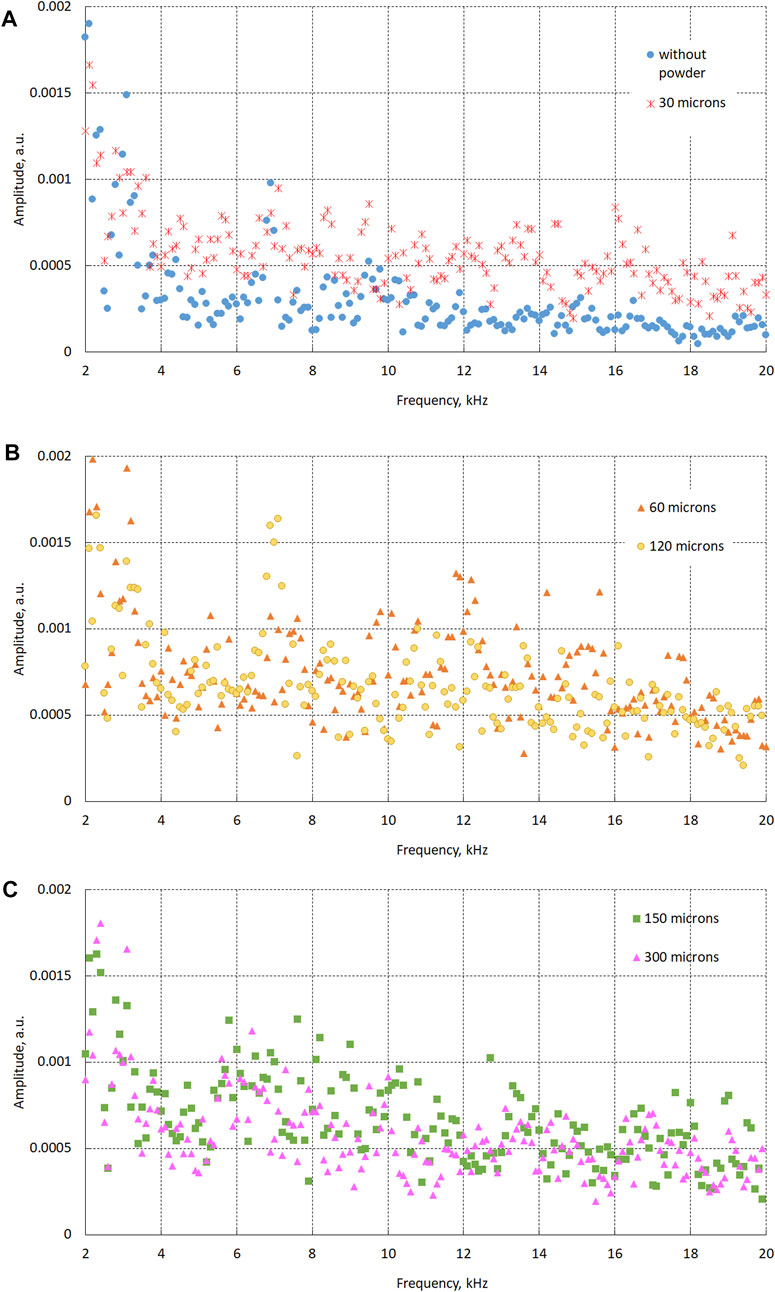
FIGURE 6. Frequency spectrum and median intensity of Fast Fourier Transform (FFT) acoustic emission (AE) signals for single tracks produced without powder and 30 μm (A), 60 and 120 μm (B), 150 and 300 μm (C) powder layer thickness.
All processed layers had high median values of AE intensity amplitudes at 2 and 3.5 kHz. Without powder, the peaks were low, especially after 10 kHz (Figure 6). At the reference 30 μm powder layer, the intensity of the signal increased for all frequencies. The signal was stable, without expressed peaks. With an increase in the layer thickness to 60 μm, peaks were found at 12 kHz. Further increasing layer thickness up to the critical value of 120 μm led to the appearance of high signals near 7 kHz with amplitudes 1.5–2 higher than without powder. At 150 μm layer thickness, peaks shifted to lower frequencies. Some high amplitude peaks were found for single tracks at a layer thickness of 300 μm at 5.5–8 kHz, the high frequency spectrum had lower amplitude and shifted left. The overall amplitude of the frequencies follows the same pattern as with the SPL in that the energy increases up to 120 µm layer thickness and then decreases. As the powder layer increases beyond 10 layers (300 µm), the melt pool will not touch the substrate at all due to the penetration depth into the powder bed staying at maximum, regardless of the thickness of the powder layer beneath the track and, therefore, amplitudes at all frequencies are flattened (Figure 6).
Apparently, the main sign of an increase in the layer thickness and the associated balling effect is the presence in the spectrum of high amplitudes at frequencies of about 7–10 kHz, but this assumption should be studied on a larger number of single tracks, forming a single layer at different layer thicknesses. Acoustic phenomena such as reflections, resonances etc. can drastically affect the AE measurements, this needs to be considered along with the sensor specifications and placement.
Morphology and AE of Single Tracks Without Powder at Different Laser Powers
The AE signals for laser processing of the substrate without powder at laser power of 100, 170, 340 W and 1.2 m/s scanning speed was studied (Figure 7). At 100 W, the presence of frequencies above ∼7 kHz was low (Figure 7A), and the cumulative amplitude was almost constant (Figure 7B). At 170 and 340 W, high frequencies started to contribute more to the AE signal and the cumulative amplitude increased 1.5 and 2.7 times in comparison with 100 W processing, correspondingly.
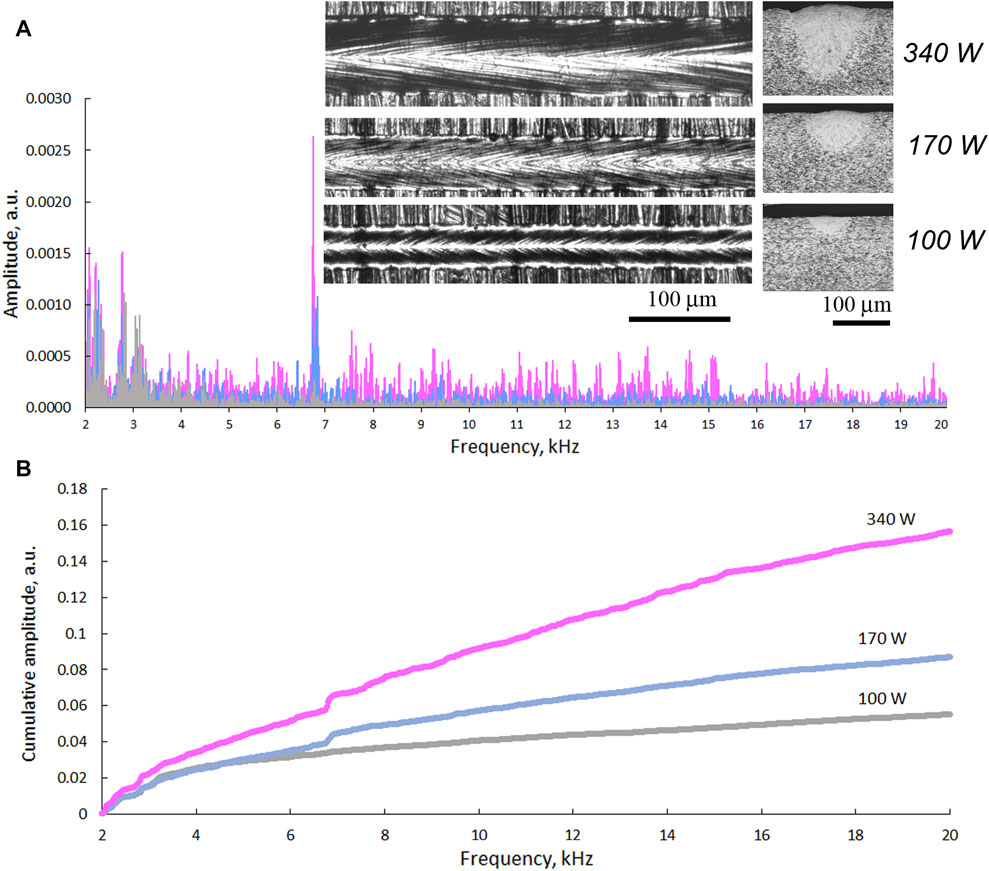
FIGURE 7. Typical FFT spectrum and photos of single tracks without powder at 100, 170, and 340 W laser powers and 1.2 m/s scanning speed (A) and cumulative amplitude at 2–20 kHz (B).
Discussion and Acoustic Emission Layer Recognition Algorithm
Increasing the laser power leads to a wider and deeper melt pool (Figure 7A) and correspondingly the AE energy also increased over all frequencies, (Figure 7B). The SPL at the formation of single tracks without powder was 73.5 ± 1.49 dB, 75.3 ± 1.48 dB and 78.6 ± 3.0 dB for the laser power of 100, 170, and 340 W, respectively. The generation of acoustic waves during melting and solidification of the material can be due to phase transformations, instantaneous changes in the volume of the gas in the region of the melt pool, and the ejection of particles in the spattering process. An increase in the laser power leads to an increase in the temperature and size of the melt pool, deeper penetration into the substrate up to the keyhole regime. As shown in Mao et al. (1993), the keyhole mode dramatically raised AE for laser welding. In L-PBF, changing scanning parameters have a drastic effect on the melt pool shape, denudation zone and spattering effects (Yadroitsev, 2009; Bidare et al., 2018). As shown in Figure 6, the intensity of the AE signal increased when more material was involved in the process (thicker layers). Since a layer consists of multiple tracks that are next to each other, depending on the position of the single track, varying amounts of solid and powder material will be involved in the melt pool and consequently affect the progression of the AE. With increasing laser power, the temperature of the melt pool and the vapor pressure significantly increases, which leads to a change in AE signal. Higher energy input also increases the spatter process (Wang et al., 2017; TaheriAndani et al., 2018) which will certainly affect the frequency and intensity of the AE signals. In the present experiments, the spatter effect increases with powder layer thickness and this correlates well with the SPL and frequency changes.
FFT for AE signals from three sets of ten tracks each with 90 mm length that were produced at 170 W and 1.2 m/s scanning speed shows similar results. The case without powder layer showed low AE, especially at a higher frequency, about 50% of signal strength was concentrated between 2 and 7 kHz (Figures 5, 8). There is a clear corresponding rise in cumulative amplitude of AE signals after 6 kHz with layer thickness. These types of indicators can be used to develop online monitoring identifiers. Analysis of the SPL and dominant FFT frequencies averaged over the entire signal time intervals suggested that the AE signal can correlate with processed layer thickness and with the size of the melt pool.
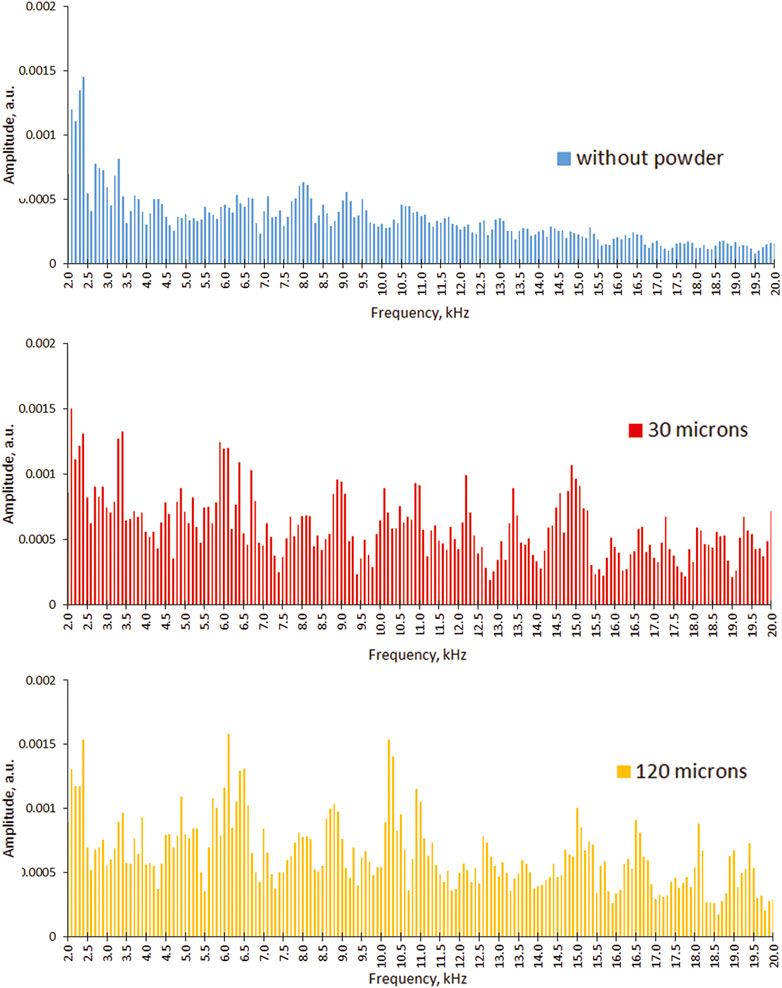
FIGURE 8. FFT spectra and average intensity of AE signals for 10 single tracks produced without powder, 30 and 120 μm powder layer thickness at 170 W laser power and 1.2 m/s scanning speed.
In general, due to the high variability of the amplitudes, it was difficult to find a simple direct correlation between the dominant frequencies and the thickness of the layer for the studied 2–20 kHz range (Figures 5, 8). Apparently, the main sign of an increase in the layer thickness and the associated balling effect is the presence in the spectrum of high amplitudes at frequencies of 6–10 kHz, but this assumption should be investigated on a larger number of single tracks, forming a single layer. FFT amplitudes of single tracks varied significantly with time during processing, so STFT was used to evaluate the effect of powder layer thickness on the process AE.
Summing up all the STFT values at individual frequencies over time, can indicate how much of each frequency was present for each powder thickness (without powder, 30, 120 µm), Figure 9A. The proposed layer recognition algorithm works by creating a signature for each deviation from the reference signal, one signature for the deviation from “reference-to-no-powder layer” and another signature for the deviation from “reference-to-thick powder layer”.
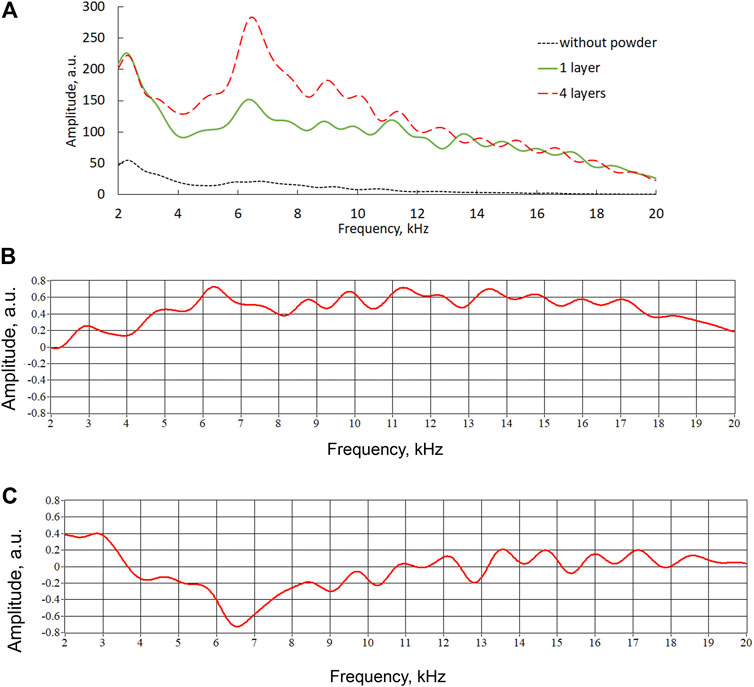
FIGURE 9. Cumulative amplitude of AE signals for six tracks in different sets: no powder (dotted line), 1 layer (30 µm as reference, solid line) and four layers (120 μm, dashed line) of powder thickness (A). Signature curves of “reference–no powder” (B) and “reference–thick powder layer” (C).
The amplitude Af for each frequency f was calculated as
and then it was scaled to [−1; 1] by Eq. 2:
Each set of track data was subtracted from the reference set to obtain the two signature/characteristic curves: “reference layer” minus “no powder layer” and “reference layer” minus “thick powder layer”. The characteristic difference ΔAf in amplitudes for each frequency is calculated by:
The results of the two signature/characteristic curves for thick powder layer and scanning without powder calculated from Eq. 2 are shown in Figures 9B,C. The signature/characteristic curves shown in Figures 9B,C were used in the algorithm to test the remaining tracks. This was done by subtracting the new AE signal from the reference signal and correlating the answer to the two signature curves (“reference-no powder” and “reference-thick layer”).
For the quantitative data comparison algorithm, normalized correlation between the remaining set of tracks and the two characteristic curves from model were calculated by:
where:
The models showed high correlation values >0.8 for the “reference-no powder” model and >0.6 for the thick powder layer (Table 1). The reference tracks showed very low correlation with either model, as expected.
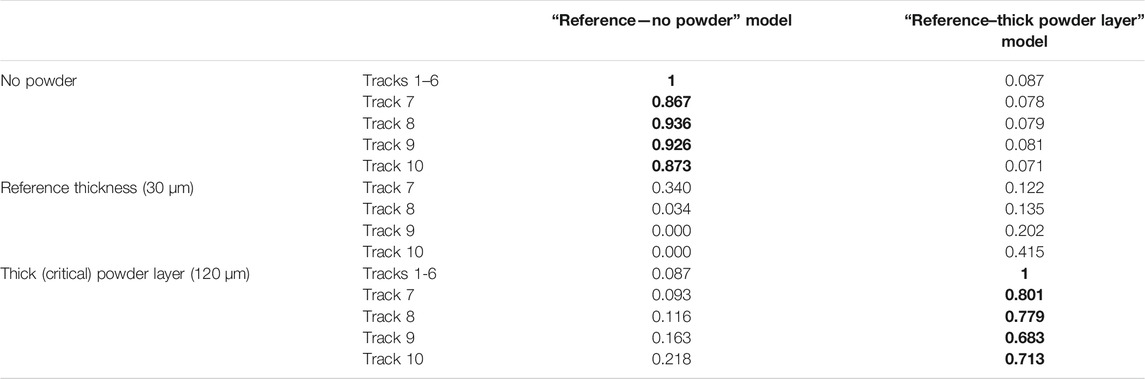
TABLE 1. Correlation coefficients for experiments with single tracks. The values in bold are the that should correspond to that column i.e., data should correlate to that column.
To implement this approach for online monitoring by AE, the recorded sound must be compared to both the models (Figure 10). Low correlation to either model means that the L-PBF process occurs within the specified parameters and presumably without defects. High correlation with the “no powder” model indicates that tracks were processed with lower powder thickness than expected, this will increase the probability of thick powder being present on the next layer. High correlation with the “thick powder layer” model indicates a high probability of balling effect and subsequent “lack of fusion” porosity in the corresponding area of the part. Additionally, other type of defect signatures can potentially be created and added to expand the range of defects which the system can recognize.
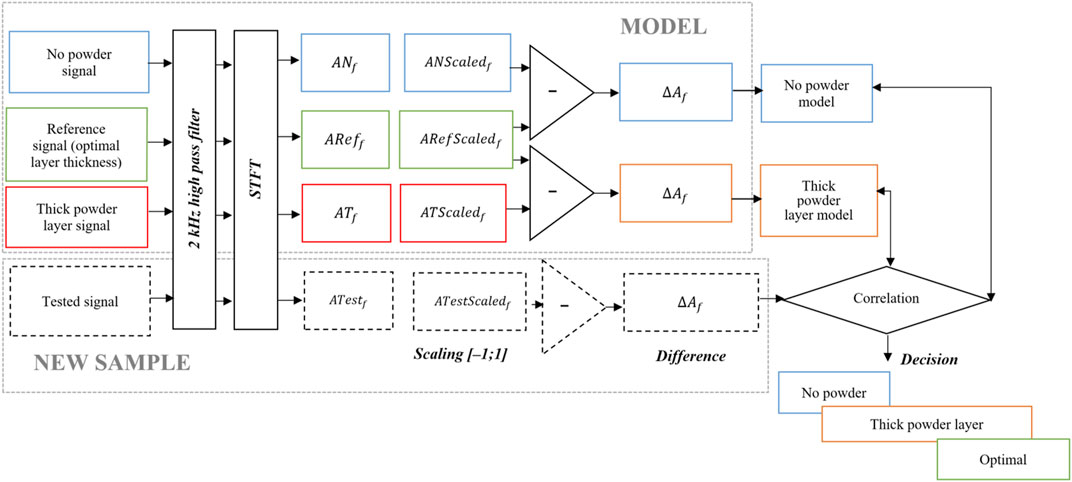
FIGURE 10. Flowchart for recognition of layer thickness by AE signals.
The same procedure was used to create and test the algorithm for the layers. The results show to be similar in that: the AE energy increases with powder layer thickness; the same peaks are present at ∼6–8 kHz and for no powder the energy is low at higher frequencies (Figure 11).
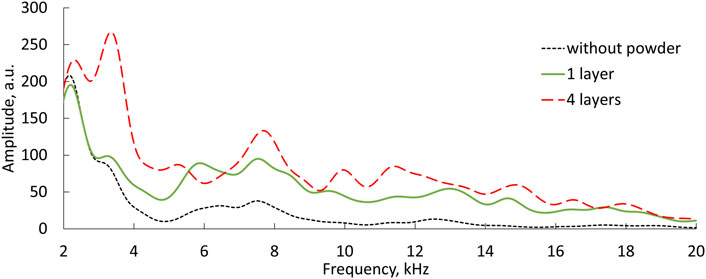
FIGURE 11. Cumulative amplitude of AE signals for single layers in different sets of powder thickness: 1 layer (30 µm as reference, solid line), four layers (120 μm, dashed line), and without powder (dotted line).
One notable difference between single tracks and single layers are observed for no powder, 60 and 120 µm: an increased amplitude at ∼3.5 kHz peak is present for layers which was not observed for tracks. This can be due to an increase in local heating and in the regular change of the denudation zone in the manufacturing of a sequence of tracks, i.e., a layer, which is absent in the manufacture of single track (Yadroitsev and Smurov, 2011). The layers correlated very well with the two models (Table 2). Correlation values of the reference thickness showed some correlation to “reference-no powder” model. The threshold for the layers can be set as high as 0.9 to warn the system for a defective powder layer.
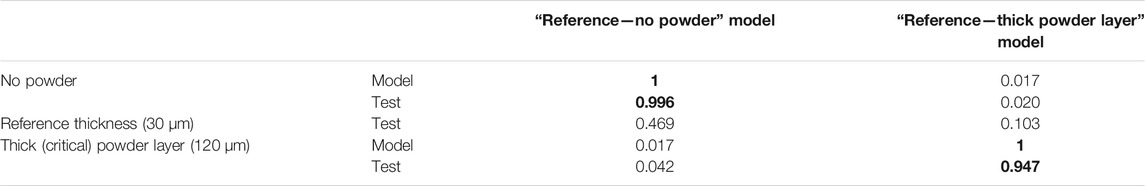
TABLE 2. Correlation coefficients for model/test experiments. The values in bold are the that should correspond to that column i.e., data should correlate to that column.
This AE approach can possibly be implemented using a device like a Field Programmable Gate Array (FPGA). The AE can be analyzed during the building process, once the correlation threshold is exceeded a signal can be sent to the operating system either to adapt or interrupt the building process or stop a specific defect part. Future work could include other linear time invariant algorithms with the identified frequencies.
Conclusion
In this paper, a detailed analysis of airborne AE signals for laser powder bed fusion of single tracks and layers is presented. Track morphology at different layer thickness and laser powers are compared to AE signals. The results show that a simple algorithm could accurately identify problematic situations where the thickness of the powder layer is uneven or above a critical value: it can identify between cases when there is no powder, a reference powder layer and a thick powder layer when the balling effect started, and when tracks were irregular in shape (resulting in lack of fusion).
In real conditions, if we consider the process of manufacturing the core area of a L-PBF part, the process parameters do not change and are constant for a certain material. The only variable is the layer thickness, due to uneven delivery of the powder layer, material shrinkage, denudation zones, scanning strategy, and so on. This study has shown how the AE signal changes depending on the layer thickness and how this can be implemented as an online monitoring tool.
The post processing algorithm can be used in the design of a real time online process monitoring of laser powder bed fusion. Changing the layer thickness has a great effect on the AE. It is therefore proven to be viable to detect and directly correlate AE signals with process instability leading to the balling effect. AE might be a valuable missing complementary tool in online monitoring systems.
The complex nature of the L-PBF process leaves much space for investigation of the sources of AE and how each parameter may affect the AE signal along with the limitations of using these signals. The limit of the smallest thickness deviation that this method can detect should be investigated. Also, most definitely, some of the defects associated with the balling effect can be eliminated by manufacturing subsequent layers. Therefore, one should consider not a single marker indicating a possible defect in a specific location, but a set of signals arising in a specific location on a certain number of layers, which will indicate a high probability of a defect in this location.
Future work involves finding what information might be hidden within the machine noise (0–2 kHz) and using other signal processing tools. To develop an online monitoring method, further research is needed to determine how other factors can change the sound emitted during the L-PBF process. For example, factors like scanning strategies which influence melt pool temperature, and part geometry, especially those containing overhang areas could also affect this. When looking at the scanning strategy—changing scanning parameters at the border of the part, should not be recognized as a defect. When considering an overhang, the thickness of powder layer and scanning parameters may change and this must be taken into account with monitoring by AE. These factors make it difficult to find a generalized solution and not to mention others like different platforms and technologies that are being used: physical dimensions, materials, and hardware such as build platform heating and multi-beam laser technology. This limits one from simply applying a method without considering all the detail of each specific case, but this limitation is inherent to all process monitoring tools. The proposed algorithm can be fine-tuned and extended to include different events other than layer thickness, this approach can then be integrated with the L-PBF software to either alarm or adapt system parameters when AE does not correlate to the required reference values.
Data Availability Statement
The raw data supporting the conclusion of this article will be made available by the authors, without undue reservation.
Author Contributions
All authors contributed to this work. DK led the experimental work, IY1 and IY2 conceptualized the study and wrote most of the paper, AP made contributions in editing and revising the work, NL took part in data analysis. All authors checked and approve the submission.
Funding
This work is based on the research supported by the South African Research Chairs Initiative of the Department of Science and Technology; National Research Foundation of South Africa (Grant No 97994). The authors are grateful to Johan Els and Jenny van Rensburg for their assistance.
Conflict of Interest
The authors declare that the research was conducted in the absence of any commercial or financial relationships that could be construed as a potential conflict of interest.
References
Bartlett, J. L., and Li, X. (2019). An Overview of Residual Stresses in Metal Powder Bed Fusion. Additive Manufacturing 27, 131–149. doi:10.1016/j.addma.2019.02.020
Beretta, S., Gargourimotlagh, M., Foletti, S., du Plessis, A., and Riccio, M. (2020). Fatigue Strength Assessment of “as Built” AlSi10Mg Manufactured by SLM With Different Build Orientations. Int. J. Fatigue 139, 105737. doi:10.1016/j.ijfatigue.2020.105737
Bidare, P., Bitharas, I., Ward, R. M., Attallah, M. M., and Moore, A. J. (2018). Fluid and Particle Dynamics in Laser Powder Bed Fusion. Acta Materialia 142, 107–120. doi:10.1016/j.actamat.2017.09.051
Bordatchev, E. V., and Nikumb, S. K. (2006). Effect of Focus Position on Informational Properties of Acoustic Emission Generated by Laser-Material Interactions. Appl. Surf. Sci. 253, 1122–1129. doi:10.1016/j.apsusc.2006.01.047
Cai, C., Song, B., Xue, P., Wei, Q., Wu, J.-M., Li, W., et al. (2016). Effect of Hot Isostatic Pressing Procedure on Performance of Ti6Al4V: Surface Qualities, Microstructure and Mechanical Properties. J. Alloys Compd. 686, 55–63. doi:10.1016/j.jallcom.2016.05.280
DebRoy, T., Mukherjee, T., Milewski, J. O., Elmer, J. W., Ribic, B., Blecher, J. J., et al. (2019). Scientific, Technological and Economic Issues in Metal Printing and Their Solutions. Nat. Mater. 18, 1026–1032. doi:10.1038/s41563-019-0408-2
DebRoy, T., Wei, H. L., Zuback, J. S., Mukherjee, T., Elmer, J. W., Milewski, J. O., et al. (2018). Additive Manufacturing of Metallic Components - Process, Structure and Properties. Prog. Mater. Sci. 92, 112–224. doi:10.1016/j.pmatsci.2017.10.001
Druzgalski, C. L., Ashby, A., Guss, G., King, W. E., Roehling, T. T., and Matthews, M. J. (2020). Process Optimization of Complex Geometries Using Feed Forward Control for Laser Powder Bed Fusion Additive Manufacturing. Additive Manufacturing 34, 101169. doi:10.1016/j.addma.2020.101169
Dryburgh, P., Patel, R., Pieris, D. M., Hirsch, M., Li, W., Sharples, S. D., Smith, R. J., Clare, A. T., and Clark, M. (2019). “Spatially Resolved Acoustic Spectroscopy for Texture Imaging in Powder Bed Fusion Nickel Superalloys,” in AIP Conf. Proc., Vermont, July 15–19, 2018 (American Institute of Physics Inc.), 020004. doi:10.1063/1.5099708
du Plessis, A., Broeckhoven, C., Yadroitsava, I., Yadroitsev, I., Hands, C. H., Kunju, R., et al. (2019). Beautiful and Functional: A Review of Biomimetic Design in Additive Manufacturing. Additive Manufacturing 27, 408–427. doi:10.1016/j.addma.2019.03.033
du Plessis, A., le Roux, S. G., Booysen, G., and Els, J. (2016). Directionality of Cavities and Porosity Formation in Powder-Bed Laser Additive Manufacturing of Metal Components Investigated Using X-Ray Tomography. 3D Printing and Additive Manufacturing 3, 48–55. doi:10.1089/3dp.2015.0034
du Plessis, A., and Macdonald, E. (2020). Hot Isostatic Pressing in Metal Additive Manufacturing: X-ray Tomography Reveals Details of Pore Closure. Additive Manufacturing 34, 101191. doi:10.1016/j.addma.2020.101191
du Plessis, A., Yadroitsava, I., and Yadroitsev, I. (2020). Effects of Defects on Mechanical Properties in Metal Additive Manufacturing: A Review Focusing on X-ray Tomography Insights. Mater. Des. 187, 108385. doi:10.1016/j.matdes.2019.108385
Duley, W. W., and Mao, Y. L. (1994). The Effect of Surface Condition on Acoustic Emission during Welding of Aluminium with CO2laser Radiation. J. Phys. D: Appl. Phys. 27, 1379–1383. doi:10.1088/0022-3727/27/7/007
Eschner, N., Weiser, L., Häfner, B., and Lanza, G. (2018). “Development of an Acoustic Process Monitoring System for the Selective Laser Melting (SLM),” in Solid Free (Austin, TX: Fabr. Symp.), 2097–2117.
Everton, S. K., Hirsch, M., Stravroulakis, P., Leach, R. K., and Clare, A. T. (2016). Review of In-Situ Process Monitoring and In-Situ Metrology for Metal Additive Manufacturing. Mater. Des. 95, 431–445. doi:10.1016/j.matdes.2016.01.099
Fisher, K., Candy, J., Guss, G., and Mathews, M. (2016). Evaluating Acoustic Emission Signals as an in Situ Process Monitoring Technique for Selective Laser Melting (SLM). (Livermore, CA: United States). doi:10.2172/1342013
Gaikwad, A., Yavari, R., Montazeri, M., Cole, K., Bian, L., and Rao, P. (2020). Toward the Digital Twin of Additive Manufacturing: Integrating thermal Simulations, Sensing, and Analytics to Detect Process Faults. IISE Trans. 52, 1204–1217. doi:10.1080/24725854.2019.1701753
Gaja, H., and Liou, F. (2017). Defects Monitoring of Laser Metal Deposition Using Acoustic Emission Sensor. Int. J. Adv. Manuf. Technol. 90, 561–574. doi:10.1007/s00170-016-9366-x
Gold, S. A., and Spears, T. G. (2018). Acoustic Monitoring Method for Additive Manufacturing Processes. Available at: https://patents.google.com/patent/US9989495B2/en?oq=US+9989495+B2 (Accessed December 1, 2020).
Grasso, M., and Colosimo, B. M. (2017). Process Defects Andin Situmonitoring Methods in Metal Powder Bed Fusion: a Review. Meas. Sci. Technol. 28, 044005. doi:10.1088/1361-6501/AA5C4F
Gu, D. D., Meiners, W., Wissenbach, K., and Poprawe, R. (2012). Laser Additive Manufacturing of Metallic Components: Materials, Processes and Mechanisms. Int. Mater. Rev. 57, 133–164. doi:10.1179/1743280411Y.0000000014
Gu, H., and Duley, W. W. (1994). “Acoustic Emission and Optimized CO2 Laser Welding of Steel Sheets,” in Int. Congr. Appl. Lasers Electro-Optics (Orlando, FL: Laser Institute of America), 77–85. doi:10.2351/1.5058866
Hall, L. D. (2016). WO2016198885A1 - Additive Manufacturing Apparatus and Method - Google Patents. Available at: https://patents.google.com/patent/WO2016198885A1/en (accessed June 17, 2020).
Kacaras, A., Bächle, M., Schwabe, M., Zanger, F., León, F. P., and Schulze, V. (2019). Acoustic Emission-Based Characterization of Focal Position during Ultra-short Pulse Laser Ablation. Proced. CIRP 81, 270–275. doi:10.1016/j.procir.2019.03.047
Koester, L. W., Taheri, H., Bigelow, T. A., Bond, L. J., and Faierson, E. J. (2018). “In-situ Acoustic Signature Monitoring in Additive Manufacturing Processes,” in AIP Conf. Proc., Provo, UT, July 16–21, 2017 (American Institute of Physics Inc.), 020006. doi:10.1063/1.5031503
Kuo, C. N., Chua, C. K., Peng, P. C., Chen, Y. W., Sing, S. L., Huang, S., et al. (2020). Microstructure Evolution and Mechanical Property Response via 3D Printing Parameter Development of Al-Sc alloy. Virtual Phys. Prototyping 15, 120–129. doi:10.1080/17452759.2019.1698967
Kyogoku, H., and Ikeshoji, T.-T. (2020). A Review of Metal Additive Manufacturing Technologies: Mechanism of Defects Formation and Simulation of Melting and Solidification Phenomena in Laser Powder Bed Fusion Process. Mech. Eng. Rev. 7, 19–00182. doi:10.1299/mer.19-00182
Lewandowski, J. J., and Seifi, M. (2016). Metal Additive Manufacturing: A Review of Mechanical Properties. Annu. Rev. Mater. Res. 46, 151–186. doi:10.1146/annurev-matsci-070115-032024
Lu, Q. Y., and Wong, C. H. (2018). Additive Manufacturing Process Monitoring and Control by Non-destructive Testing Techniques: Challenges and In-Process Monitoring. Virtual Phys. Prototyping 13, 39–48. doi:10.1080/17452759.2017.1351201
Lu, Q. Y., and Wong, C. H. (2017). Applications of Non-destructive Testing Techniques for post-process Control of Additively Manufactured Parts. Virtual Phys. Prototyping 12, 301–321. doi:10.1080/17452759.2017.1357319
Mao, Y. L., Kinsman, G., and Duley, W. W. (1993). Real‐Time Fast Fourier Transform Analysis of Acoustic Emission during CO2 Laser Welding of Materials. J. Laser Appl. 5, 17–22. doi:10.2351/1.4745326
Nakamura, S., Sakurai, M., Kamimuki, K., Inoue, T., and Ito, Y. (2000). Detection Technique for Transition between Deep Penetration Mode and Shallow Penetration Mode in CO2 laser Welding of Metals. J. Phys. D: Appl. Phys. 33, 2941–2948. doi:10.1088/0022-3727/33/22/311
Oliveira, J. P., LaLonde, A. D., and Ma, J. (2020). Processing Parameters in Laser Powder Bed Fusion Metal Additive Manufacturing. Mater. Des. 193, 108762. doi:10.1016/j.matdes.2020.108762
Pieris, D., Stratoudaki, T., Javadi, Y., Lukacs, P., Catchpole-Smith, S., Wilcox, P. D., et al. (2020). Laser Induced Phased Arrays (LIPA) to Detect Nested Features in Additively Manufactured Components. Mater. Des. 187, 108412. doi:10.1016/j.matdes.2019.108412
Redding, M. R., Gold, S. A., and Spears, T. G. (2017). US10073060B2 - Non-contact Acoustic Inspection Method for Additive Manufacturing Processes - Google Patents. Available at: https://patents.google.com/patent/US20170146489A1/en (Accessed January 1, 2021).
Rieder, H., Dillhöfer, A., Spies, M., Bamberg, J., and Hess, T. (2014). “Online Monitoring of Additive Manufacturing Processes Using Ultrasound,” in Proc. 11th Eur. Conf. Non-Destructive Test., Prague, Czech Republic, October 6–10, 2014, 2194–2201.
Schiry, M., Lamberti, C., Böhm, P., and Plapper, P. (2016). Acoustic-Emission-Analysis of Dissimilar Laser-Welds of Aluminium and Polyamide 6.6. UJMS 4, 119–124. doi:10.13189/ujms.2016.040601
Schmidt, M., Merklein, M., Bourell, D., Dimitrov, D., Hausotte, T., Wegener, K., et al. (2017). Laser Based Additive Manufacturing in Industry and Academia. CIRP Ann. 66, 561–583. doi:10.1016/j.cirp.2017.05.011
Seifi, M., Gorelik, M., Waller, J., Hrabe, N., Shamsaei, N., Daniewicz, S., et al. (2017). Progress towards Metal Additive Manufacturing Standardization to Support Qualification and Certification. JOM 69, 439–455. doi:10.1007/s11837-017-2265-2
Seifi, M., Salem, A., Beuth, J., Harrysson, O., and Lewandowski, J. J. (2016). Overview of Materials Qualification Needs for Metal Additive Manufacturing. JOM 68, 747–764. doi:10.1007/s11837-015-1810-0
Shevchik, S. A., Kenel, C., Leinenbach, C., and Wasmer, K. (2018). Acoustic Emission for In Situ Quality Monitoring in Additive Manufacturing Using Spectral Convolutional Neural Networks. Additive Manufacturing 21, 598–604. doi:10.1016/j.addma.2017.11.012
Smith, R. J., Hirsch, M., Patel, R., Li, W., Clare, A. T., and Sharples, S. D. (2016). Spatially Resolved Acoustic Spectroscopy for Selective Laser Melting. J. Mater. Process. Technol. 236, 93–102. doi:10.1016/j.jmatprotec.2016.05.005
Spears, T. G., and Gold, S. A. (2016). In-process Sensing in Selective Laser Melting (SLM) Additive Manufacturing. Integr. Mater. Manuf. Innov. 5, 16–40. doi:10.1186/s40192-016-0045-4
Stepanova, K., Kinzhagulov, I., and Yakovlev, Y. (2019). Application of Acoustic Emission and Laser Optoacoustics at Various Stages of Defect Formation during Friction Stir Welding - IOPscience. J. Phys. Conf. Ser. IOP Publ. 1421, 012022. doi:10.1088/1742-6596/1421/1/012022Available at: https://iopscience.iop.org/article/10.1088/1742-6596/1421/1/012022 (accessed March 31, 2020).
Strantza, M., Van Hemelrijck, D., Guillaume, P., and Aggelis, D. G. (2017). Acoustic Emission Monitoring of Crack Propagation in Additively Manufactured and Conventional Titanium Components. Mech. Res. Commun. 84, 8–13. doi:10.1016/j.mechrescom.2017.05.009
Taheri Andani, M., Dehghani, R., Karamooz-Ravari, M. R., Mirzaeifar, R., and Ni, J. (2018). A Study on the Effect of Energy Input on Spatter Particles Creation during Selective Laser Melting Process. Additive Manufacturing 20, 33–43. doi:10.1016/j.addma.2017.12.009
Taheri, H., Koester, L. W., Bigelow, T. A., Faierson, E. J., and Bond, L. J. (2019). In Situ additive Manufacturing Process Monitoring with an Acoustic Technique: Clustering Performance Evaluation Using K-Means Algorithm. J. Manuf. Sci. Eng. Trans. ASME. 141, 1. doi:10.1115/1.4042786
Tapia, G., and Elwany, A. (2014). A Review on Process Monitoring and Control in Metal-Based Additive Manufacturing. J. Manuf. Sci. Eng. Trans. ASME. 136, 060801. doi:10.1115/1.4028540
Tran, H.-C., and Lo, Y.-L. (2019). Systematic Approach for Determining Optimal Processing Parameters to Produce Parts with High Density in Selective Laser Melting Process. Int. J. Adv. Manuf. Technol. 105, 4443–4460. doi:10.1007/s00170-019-04517-0
Wang, D., Wu, S., Fu, F., Mai, S., Yang, Y., Liu, Y., et al. (2017). Mechanisms and Characteristics of Spatter Generation in SLM Processing and its Effect on the Properties. Mater. Des. 117, 121–130. doi:10.1016/j.matdes.2016.12.060
Wasmer, K., Kenel, C., Leinenbach, C., and Shevchik, S. A. (2018). “In Situ and Real-Time Monitoring of Powder-Bed AM by Combining Acoustic Emission and Artificial Intelligence,” in International Conference on Additive Manufacturing in Products and Applications, Zurich, Switzerland, September 13–15, 2017 (Springer International Publishing), 200–209. doi:10.1007/978-3-319-66866-6_20
Wasmer, K., Le-Quang, T., Meylan, B., and Shevchik, S. A. (2019). In Situ Quality Monitoring in AM Using Acoustic Emission: A Reinforcement Learning Approach. J. Materi Eng. Perform. 28, 666–672. doi:10.1007/s11665-018-3690-2
Williams, J., Dryburgh, P., Clare, A., Rao, P., and Samal, A. (2018). Defect Detection and Monitoring in Metal Additive Manufactured Parts through Deep Learning of Spatially Resolved Acoustic Spectroscopy Signals. Smart Sustain. Manuf. Syst. 2, 20180035. doi:10.1520/ssms20180035
Wu, H., Yu, Z., and Wang, Y. (2016). “A New Approach for Online Monitoring of Additive Manufacturing Based on Acoustic Emission,” in ASME 2016 11th International Manufacturing Science and Engineering Conference, Blacksburg, VA, June 27–July 1, 2016. doi:10.1115/msec2016-8551
Wu, H., Yu, Z., and Wang, Y. (2019). Experimental Study of the Process Failure Diagnosis in Additive Manufacturing Based on Acoustic Emission. Measurement 136, 445–453. doi:10.1016/j.measurement.2018.12.067
Wu, J., Zhao, J., Qiao, H., Sun, B., and Lu, Y. (2020). A New Acoustic Emission On-Line Monitoring Method of Laser Shock Peening. Optik 205, 163578. doi:10.1016/j.ijleo.2019.163578
Yadroitsava, I., Els, J., Booysen, G., and Yadroitsev, I. (2015). Peculiarities of Single Track Formation from TI6Al4V alloy at Different Laser Power Densities by Selective Laser Melting. Sajie 26, 86–95. doi:10.7166/26-3-1185
Yadroitsev, I., Krakhmalev, P., Yadroitsava, I., and Du Plessis, A. (2018). Qualification of Ti6Al4V ELI Alloy Produced by Laser Powder Bed Fusion for Biomedical Applications. JOM 70, 372–377. doi:10.1007/s11837-017-2655-5
Yadroitsev, I. (2009). Selective Laser Melting : Direct Manufacturing of 3D-Objects by Selective Laser Melting of Metal Powders. Saarbrücken: Book[WorldCat.org]LAP Lambert Academic Publ.
Yadroitsev, I., and Smurov, I. (2011). Surface Morphology in Selective Laser Melting of Metal Powders. Phys. Proced. 12. Elsevier, 264–270. doi:10.1016/j.phpro.2011.03.034
Ye, D., Hong, G. S., Zhang, Y., Zhu, K., and Fuh, J. Y. H. (2018). Defect Detection in Selective Laser Melting Technology by Acoustic Signals with Deep Belief Networks. Int. J. Adv. Manuf. Technol. 96, 2791–2801. doi:10.1007/s00170-018-1728-0
Ye, D., Zhang, Y., Zhu, K., Hong, G., and Ying, J. (2017). “Characterization of Acoustic Signals during a Direct Metal Laser Sintering Process,” in Int. Conf. Energy Equip. Sci. Eng. II, (ICEESE 2016), Guangzhou, China, November 12–14, 2016. Editors S. Zhou, A. Patty, and S. Chen (Guangzhou, China: CRC Press), 1315–1320. doi:10.1201/9781315116174-89
Keywords: process monitoring, balling effect, acoustic emission, additive manufacturing, laser powder bed fusion
Citation: Kouprianoff D, Yadroitsava I, du Plessis A, Luwes N and Yadroitsev I (2021) Monitoring of Laser Powder Bed Fusion by Acoustic Emission: Investigation of Single Tracks and Layers. Front. Mech. Eng 7:678076. doi: 10.3389/fmech.2021.678076
Received: 08 March 2021; Accepted: 10 June 2021;
Published: 22 June 2021.
Edited by:
Filippo Berto, Norwegian University of Science and Technology, NorwayReviewed by:
Hao Yi, Chongqing University, ChinaSabrina Vantadori, Università Politecnica delle Marche, Italy
Sara Bagherifard, Politecnico di Milano, Italy
Copyright © 2021 Kouprianoff, Yadroitsava, du Plessis, Luwes and Yadroitsev. This is an open-access article distributed under the terms of the Creative Commons Attribution License (CC BY). The use, distribution or reproduction in other forums is permitted, provided the original author(s) and the copyright owner(s) are credited and that the original publication in this journal is cited, in accordance with accepted academic practice. No use, distribution or reproduction is permitted which does not comply with these terms.
*Correspondence: A. du Plessis, YW50b24yQHN1bi5hYy56YQ==