 Sebastian Friedrich
 Brunero Cappella
94% of researchers rate our articles as excellent or good
Learn more about the work of our research integrity team to safeguard the quality of each article we publish.
Find out more
ORIGINAL RESEARCH article
Front. Mech. Eng., 15 September 2021
Sec. Tribology
Volume 7 - 2021 | https://doi.org/10.3389/fmech.2021.672898
This article is part of the Research TopicTribology and Atomic Force Microscopy – Towards Single Asperity ContactView all 6 articles
When compliant samples such as polymer films are scanned with an atomic force microscope (AFM) in contact mode, a periodic ripple pattern can be induced on the sample. In the present paper, friction and mechanical properties of such ripple structures on films of polystyrene (PS) and poly-n-(butyl methacrylate) (PnBMA) are investigated. Force volume measurements allow a quantitative analysis of the elastic moduli with nanometer resolution, showing a contrast in mechanical response between bundles and troughs. Additionally, analysis of the lateral cantilever deflection when scanning on pre-machined ripples shows a clear correlation between friction and the sample topography. Those results support the theory of crack propagation and the formation of voids as a mechanism responsible for the formation of ripples. This paper also shows the limits of the presented measuring methods for soft, compliant, and small structures. Special care must be taken to ensure that the analysis is not affected by artefacts.
When scanning in contact mode, the tip of an atomic force microscope (AFM) permanently indents the sample if the stiffness of the sample is lower than the stiffness of the cantilever. On polymer films, such deformation may engender permanent wear patterns in the form of ripples (or bundles), which are often oriented almost perpendicularly to the fast scan direction (Leung and Goh, 1992). AFM-scan-induced ripples have been observed on films of polystyrene (PS) (Leung and Goh, 1992), polyethylene terephthalate (PET) (D’Acunto et al., 2007), poly-ε-caprolactone (PCL) (D’Acunto et al., 2007), polyvinyl acetate (PVA) (Schmidt et al., 2003a), and polycarbonate (PC) (Sun et al., 2012; Yan et al., 2014; Wang et al., 2020). The influence of numerous experimental parameters on the ripple structure has been extensively investigated. A review of experimental observations, theoretical models, and approaches to control ripple formation can be found in D’Acunto et al. (2015).
It was found that amplitude (height difference between peak and trough) and wavelength (lateral distance between two successive peaks) of the ripples increase with force, temperature, and number of scans (Schmidt et al., 2003a; Gotsmann et al., 2006; Wang et al., 2020). The dependence on tip velocity is more complex (Wang et al., 2020). The wavelength of the emerging ripples on a polycarbonate surface decreases with increasing velocity up to a threshold value of 100 μm/s, above which it starts to increase. The amplitude increases with increasing velocity, with a drop at the threshold value of 100 μm/s. The change in velocity dependence above this threshold is explained by a variation of Young’s modulus with the strain rate. A method to enhance the formation of ripples is enrichment of the polymer with a solvent (D’Acunto et al., 2007; Napolitano et al., 2012; Leach et al., 2003). The solvent acts as a plasticizer, so the enrichment has an effect which is similar to an increase in temperature. In experiments with PET, it enabled the formation of a very regular ripple pattern with a single scan at low load. There is a critical molecular weight Mc, above which polymer chains are entangled. On polymers with a molecular weight below Mc only abrasion of the polymer is observed. Above Mc, molecules cannot be removed, but only locally displaced, which enables the formation of ripples (Meyers et al., 1992; Sun et al., 2013). For PS, a well-ordered ripple structure could be achieved with a molecular weight of 250 kDa, while no ripples were observed with 1.3 and 13 kDa (Sun et al., 2013). In most studies, relatively low normal loads up to a few hundred nN were employed. However, it was shown that homogeneous ripple structures could be achieved on PC even through single scans with high loads of several µN (Yan et al., 2012).
Another important parameter in the fabrication of ripples is the spacing between successive scan lines, called feed. Wavelength and amplitude decrease with increasing feed (Wang et al., 2020). There is a threshold value of the feed, above which ripples are not formed (Yan et al., 2012). This value is always smaller than the contact radius. This means that the tip must interact at least twice with the same area on the polymer to obtain a periodic ripple structure. For non-rotational symmetric tips, the scratching angle was also found to be a decisive factor in the ripple formation (Wang et al., 2020). In this context, the tip trajectory plays a role as well. If trace and retrace run in parallel, the obtained ripple structure was more homogenous than the one obtained with a triangular trajectory. Scanning in only one direction (and lifting the tip up during the backwards motion) was shown to yield no ripple structure in an experiment on polycarbonate (Yan et al., 2012).
Several theoretical models were suggested to explain the formation of ripples, but the underlying mechanism is still not fully understood. Abrasion patterns on rubber were first described by Schallamach (Schallamach, 1971). Schallamach waves occur when rubber, moved in contact with a solid substrate, does not slide but actually moves through “waves of detachment.” AFM-scan-induced ripples have been considered as Schallamach waves (Meyers et al., 1992), although forces and contact areas are not comparable to those described by Schallamach. Schallamach waves enable the propagation of tunnels of air across the contact plane, so they must be small compared to the contact area. Additionally, the rubber sample usually relaxes back to its original state with a smooth surface once shear forces are removed. Since this is in contrast to the observed properties of AFM-scan-induced ripples, the theory of Schallamach waves is not appropriate to explain the phenomenon (Schmidt et al., 2003b). A more promising approach is the mechanism of crack propagation in front of the tip (Elkaakour et al., 1994). Polymer piles up in front of the tip during its motion, and once a critical tangential force is reached, the tip is supposed to slip over the polymer bundle. The formation of cracks or voids inside the polymer bundles implies an increase of the total volume and a lower stiffness of the ripples compared to the unperturbed polymer film. A volume increase was indeed observed (Iwata et al., 2000). The stiffness was examined using the ultrasonic force microscopy AFM-mode, in which the sample was vibrated at a frequency of 2 MHz, which is much higher than the resonance frequency of the cantilever, and an amplitude of less than 1 nm (Iwata et al., 2000). The cantilever vibrational response depends sensitively on tip-sample contact stiffness. It was found that the stiffness of the ripple structures was lower than that of the unperturbed surroundings. However, the quantitative analysis of the measurements is very limited, and the contact stiffness can be estimated only roughly.
A suitable method to measure quantitatively mechanical properties and adhesion of samples is the recording of force distance curves (FDCs) and force volumes, i.e., regular arrays of FDCs with a defined spacing (Cappella and Dietler, 1999; Butt et al., 2005). This paper reports for the first time an analysis of AFM-scan-induced polymer ripples through a force volume. Such a measurement yields robust quantitative results with a high spatial resolution to verify the hypothesis of formation of voids in polymer ripples.
In Wang et al. (2020), a theoretical model accounting for friction forces between tip and sample was developed. The friction increases during the formation process of a bundle. Once it reaches a critical value, the tip slips over the bundle. The formation mechanism of the bundles is therefore assumed to be a stick-slip process. Experiments on polycarbonate measuring the friction force during the machining process through the lateral cantilever deflection were performed and support this theory.
The friction of pre-machined ripples was subject to investigation in Schmidt et al. (2003a). The friction force was measured by scanning a polymer surface after ripples had been machined. Two different coefficients of friction were found in the patterned region. Yet, they could not be clearly correlated to the topography or its gradient. The lower friction coefficient matches the coefficient of the unperturbed region. The authors explained the higher one by a lowering of the glass transition temperature caused by the generation of voids in the bundles, making the bundles more rubbery. Based on the friction of the patterned region, a “generalized” stick-slip mechanism involving a continuous change of friction force instead of an instantaneous jump from stick to slip behavior is assumed. It should be kept in mind that these two factors engendering and explaining ripple formation, i.e. crack propagation and stick-slip, are not mutually exclusive; rather, they are likely to both play a role at the same time.
The issue that the higher friction could not be clearly assigned to the peaks in the topography in Schmidt et al. (2003a) is addressed in the present paper. Friction measurements are performed on pre-machined ripples with a significantly better resolution than in Schmidt et al. (2003a). In our measurements, a clear correlation between the friction force and the topography can be observed in certain cases.
Measurements are conducted on two polymers spin-coated on glass substrates: polystyrene (PS), which is in a glassy state at room temperature, and poly-n-(butyl methacrylate) (PnBMA), which is in the transition from glassy to rubbery state and therefore less stiff, as its glass transition temperature is close to room temperature.
Polystyrene (PS, average molecular weight Mw ≅ 280,000) and poly-n-(butyl methacrylate) (PnBMA, Mw ≅ 337,000) were purchased from Sigma Aldrich (St. Louis, United States). The polymers were dissolved in toluene and then spin-coated on glass cover slips, previously cleaned and rinsed with toluene. The resulting PS film is 762 ± 10 nm thick and the PnBMA film is 634 ± 7 nm thick.
Measurements were performed with a Cypher AFM (Asylum Research, Oxford Instruments, Santa Barbara, United States). PPP-FMAuD cantilevers (kc ≅ 3 N/m) with silicon tips from Nanosensors (NanoWorld, Neuchatel, Switzerland) were used for all measurements except friction scans on PnBMA, for which a PPP-CONTSCAuD (kc ≅ 0.2 N/m) cantilever was used because a lower cantilever stiffness was required.
Ripples were produced by scanning a polymer film in contact mode. The scan lines were parallel to each other, with the movement in slow scan direction taking place, as usually, only between two successive scan lines. Tapping mode was utilized to image the ripples without further modifying the structure. Table 1 shows the parameters (normal force F and tip velocity v) used to produce the ripples for force volume and friction measurements, as well as the scan size.
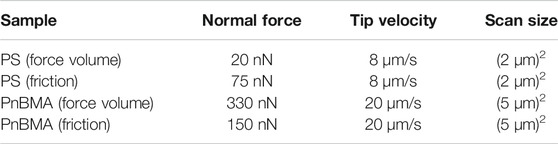
TABLE 1. Normal force, tip velocity, and scan size used to produce ripples for the force volume and friction measurements on PS and PMMA.
Ripples were characterized by recording a force volume, i.e., an array of FDCs on an area including ripples as well as a portion of the unperturbed film. Before this measurement, the sensitivity of the cantilever was calibrated by recording an FDC on a stiff sample. Afterwards, the spring constant of the cantilever was calibrated using the thermal noise spectrum (Hutter and Bechhoefer, 1993). The shape of the tip was determined by scanning in tapping mode a TGT1 test grid (NT-MDT Spectrum Instruments, Moscow, Russia), which consists of an array of sharp tips. The resulting image is a replica of the AFM tip (Villarrubia, 1997; Dongmo et al., 2000).
Four quantities are calculated from the force volume data. First, the topography, i.e. the piezo extension at the trigger point, at which the direction of Z-movement is reversed. Second, the stiffness, defined as ks/(kc+ks), with kc and ks being the spring constants of the cantilever and the sample (Bonaccurso et al., 2006). This is a rough approximation in the case of small deformations, for which the sample is modelled as an ideal spring, i.e. as having a fixed elastic constant, which does depend, in particular, neither on load nor on deformation. Third, the elastic modulus Es, calculated from the linear fit of the sample deformation D3/2 as a function of the cantilever deflection δc. It is assumed that sample and tip are respectively a plane and a hemisphere or a paraboloid and that sample deformation is described by Hertz theory (Bonaccurso et al., 2006; Cappella and Kaliappan, 2006; Silbernagl and Cappella, 2010; Cappella, 2011; Cappella, 2016):
with the cantilever spring constant kc and the tip radius R. Etot is the reduced elastic modulus, and
with νs and νt being Poisson’s ratios of sample and tip, and Es and Et being the elastic moduli of sample and tip. Poisson’s ratio of both PnBMA and PS is assumed to be 0.33. If Es<< Et, the modulus Es can be calculated as
The elastic modulus was calculated from the initial part of the contact line, immediately after contact had been established (from Z = 0 to ca. 20 nm). At such low forces, the deformation is not affected by viscoelastic phenomena (Cappella et al., 2005). Finally, the adhesion force is the minimum of the retraction curve.
The friction was measured by scanning pre-machined ripples in contact mode with a significantly reduced force to minimize further modifications of the surface structures. The measurement of friction with means of an AFM (Munz, 2010) implies the detection of the torque T or of the lateral force Fx, proportional to the twist angle Δϕ or to the lateral displacement Δx via the torsional elastic constants kϕ or kx, respectively. A quantitative measurement of the lateral force involves two calibrations: first the calibration of the lateral signal of the four-quadrants-photodiode, ΔVL, to convert it into Δϕ (or Δx) via the lateral sensitivity Sϕ (or Sx), and second the calibration of kϕ (or kx), yielding the torque T (or the force Fx). This is analogous to the measurement of the normal force, requiring the calibration of the vertical signal ΔVz to convert it into the deflection δc via the vertical sensitivity Sz and the calibration of the normal spring constant kc yielding the normal force FN.
Yet, while the determination of Sz is a straightforward procedure implying just the measurement of cantilever deflection on a very stiff, not deformable sample, there is no well-defined lateral movement or twist allowing a precise determination of Sϕ or Sx. Therefore, despite a plethora of calibration methods, the reliable quantitative measurement of friction through AFM is still a challenging issue.
When the friction is measured with the tip sliding on the surface, as for the measurements reported here, the torsion due to the local angle θ of the sample surface must be considered. In this case, the difference of the lateral signals measured during trace and retrace (width of the friction loop) is given by (Ogletree et al., 1996):
where α is a combination of the lateral sensitivity and the torsional spring constant, µ the friction coefficient and FA the adhesion force. Hence, for a symmetric tip, the width of the friction loop does not depend on the sign of θ.
On a flat surface, Eq. 4 reduces to:
Measuring the lateral signal on a sample with a defined local angle and fitting the data with Eq. 4 is the most common calibration method, called “wedge-method.” Yet, polymer surfaces are very compliant and deformable, so that the local angle during scanning is not known and, on the other side, even the wedge-method is not universally accepted. Therefore, no calibration of the torsion was performed, also because, for the present work, the comparison of friction on an unmodified surface and on the ripples, i.e. highlighting of a contrast, is much more significant than the quantitative measurement of a particular friction coefficient.
Figure 1 shows tapping mode scans of ripples machined in contact mode on PnBMA (left) and PS (right). Parameters used for ripples production are listed in Table 1. The ripples on PnBMA have a peak-to-peak amplitude A = 19 ± 5 nm and a wavelength λ = 385 ± 49 nm. They are oriented by an angle of ca. 60° to the scanning direction. On PS, the ripples are narrower, with A = 16 ± 3 nm and λ = 192 ± 25 nm. Except for the first few scan lines, they are oriented perpendicularly to the scanning direction.
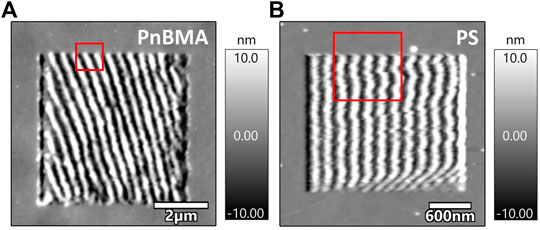
FIGURE 1. Tapping mode scans of ripple structures on (A) PnBMA and (B) PS. The red squares denote the (1 µm)2 area where a force volume was recorded.
To measure the adhesion and mechanical properties of the ripple structures, force volumes were recorded. For both polymers, an area of (1 µm)2 at the upper boundary of the structure was chosen containing both ripples and unperturbed polymer. Those areas are denoted by a red square in Figure 1. Here, a force volume with 50 × 50 curves, i.e. with a lateral resolution of 20 nm, was recorded. The maximum force of the curves was 58 nN on PnBMA and 210 nN on PS. The results are presented in Figure 2, with PnBMA on the left and PS on the right side. The maps show (Figure 2A) the topography, (Figure 2B) the stiffness, (Figure 2C) the elastic modulus (for PnBMA only), and (Figure 2D) the adhesion force. The stripe pattern on PS was caused by scanning alternately from left to right and from right to left. This was avoided on PnBMA.
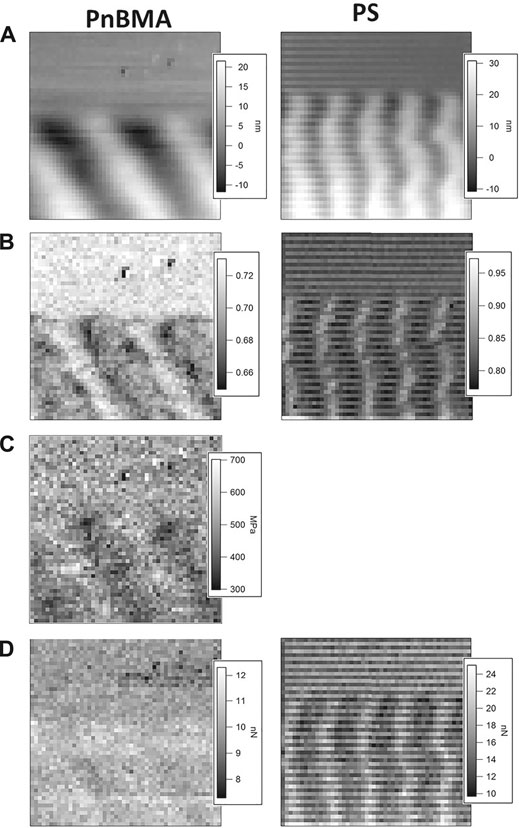
FIGURE 2. Force volume maps, consisting of 50 × 50 force-distance curves on an area of (1 µm)2 on PnBMA (left) and PS (right): (A) topography, (B) stiffness, (C) elastic modulus (for PnBMA only), and (D) adhesion force.
Both stiffness maps in Figure 2B show a pattern similar to the ripples in the topography. To test whether there is a clear correlation between stiffness and height, data from single scan lines are compared in Figure 3. Looking at the data for PnBMA in Figure 3A, it can be seen that the minimum stiffness is reached exactly at the peak of the bundles, and the maximum at the troughs. From Figure 2B, it can be seen that the maximum stiffness in the troughs is equal to the stiffness of the unperturbed polymer film. This means that the stiffness is changed only on the bundles, on which it is reduced to 0.69 ± 0.01, while the stiffness in the troughs remains unchanged by the machining process, with a value of 0.72 ± 0.01. The map of the elastic modulus in Figure 2C shows a similar result for PnBMA, with E ≈ 550 MPa on the unperturbed film and in the troughs, and E ≈ 450 MPa on the bundles. To show the size ratio between the scanning tip and the bundle structure, the profile of the tip was added to the graphs in Figure 3. For PnBMA, the bundle structure is much wider than the tip, so the sample can be assumed as a plane and an influence of the sample topography on the contact area and on the elastic deformation can be excluded. Both calculations of the stiffness and of the elastic modulus are based on the assumptions of the geometry of tip and sample. Since these are valid for the present measurement, it can be concluded that the sample topography does not affect the determination of these two quantities. This assumption is confirmed by the adhesion map in Figure 2D. A larger contact area would yield a higher adhesion force [Cappella, 2016, p. 83]. On the contrary, the data show almost no variation of the adhesion force and no correlation at all with the topography. This proves that the above results for PnBMA are not affected by artefacts due to the topography and represent a valid analysis of its mechanical properties.

FIGURE 3. Exemplary profile lines of height (blue, left axis) and stiffness (red, right axis) on ripples on (A) PnBMA and (B) PS. Additionally, the profile of the tip (grey) is drawn in the graphs to show the proportions. Since, on PS, the gradient angle of the surface topography is almost as large as the opening angle of the tip, the phase shift between height and stiffness can be considered an artefact.
For PS, however, there is a phase shift between the height and stiffness data, as shown in Figure 3B. The maximum stiffness of 0.85 ± 0.02 is reached at the left side of the bundle, while a minimum of 0.81 ± 0.01 is attained at the right side. However, the phase shift between height and stiffness on PS is most probably an artefact, caused by the smaller wavelength of the ripples. For PS, the gradient angle of the surface topography approaches the opening angle of the tip. The narrower the ripples are, the more it becomes likely that the side of the tip touches the flank of the ripples when recording a force distance curve. Therefore, because of the inclination angle and asymmetry of the tip, the contact area and the calculated stiffness are larger on the left side of the bundles compared to the right side. This is illustrated by drawing the tip both on the right side (dark gray) and on the left side (light gray) of a bundle in Figure 3B, which shows a larger contact on the left side. Accordingly, the adhesion force measured on the left side is larger, as shown in Figure 2D. Because of the narrow ripples, a valid analysis of mechanical properties using Hertz theory is not possible on PS, other than on PnBMA. Therefore, the elastic modulus has not been calculated for PS.
The measurements of mechanical properties and adhesion contribute to the understanding of the mechanisms leading to the formation of ripples. The lower stiffness and elastic modulus on the bundles imply a lower density of polymer chains in such agglomerations, which can be due both to loosening of polymer chains and to the presence of voids. The stiffness and the elastic modulus in the troughs, however, are the same as on the unperturbed polymer film, which implies that the polymer density remains unchanged here. In this context, care must be taken to ensure that the ripple wavelength is large enough to exclude an effect of the topography on the calculation of the stiffness via the contact radius. Otherwise, the data will be affected by an artefact, as observed for PS in the present study. In addition to the change in stiffness, the volume compared to the unperturbed film is increased by 0.0322 µm³ for PnBMA and 0.0807 µm³ for PS. Such a volume increase is in accordance with literature (Iwata et al., 2000). These results strongly support the theory of crack propagation and the presence of voids in the bundles (Elkaakour et al., 1994).
Another method to characterize ripple structures is measuring the friction force. Similar to the force volume measurements shown in Figure 2, the measurements were conducted on an area containing both ripples and unperturbed polymer surface. The lateral signal is calculated as half the difference between the lateral trace and retrace signals. As the lateral signal depends on the friction force and on the topography gradient (see Eq. 4), it is plotted against the gradient angle (given by
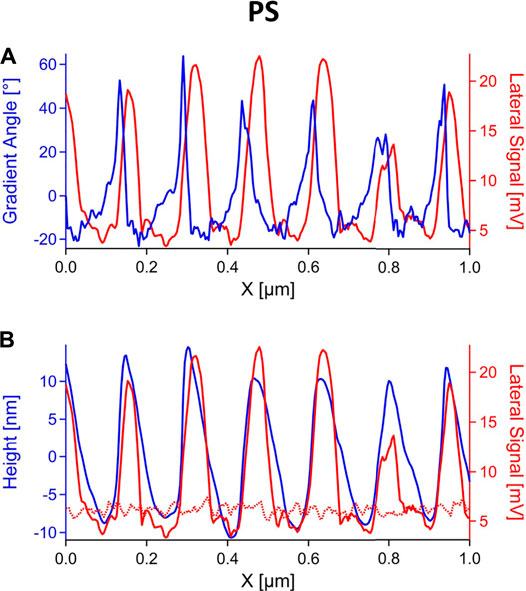
FIGURE 4. Single profile lines of the lateral signal (half difference between trace and retrace) on PS ripples (continuous red line) and unperturbed film (dotted red line), plotted together with (A) the gradient angle and (B) the height (blue).
On the softer PnBMA ripples, friction measurements were more difficult to perform than on PS. Scanning on ripples with the same force (F = 15 nN) as in the experiments with PS resulted in the formation of smaller ripples on top of the original ripple structure. Therefore, cantilevers with a much smaller spring constant were used for friction experiments on PnBMA. Ripples were scanned with F = 5 nN and v = 4 μm/s to measure the friction. The lateral signal, together with the topography gradient angle and the height signal, are shown in Figures 5A,B, respectively. The lateral signal does not correlate with the topography gradient angle, but unlike on PS, it does not correlate with the height signal either. The friction increases only at the left side of the bundles, while on the remaining parts of the ripple structure it remains the same as on the unperturbed polymer surface. The lack of correlation is probably caused by the high compliance of the polymer, which leads to significant deformations and to changes of the contact area during the scanning. Additionally, the ripple structures on PnBMA are not as temporarily stable as they are on a glassy polymer. A decrease of their amplitude was observed in consecutive measurements. This shows that, at room temperature, PnBMA chains have enough energy to relax between the machining of the ripples and the friction measurement, thereby reducing a possible contrast in friction.
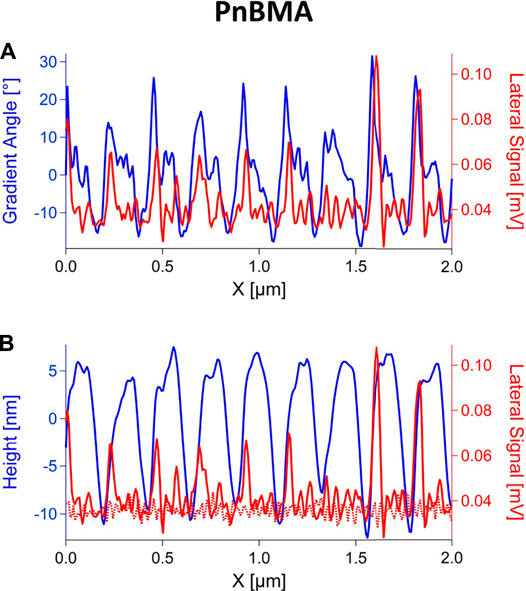
FIGURE 5. Single profile lines of the lateral signal (half difference between trace and retrace) on PnBMA ripples (continuous red line) and unperturbed film (dotted red line), plotted together with (A) the gradient angle and (B) the height (blue).
The friction measurements support the interpretation of the force volume measurements. Like in Schmidt et al. (2003a), two friction regimes were found on the ripples, with one corresponding to the response of the unperturbed film, and the other one being higher. However, in the present study, a clear correlation between topography and stiffness was observed, which contrasts with Schmidt et al. (2003a). The reason for this new result might be the larger amplitude and wavelength of the ripples, as well as the higher lateral measurement resolution in the present study. Just like the stiffness, the friction is changed only on the bundles, and remains unchanged in the troughs. The friction increase again implies that the bundles are aggregations of polymer chains, which are more lose than the original surface and filled with voids. The structure of the polymers in the troughs, however, is not affected, but stays the same as in the unperturbed film.
It is important to note that the present study also shows the limits of both force volume and friction measurements on polymer ripples. On such compliant, soft and small structures, those techniques are susceptible to artefacts, mainly due to deformation and changes of the contact area. While a force volume analysis requires ripples to be significantly wider than the tip, friction measurements yield meaningful contrasts only on a glassy polymer.
Measurements of Young’s modulus and friction on PS and PnBMA have shown a correlation with the topography of ripple structures. On the bundles, the modulus is reduced, and the friction is increased. Combined with an overall volume increase compared to the unperturbed polymer film, those findings are a strong hint at a lowered polymer density in the bundles, due to loosening of polymer chains and/or to the presence of voids. In the latter case, our results support the theory of crack propagation as an underlying mechanism for the ripple formation. In the troughs, however, both modulus and friction remain unchanged compared to the unperturbed film. Therefore, it can be concluded that the polymer structure is changed only in the bundles.
Two kinds of artefacts were observed in our experiments, and care must be taken to avoid them when using the described measurement methods. Firstly, force volume measurements were proved to be a valuable method to quantitatively access mechanical properties of ripple structures. However, a reliable analysis using elastic continuum theories is only possible if the ripples are significantly wider than the tip, so that the sample can be always assumed as a plane indented by a hemisphere or a paraboloid and the contact area is not affected by the topography. Secondly, the measurement of friction through the torsion of the cantilever only makes sense if the sample is not too compliant, i.e., when the polymer is in its glassy state. Otherwise, the polymer is significantly deformed by scanning in contact mode, even with low forces.
The raw data supporting the conclusions of this article will be made available by the authors, without undue reservation.
SF contributed to the conceptualization of the study, performed the experiments, contributed to the analysis and wrote the first draft of the article. BC contributed to the conceptualization of the study and to the analysis and wrote sections of the article. All authors contributed to manuscript revision, read, and approved the submitted version.
The authors declare that the research was conducted in the absence of any commercial or financial relationships that could be construed as a potential conflict of interest.
All claims expressed in this article are solely those of the authors and do not necessarily represent those of their affiliated organizations, or those of the publisher, the editors and the reviewers. Any product that may be evaluated in this article, or claim that may be made by its manufacturer, is not guaranteed or endorsed by the publisher.
Bonaccurso, E., Cappella, B., and Graf, K. (2006). Local Mechanical Properties of Plasma Treated Polystyrene Surfaces. J. Phys. Chem. B 110, 17918–17924. doi:10.1021/jp062602w
Butt, H.-J., Cappella, B., and Kappl, M. (2005). Force Measurements with the Atomic Force Microscope: Technique, Interpretation and Applications. Surf. Sci. Rep. 59, 1–152. doi:10.1016/j.surfrep.2005.08.003
Cappella, B. (2011). Mechanical Properties and Adhesion of a Micro Structured Polymer Blend. Polymers, 3, 1091–1106. doi:10.3390/polym3031091
Cappella, B. (2016). Mechanical Properties of Polymers Measured through AFM Force-Distance Curves. Berlin: Springer. 978-3-319-29459-9.
Cappella, B., and Dietler, G. (1999). Force-Distance Curves by Atomic Force Microscopy. Surf. Sci. Rep. 34, 1–104. doi:10.1016/S0167-5729(99)00003-5
Cappella, B., and Kaliappan, S. K. (2006). Determination of Thermomechanical Properties of a Model Polymer Blend. Macromolecules 39, 9243–9252. doi:10.1021/ma061896g
Cappella, B., Kaliappan, S. K., and Sturm, H. (2005). Using AFM Force−Distance Curves to Study the Glass-To-Rubber Transition of Amorphous Polymers and Their Elastic−Plastic Properties as a Function of Temperature. Macromolecules 38, 1874–1881. doi:10.1021/ma040135f
D’Acunto, M., Dinelli, F., and Pingue, P. (2015). Nanoscale Rippling on Polymer Surfaces Induced by AFM Manipulation. Beilstein J. Nanotechnol. 6, 2278–2289. doi:10.3762/bjnano.6.234
D’Acunto, M., Napolitano, S., Pingue, P., Giusti, P., and Rolla, P. (2007). Fast Formation of Ripples Induced by AFM. A New Method for Patterning Polymers on Nanoscale. Mater. Lett. 61, 3305–3309. doi:10.1016/j.matlet.2006.11.067
Dongmo, L. S., Villarrubia, J. S., Jones, S. N., Renegar, T. B., Postek, M. T., and Song, J. F. (2000). Experimental Test of Blind Tip Reconstruction for Scanning Probe Microscopy. Ultramicroscopy, 85, 141–153. doi:10.1016/S0304-3991(00)00051-6
Elkaakour, Z., Aimé, J. P., Bouhacina, T., Odin, C., and Masuda, T. (1994). Bundle Formation of Polymers with an Atomic Force Microscope in Contact Mode: A Friction versus Peeling Process. Phys. Rev. Lett. 73, 3231–3234. doi:10.1103/PhysRevLett.73.3231
Gotsmann, B., Duerig, U. T., Sills, S., Frommer, J., and Hawker, C. J. (2006). Controlling Nanowear in a Polymer by Confining Segmental Relaxation. Nano Lett. 6, 296–300. doi:10.1021/nl0520563
Hutter, J. L., and Bechhoefer, J. (1993). Calibration of Atomic‐force Microscope Tips. Rev. Scientific Instr. 64, 1868–1873. doi:10.1063/1.1143970
Iwata, F., Matsumoto, T., and Sasaki, A. (2000). Local Elasticity Imaging of Nano Bundle Structure of Polycarbonate Surface Using Atomic Force Microscopy. Nanotechnology 11, 10–15. doi:10.1088/0957-4484/11/1/303
Leach, R. N., Stevens, F., Seiler, C., Langford, S. C., and Dickinson, J. T. (2003). Nanometer-Scale Solvent-Assisted Modification of Polymer Surfaces Using the Atomic Force Microscope. Langmuir 19, 10225–10232. doi:10.1021/la035289n
Leung, O. M., and Goh, M. C. (1992). Orientational Ordering of Polymers by Atomic Force Microscope Tip-Surface Interaction. Science 255, 64–66. doi:10.1126/science.255.5040.64
Meyers, G. F., Dekoven, B. M., and Seitz, J. T. (1992). Is the Molecular Surface of Polystyrene Really Glassy? Langmuir 8, 2330–2335. doi:10.1021/la00045a042
Munz, M. (2010). Force Calibration in Lateral Force Microscopy: A Review of the Experimental Methods. J. Phys. D: Appl. Phys. 43, 063001. doi:10.1088/0022-3727/43/6/063001
Napolitano, S., D’Acunto, M., Baschieri, P., Gnecco, E., and Pingue, P. (2012). Ordered Rippling of Polymer Surfaces by Nanolithography: Influence of Scan Pattern and Boundary Effects. Nanotechnology 23, 475301. doi:10.1088/0957-4484/23/47/475301
Ogletree, D. F., Carpick, R. W., and Salmeron, M. (1996). Calibration of Frictional Forces in Atomic Force Microscopy. Rev. Scientific Instr. 67, 3298–3306. doi:10.1063/1.1147411
Schmidt, R. H., Haugstad, G., and Gladfelter, W. L. (2003a). Scan-induced Patterning and the Glass Transition in Polymer Films: Temperature and Rate Dependence of Plastic Deformation at the Nanometer Length Scale. Langmuir 19, 10390–10398. doi:10.1021/la0348564
Schmidt, R. H., Haugstad, G., and Gladfelter, W. L. (2003b). Scan-induced Patterning in Glassy Polymer Films: Using Scanning Force Microscopy to Study Plastic Deformation at the Nanometer Length Scale. Langmuir 19, 898–909. doi:10.1021/la015769j
Silbernagl, D., and Cappella, B. (2010). Mechanical Properties of Thin Polymer Films on Stiff Substrates. Scanning 32, 282–293. doi:10.1002/sca.20196
Sun, Y., Yan, Y., Hu, Z., Zhao, X., and Yan, J. (2012). 3D Polymer Nanostructures Fabrication by AFM Tip-Based Single Scanning with a Harder Cantilever. Tribology Int. 47, 44–49. doi:10.1016/j.triboint.2011.10.018
Sun, Y., Yan, Y., Liang, Y., Hu, Z., Zhao, X., Sun, T., et al. (2013). Effect of the Molecular Weight on Deformation States of the Polystyrene Film by AFM Single Scanning. Scanning 35, 308–315. doi:10.1002/sca.21069
Villarrubia, J. S. (1997). Algorithms for Scanned Probe Microscope Image Simulation, Surface Reconstruction, and Tip Estimation. J. Res. Natl. Inst. Stand. Technol. 102, 425–454. doi:10.6028/jres.102.030
Wang, J., Yan, Y., Chang, S., Wang, T., Geng, Y., and Gan, Y. (2020). Study of the Formation Mechanism of Bundle Structures Using AFM Tip-Based Nanoscratching Approach. Tribology Int. 142, 106000. doi:10.1016/j.triboint.2019.106000
Yan, Y., Sun, Y., Li, J., Hu, Z., and Zhao, X. (2014). Controlled Nanodot Fabrication by Rippling Polycarbonate Surface Using an AFM Diamond Tip. Nanoscale Res. Lett. 9, 372. doi:10.1186/1556-276X-9-372
Keywords: AFM, polymer, ripples, mechanical properties, friction
Citation: Friedrich S and Cappella B (2021) Friction and Mechanical Properties of AFM-Scan-Induced Ripples in Polymer Films. Front. Mech. Eng 7:672898. doi: 10.3389/fmech.2021.672898
Received: 26 February 2021; Accepted: 03 September 2021;
Published: 15 September 2021.
Edited by:
Yu Tian, Tsinghua University, ChinaReviewed by:
Hyun-Joon Kim, Kyungpook National University, South KoreaCopyright © 2021 Friedrich and Cappella. This is an open-access article distributed under the terms of the Creative Commons Attribution License (CC BY). The use, distribution or reproduction in other forums is permitted, provided the original author(s) and the copyright owner(s) are credited and that the original publication in this journal is cited, in accordance with accepted academic practice. No use, distribution or reproduction is permitted which does not comply with these terms.
*Correspondence: Sebastian Friedrich, c2ViYXN0aWFuLmZyaWVkcmljaEBiYW0uZGU=
Disclaimer: All claims expressed in this article are solely those of the authors and do not necessarily represent those of their affiliated organizations, or those of the publisher, the editors and the reviewers. Any product that may be evaluated in this article or claim that may be made by its manufacturer is not guaranteed or endorsed by the publisher.
Research integrity at Frontiers
Learn more about the work of our research integrity team to safeguard the quality of each article we publish.