 Leonie Saccardi
 Jonas Schiebl2
 Stanislav Gorb
94% of researchers rate our articles as excellent or good
Learn more about the work of our research integrity team to safeguard the quality of each article we publish.
Find out more
ORIGINAL RESEARCH article
Front. Mech. Eng. , 07 May 2021
Sec. Tribology
Volume 7 - 2021 | https://doi.org/10.3389/fmech.2021.660517
This article is part of the Research Topic Bioadhesion View all 14 articles
Propolis is a sticky substance used by bees to seal their hive and protect the colony against pathogens. Its main components are plant resins, beeswax, essential oils, pollen, and other organic substances. The chemical and medicinal properties of propolis have been extensively studied, but little is known about its physical and especially adhesive properties. To gain a better understanding of propolis and its potential for adhesive applications, we performed several experiments, including adhesion tests with propolis in different conditions and on various substrates, differential scanning calorimetry analysis, and compression tests. Propolis shows clear viscoelastic behavior and temperature-dependent mechanical properties. Our results demonstrate that propolis adheres well to a wide range of substrates from glass to PTFE, but also enables stronger adhesion at higher temperatures and longer contact times. Even underwater, in wet conditions, quite a substantial adhesion was measured. The data are interpreted from a biomechanical point of view, and the significance of the obtained results for bee biology is discussed.
Propolis is a sticky and ductile material that is produced by honeybees (Apis mellifera), mixing plant resins, wax, and other substances. Because of its strong adhesive nature, propolis is sometimes referred to as bee glue (Bankova et al., 2000; Bankova, 2005). Honeybees mainly forage resins from plant buds, but also have been reported to collect resin from tree barks and fruit surfaces (Alfonsus, 1933; Kumazawa et al., 2008; Simone-Finstrom and Spivak, 2010). Bees selectively choose what plants to acquire resin from (Isidorov et al., 2016). In Europe and North America poplars are believed to be the main source of resin for propolis (Greenaway et al., 1990; Bankova et al., 2000; Isidorov et al., 2016). Other plant sources for propolis production in temperate regions are aspen and birch (Isidorov et al., 2016). Since the contents of bud resins differ immensely between different plant species (Bankova, 2005), propolis contents and therefore properties are highly variable. In general, propolis consists of about 50% resin, 30% wax, 10% essential and aromatic oils, 5% pollen, and 5% of various other organic substances (Monti et al., 1983; Cirasino et al., 1987; Burdock, 1998). Meanwhile, more than 300 chemical components have been identified in propolis (Huang et al., 2014). The main constituents are phenolic compounds, such as flavonoids, aromatic acids and their esters (Bankova et al., 2000). Additionally, propolis contains phenolic aldehydes, ketones, terpenes, sugars, hydrocarbons, mineral elements, and enzymes (Bankova et al., 2000; Anjum et al., 2018).
Bees use propolis as a building material, for example to seal cracks and smooth out the internal walls of the hive (Burdock, 1998; Bankova et al., 2000). In addition to its mechanical functions, propolis has important chemical and bio-medical properties that protect the colony and contribute to social immunity (Simone-Finstrom and Spivak, 2010). Propolis possesses antibacterial, antifungal, antiviral, anti-inflammatory and hepatoprotective, antioxidant and antitumor properties (Anjum et al., 2018). Due to its pharmacological properties, propolis has been used by humans for multiple purposes (e.g., treating wounds or preserving corpses) throughout history (Ghisalberti, 1979; Anjum et al., 2018), and it still has manifold applications in medicine and cosmetics today (Burdock, 1998; Huang et al., 2014; Anjum et al., 2018).
Chemical and especially bio-medical properties of propolis have been studied extensively (Burdock, 1998; Cornara et al., 2017; Anjum et al., 2018), but little research has been done to understand its physico-chemical properties. A better understanding of the material properties of propolis could help biologists to understand how bees maintain such a sticky material. Beyond that, there is a strong potential for propolis applications in adhesive technology, as modern adhesive bonding technology is continuously searching for optimized environment-friendly adhesive solutions (Popov et al., 2017). Because of its pharmacological properties in addition to its stickiness, propolis might even be useful as a medical adhesive. Furthermore, knowledge about adhesive behavior of propolis on various surfaces could be used for developing anti-adhesive coatings.
The objective of this work was to characterize propolis mechanics, adhesion and other physico-chemical properties in order to ascertain whether the material might have other areas of application apart from its known medical uses.
The raw propolis was provided by private beekeeper Dr. Oliver Schwarz (Stuttgart, Germany) (Figure 1A). Samples were harvested from beehives in autumn 2017 and spring 2018 by scraping the inside of hives, frames, and lids. Harvested propolis was stored outside in an unsealed container until summer 2018. To get consistent samples, the propolis chunks were frozen to −20°C, finely ground using a pre-cooled mortar and pestle, mixed, and subsequently stored at −20°C (Figure 1B). The pulverizing procedure was based on the method that was previously used to produce propolis extract (Bankova et al., 2016). To prevent contamination, propolis was only handled wearing gloves cleaned with ethanol (Rotipuran® ≥ 99.8%, p.a., Carl Roth GmbH & Co. KG, Karlsruhe, Germany).
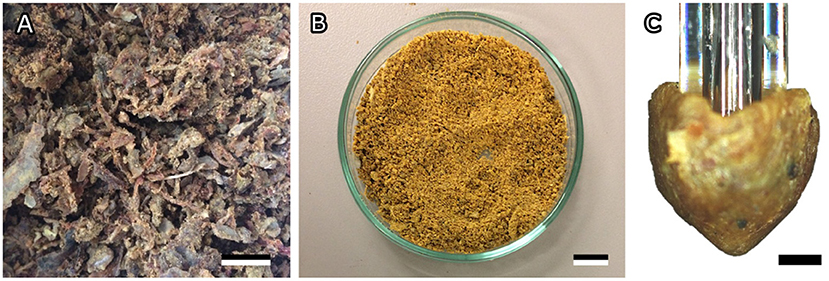
Figure 1. Bee propolis. (A) Raw propolis as collected from the hive. (B) Homogenized propolis powder. (C) Cone-shaped propolis sample used for adhesion tests. Scale bar: 1 cm (A,B), 500 μm (C).
Homogenized and kneaded propolis samples were weighed with a balance (AG204 DeltaRange®, Mettler-Toledo, Columbus, USA). The volume of the propolis sample was determined by measuring the volume of water it displaced in a 50 ml measuring cylinder. The samples density was then calculated by dividing the weight by the volume. Three samples were tested independently.
The thermal properties of propolis were studied using differential scanning calorimetry (DSC) (DSC 8500, Perkin Elmer, Waltham, USA). Aluminum pans and covers were used for sample preparation and closed manually bending the edges with tweezers. Raw propolis pieces of two harvests (Spring: 5.7 mg and Autumn: 6.8 mg) were analyzed separately. During the first heating cycle, propolis was heated from −50 to 60°C at 20 K/min. The temperature in the chamber was held for 1 min, then rapidly cooled down to −50°C at 200 K/min and held there for 4 min before continuing. For the second cycle, the sample was heated to 70°C at 20 K/min. Homogenized and kneaded propolis samples was also heated in a water bath, in order to observe melting behavior. Three samples were tested independently.
Stress-strain curves were recorded during compression tests with propolis using a universal testing machine (Autograph AG-X plus, Shimadzu, Kyoto, Japan). Homogenized propolis was kneaded and subsequently filled into a flexible mold to be formed into propolis disks (6.5 mm high, 12.5 mm diameter). To ensure parallel and even surfaces on top and at the bottom of the disc, the discwas pressed between two smooth glass slides held apart by 6.5 mm high spacers on each side. In order to prevent the sample sticking to the compression plates, a piece of cling film was layered underneath and on top of the propolis disc. The sample was continuously loaded to a compression of 1% (engineering strain) and then unloaded. This process was repeated on the same sample for compressions of 5, 10, 20, and 30%, in order to see what degree of compression leads to elastic and which to plastic deformation. Measurements were carried out at different temperatures (4, 23, and 40°C), while applying and removing the load with a constant velocity of 4 mm/min, to examine the effect of temperature on elastic properties of propolis. The temperature was varied by cooling the sample and compression plate in the fridge, or heating it in an oven. Additional measurements were performed at different velocities (1, 2, and 4 mm/min) at a constant temperature of 23°C, in order to analyze the viscous behavior of propolis. Three samples were tested for each combination of temperatures and velocities. Stress-strain curves were generated to obtain information about the mechanical properties of propolis.
Homogenized and manually formed propolis samples were weighed continuously over a period of 7 h using an ultra-microbalance (Sartorius® Cubis MSE2.7S, Sartorius AG, Göttingen, Germany). The lid of a reaction tube was cut off and weighed empty. For each measurement, there were three small propolis spheres, each weighing 40–50 mg, placed on the lid. These samples were weighed at intervals of 10 s for 7 h at 24°C and 45 % relative humidity (RH) (P330 temperature-humidity measuring instrument, Dostmann electronic GmbH, Wertheim-Reicholzheim, Germany). Three samples, each consisting of three propolis spheres, were weighed separately.
Adhesion of propolis was tested on a clean, smooth glass surface. Just before each adhesion experiment, a small amount of homogenized propolis powder was defrosted and kneaded into a homogeneous mass. Cone-shaped propolis samples with a spherical tip were subsequently formed by hand wearing ethanol-cleaned gloves (Figure 1C and Supplementary Figure 2A). The topography of the sample was analyzed using a fast scanning 3D measurement microscope (Keyence VR 3100; Keyence Corporation, Osaka, Japan). The profile of the sample was measured in five positions arranged in a star shape through the highest point of the tip. To estimate the radius at the sample tip, a circle was fitted to the sample's profiles in five different orientations (Figure 2C). The circle's radii were measured and then averaged.
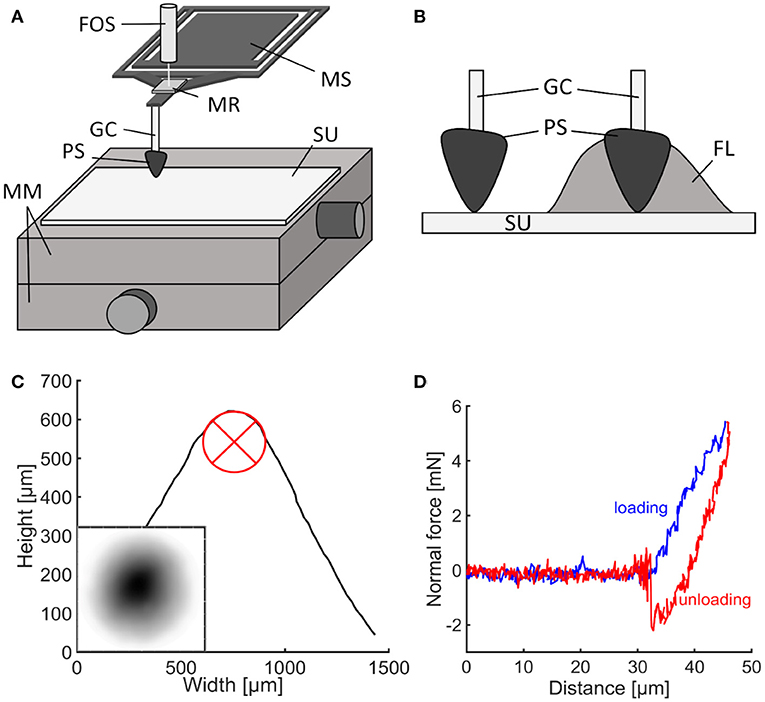
Figure 2. Adhesion experiments. (A) Experimental set-up for adhesion testing with Basalt-01 mechanical tester (Tetra GmbH). (B) Propolis contact in presence of fluid and without fluid. (C) 3D-profile of the propolis sample. The circle was used to measure the tip radius. The small subimage depicts the sample's topography, with darker areas depicted higher than lighter areas. (D) Typical force-distance curve obtained from adhesion experiments. FL, fluid droplet; FOS, fiber optical sensor; GC, glass capillary; MM, 2D-micro-manipulators; MR, mirror; MS, metal spring; PS, propolis sample; SU, substrate.
The effective elastic modulus and the pull-off force of propolis were measured with a microforce measurement device [Basalt-BT01; Tetra GmbH, Ilmenau, Germany (Gorb and Scherge, 2000; Jiao et al., 2000; Gorb et al., 2004)]. The device consists of micromanipulators as a platform holding the substrate material, a metal spring (springs with spring constants of 618 and 539 N/m were used) and a fiber-optical sensor (Figure 2A). The piezo-drive moves the sensor with the spring down for loading and up for unloading the sample. A shortened glass capillary (5 μl micropipette Blaubrand® Intra END, BRAND GMBH + CO KG, Wertheim, Germany) was attached to the metal spring with cyanoacrylate glue.
The freshly formed, cone-shaped sample of propolis was then mounted on the tip of the capillary without any additional glue. A glass slide (Standard microscopy slides (soda lime glass); Carl Roth GmbH + Co. KG, Karlsruhe, Germany) was cleaned with ethanol and distilled water. After drying out, the glass slide was fixed to the micromanipulator platform with double-sided adhesive tape to be used as substrate for subsequent adhesion tests (Article number 05338-00000-01, Tesa®, Norderstedt, Germany). The propolis sample was brought into contact with the substrate and retracted from the surface as soon as the load force reached 5 mN. The load was chosen to resemble the load applied by bees when handling propolis. As no studies exist on mandibular forces and pressures of honeybees, pressures previously measured at the tip of mandibles of predacious Coleoptera (Wheater and Evans, 1989) were used as a reference for the load applied to the propolis sample. Tip pressures were calculated as suggested by Wheater and Evans (1989):
where Fa is the applied force and A is the contact area obtained from the contact radius.
On each propolis sample a set of 11 single measurements was performed, each on a different spot of the reference glass surface (N = 8 propolis samples, n = 11 measurements per sample). The last measurement of each set was carried out with a 60 s contact delay after loading and before unloading the sample to test the viscous properties of propolis. Experiments were carried out at room temperature (24.00 ± 0.53°C) and a relative humidity of 36.80 ± 9.01%. After the adhesion experiments, the substrate material was examined under a binocular microscope (Leica M205 A) in order to find possible propolis residues/prints in the contact area. Additional abbreviated reference measurements on glass (five repetitions) were performed with propolis samples used for tests on various other substrates described below.
Some of the test conditions, described above for the reference measurements, were varied to prove whether they have an effect on propolis adhesion. First, repeated measurements were performed on the same spot. Second, measurements without prolonged contact time were performed to estimate the deformation of the sample tip after short contact measurements. Third, several measurements were carried out in fluid conditions, with a drop of distilled water (H2O) or oil (Mineral oil, light, Sigma-Aldrich, St. Louis, USA) being placed on the substrate (Figure 2B). Fourth, to study the influence of temperature on propolis adhesion, measurements were conducted at a higher room temperature, i.e., of 26°C. For each condition, 50–60 single measurements were performed (N = 5–6 propolis samples, n = 10 measurements per sample). Last, the experiments with an extended contact time of 60 s were performed to study the effect of contact time on adhesion. These experiments were performed in the last step of reference measurements on glass (N = 50 propolis samples, n = 1 measurement per sample).
Various technical materials were used as substrates for subsequent adhesion experiments. A polytetrafluoroethylene (PTFE) plate (Technische Materialien Katarzyna Kowalewska, Görlitz, Germany) and a steel plate (EN 1.4016, Abrams Premium Stahl®, Osnabrück, Germany) were polished using a polishing machine (Minitech 233; Presi, Eybens, France) with alumina oxide suspensions using polishing papers with descending particle sizes (12, 3, 1, and 0.3 μm) to achieve similar and minimal surface roughness for all substrates (Supplementary Figure 1). They were cleaned with ethanol and distilled water and dried prior to usage in the experiments. A resin replica of a smooth, clean glass surface was prepared by a two-step molding method (Gorb, 2007; Koch et al., 2008). The negative template of the glass slide was produced using a two-component dental wax (Affinis light body, ISO 4823, polyvinylsiloxane, Coltène Whaledent AG, Altstätten, Switzerland) and filled with resin (Spurr's low viscosity kit, Plano, Wetzlar, Germany) that was subsequently polymerized at 70°C for 48 h. This resin substrate will be further referred to as ”Spurr.”
Tests on these technical substrate materials were performed as described for the reference glass substrate. After 10 measurements on the substrate material, five additional reference measurements were carried out on glass. For each technical substrate material, 50–60 single measurements on different sites were performed (N = 5–6 propolis samples, n = 10 measurements on substrate per sample).
The contact angles of water, diiodomethane, and ethylene glycol on the reference glass surface, as well as of the PTFE, steel and Spurr substrates were measured according to the sessile drop method (2 μl drop volume) using an optical contact angle measuring system (OCAH200, DataPhysics Instruments GmbH, Filderstadt, Germany). For each substrate, 5–10 contact angle measurements were conducted for each liquid. The substrate's surface free energy and its dispersive and polar components were calculated according to the method by Owens and Wendt (1969).
The substrate's surface roughness was measured by a confocal 3D laser scanning microscope (Keyence VK-X250; Keyence Corporation, Osaka, Japan). The corresponding Multi File Analyzer software (Version 1.2.6.106, Keyence Corporation, Osaka, Japan) was used to obtain the following roughness parameters: arithmetical mean height of the surface (Sa), maximum height of the surface (Sz), texture aspect ratio of the surface (Str), arithmetic mean peak curvature (Spc), and developed area ratio (Sdr).
Additionally, for surface examination, standard light microscopy (Leica M205 A, Leica Microsystems Inc., Wetzlar, Germany) and 3D surface profilometry (Keyence VR 3100, Neu-Isenburg, Germany) were used.
Adhesion experiments were evaluated using Matlab (version R2015b, The MathWorks, Inc., Natick, USA). The unloading part of force-distance curves (Figure 2D) acquired from adhesion experiments was fitted according to the JKR theory (Johnson et al., 1971) (Supplementary Figure 2B).
where a is the contact radius, Fa is the applied load, R is the tip radius, E and Δγ are the effective elastic modulus and the work of adhesion, respectively.
The work of adhesion Δγ is the energy per unit of area needed to separate two bodies in contact. It was chosen as a measure of adhesion, because it is independent of the contact area. Work of adhesion (Δγ) was estimated from the unloading curve:
where F is the pull-off force and R is the tip radius.
To characterize viscoelastic properties of propolis, a generalized Maxwell model was used (Christensen, 1982). The sample's viscosity was estimated from experimental force curves using the following equation (Cheng et al., 2005; Kovalev et al., 2018):
where d is the displacement, t is the time under load, E∞/E1/E2 and η1/η2 are the Young's moduli and viscosities of the static and two dynamic components, correspondingly ν is the Poisson ratio assumed to be equal to 0.49 (Kovalev et al., 2018).
The data were statistically analyzed using the software R, version 3.6.1 (The R Foundation for Statistical Computing, 2019). Data was tested for normal distribution and variance homogeneity using Kolmogorov-Smirnov and Levene's tests, respectively. The comparison of propolis adhesion under different conditions and on different substrates was performed with a one-way ANOVA and a pairwise multiple comparison procedure (Tukey test). An unpaired two-sample t-test was performed to compare the mean Young's modulus of propolis at 24 and 26°C. Correlation analysis of Young's modulus and work of adhesion obtained from adhesion experiments was performed by calculating the Pearson's correlation coefficient.
Homogenized and kneaded pieces of propolis were weighed. Subsequently, the volume of weighed pieces was determined by measuring the volume of water it displaced. The propolis sample did not dissolve or absorb water during the experiment. The density of propolis was calculated to be 0.953 ± 0.001 g/cm3 (N = 3).
When heating propolis in a water bath to 60–70°C, its separation into two phases was observed (N = 3). A phase resembling beeswax melted and turned into a transparent fluid with a yellow tint, while the other phase remained more viscous and dark brown. After once being heated to between 50 and 60°C, cooled down propolis components turned hard at room temperature and did not return to their original malleable state.
A DSC analysis of raw, unhomogenized propolis harvested in spring and autumn was performed to further investigate thermal properties of propolis. During the heating cycles, the variation of the heat flow as a function of the temperature revealed endothermic phase transitions at 54–55°C and 64°C (Figure 3A). No distinct differences between the samples from different harvests were found.
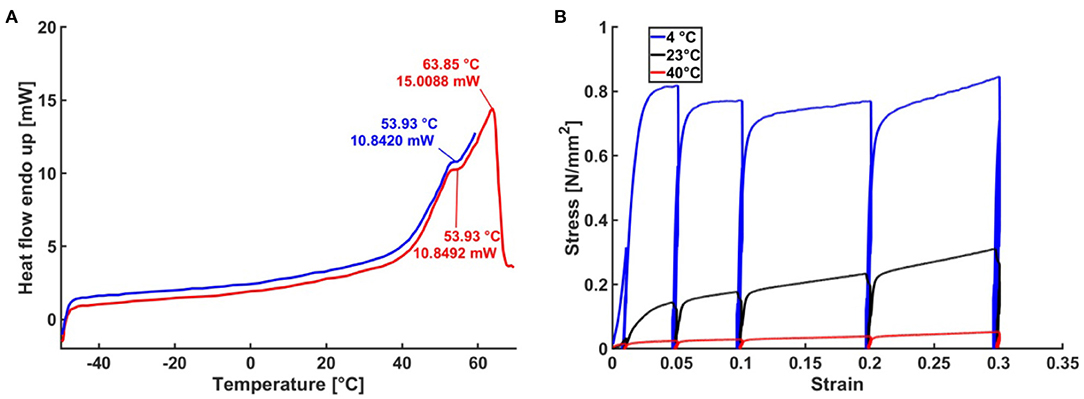
Figure 3. Thermal properties of propolis. (A) DSC analysis of propolis. (B) Stress-strain curves obtained from compression tests with propolis at different temperatures.
The hardness of propolis changed depending on temperature. It is hard and brittle at temperatures below 10°C, allowing it to be broken or ground to a fine powder. At room temperature, propolisis is malleable and tacky. When the temperature rises above room temperature, propolis becomes increasingly softer and tackier. These changes were reflected in stress-strain curves obtained from compression tests (Figure 3B, N = 3). Compared to tests performed at 23°C, ~4 times higher stresses were necessary at 4°C to achieve the same strain. Furthermore, at 40°C for the same strain the stresses were roughly 10 times lower than that at 23°C. In compression tests, performed at 20–800 kPa stress and temperature 4–40°C, visco-plastic deformation of propolis was observed.
A hardened outer layer formed on propolis samples stored at room temperature for several hours, though the inside of the propolis samples remained softer. To characterize the process of volatile components evaporations, the weight of the propolis samples was measured over time. On average, the samples lost 0.9 ± 0.3% (N = 3) in mass over a period of seven hours at room temperature of 24°C (Figure 4).
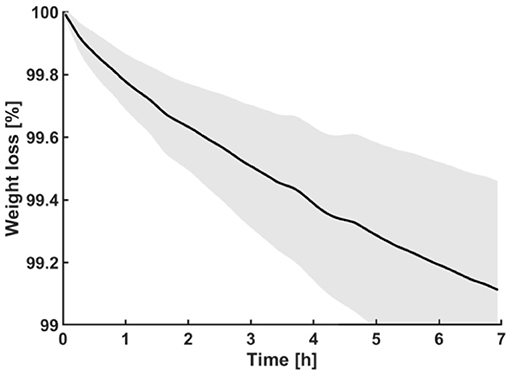
Figure 4. Display of weighing experiments performed on propolis. The curve shows the mean weight of the samples (N = 3) over time. The gray area represents standard deviations at corresponding time points of measurement.
Cone-shaped propolis samples that were used for adhesion experiments had a mean tip radius of 182.08 ± 55.18 μm (N = 135) (Figure 2C). The samples were brought into contact with different substrates at a mean applied normal force of 5.2 ± 0.7 mN. The contact radius at maximum load was calculated to be 36.06 ± 17.14 μm, using Equation (3). Mean pressure at the propolis sample was calculated to be 1.85 MPa. At a room temperature of 24°C, propolis samples had a mean Young's modulus of 11.23 ± 6.77 MPa (N = 45). Compared to measurements at 24°C, a 2°C increase in temperature resulted in a significantly lower elastic modulus of 6.55 ± 4.89 MPa (N = 10, P = 0.044). In adhesion experiments, performed with propolis on a glass surface, the mean pull-off force was 2.12 ± 0.77 mN and the mean work of adhesion was calculated to be 2.96 ± 1.27 J/m2 using Equation (3). According to Pearson's correlation test, Young's modulus and work of adhesion of propolis are anti-correlated (r = −0.999, p < 0.01). The mode of failure during experiments was adhesive, since examination of the substrate surfaces after adhesion experiments using light microscope showed no propolis residues in the contact area. 3D surface profilometry of the sample's tip before and after the experiment also showed no shape change and therefore no plastic deformation occurred during testing at short contact times. However, at a contact time of 60 s, samples clearly exhibited viscoplastic deformation, since the tip area was considerably flattened.
Propolis adhesion was subsequently measured on a glass surface under different conditions and compared by performing a one-way ANOVA (Figure 5A, Table 1). The P-value was found to be smaller than the significance level of 0.01. Therefore, a post-hoc Tukey test was conducted to find pairwise differences. P-values smaller than 0.05 were considered significant. The work of adhesion of propolis did not depend (1) on the contact area and (2) on whether the measurements were repeatedly done at the same location or each measurement was done at new location (3.08 ± 0.79 J/m2, P = 0.9998).
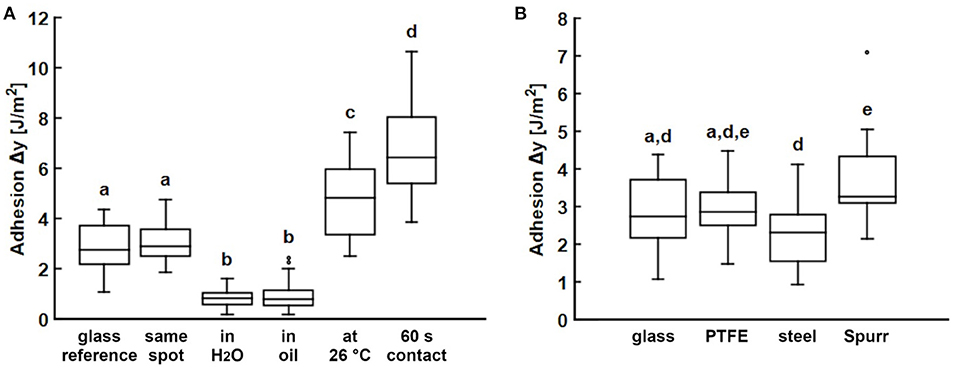
Figure 5. Propolis adhesion. (A) Adhesion of propolis on glass under various conditions. (B) Adhesion of propolis on different substrates. Experiments were conducted using Basalt-1 mechanical tester (Tetra GmbH, Ilmenau, Germany). If not stated differently, tests were carried out at room temperature (24°C) with a set loading force of 5 mN and with every individual measurement performed on a different location on the substrate (N = 5–6 propolis samples per condition or substrate, n = 10 individual measurements per sample). Box plots show the median value (line), the ends of the boxes define the 25 and 75th percentiles, and the error bars the 10 and 90th percentiles. The outliers are shown as black dots. Conditions and substrates marked with different letters differ significantly from each other (one-way ANOVA, P < 0.001 and Tukey test, P < 0.05).
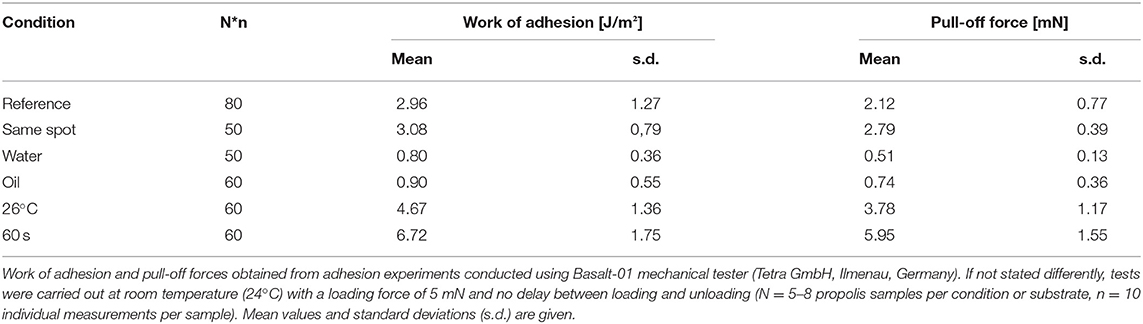
Table 1. Propolis adhesion in different conditions.
Propolis adhesion in oil and water was measured. Propolis adhered to glass, even underwater and in oil, however, the work of adhesion measured (0.86 ± 0.47 J/m2) was significantly lower than that in the dry condition (P < 0.0001). No significant difference between the work of adhesion in water and in oil was found (P= 1.0). Raising the temperature from 24 to 26°C, the work of adhesion of propolis increased significantly to 4.67 ± 1.36 J/m2 (P < 0.0001). Some experiments performed at 26°C were abandoned due to cohesive failure and plastic deformation of the propolis sample after a few single measurements. Significantly higher work of adhesion of 6.72 ± 1.75 J/m2 also occurred, when increasing the contact time at maximum load to 60 s (P < 0.0001).
As stated above, elongated contact times led to plastic deformation of the propolis samples and to a decrease of the load force overtime due to material relaxation (N = 50). The force-time curve was fitted with the exponential function (Bankova et al., 2000) with either one or two exponents in the 60 s contact regime (Figure 6A). Table 2 shows the fit parameters for one representative force-time curve. For all measurements a better fit was achieved with two exponents. In compression tests, propolis behaved differently depending on the velocity the load was applied with. At higher velocities, higher stresses had to be applied to achieve the same strain (Figure 6B). No elastic deformation occurred in compression tests performed using a universal testing machine.
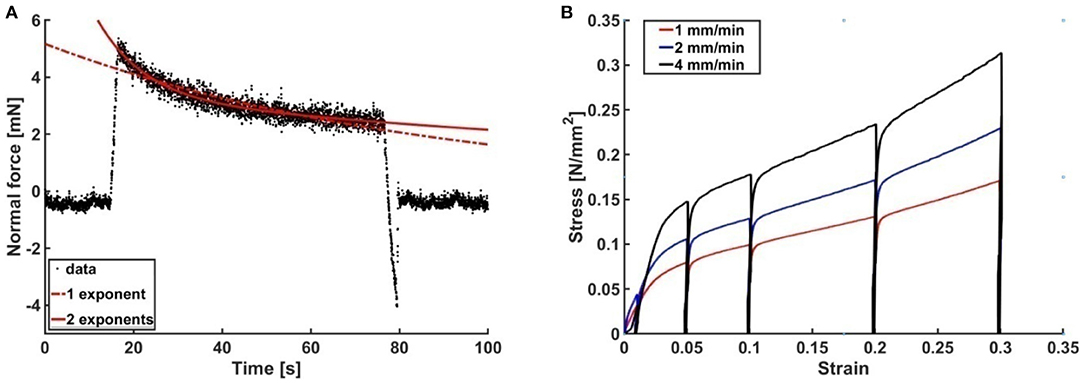
Figure 6. Viscoelasticity of propolis. (A) Typical force-time curve obtained from adhesion tests with propolis on glass with a 60 s delay between loading and unloading. (B) Stress-strain curves obtained from compression tests with propolis at different velocities (1, 2, and 4 mm/min).
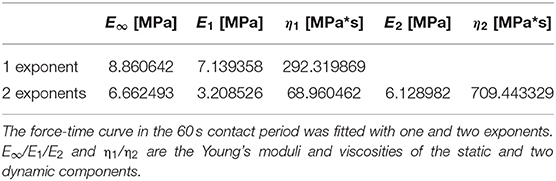
Table 2. Fit parameters to estimate the viscoelasticity of a representative propolis sample using the Equation (4).
To test the effect of substrate materials on propolis adhesion, adhesion tests were performed with several substrates: PTFE, steel, and Spurr's resin with different surface free energies. All tested substrates were smooth with an arithmetical mean height of the surface (Sa) between 0.034 and 0.042 μm (Supplementary Table 1), though their surface energies differed (Supplementary Table 2). PTFE had the lowest surface energy of 16.7 mJ/m2, then Spurr with 28.08 mJ/m2, and steel with 37.92 mJ/m2, while glass had the highest surface energy of 58.25 mJ/m2 among the tested materials. Despite the different surface energies, the work of adhesion obtained from adhesion experiments with propolis was similar for all tested substrate materials and ranged between 2.29 and 3.61 J/m2 (Figure 5B, Table 3). The highest work of adhesion was measured for Spurr epoxy resin, the lowest on steel. Statistically significant differences were only revealed for work of adhesion between glass and Spurr (P = 0.0049), as well as between steel and Spurr (P = 0.0004).
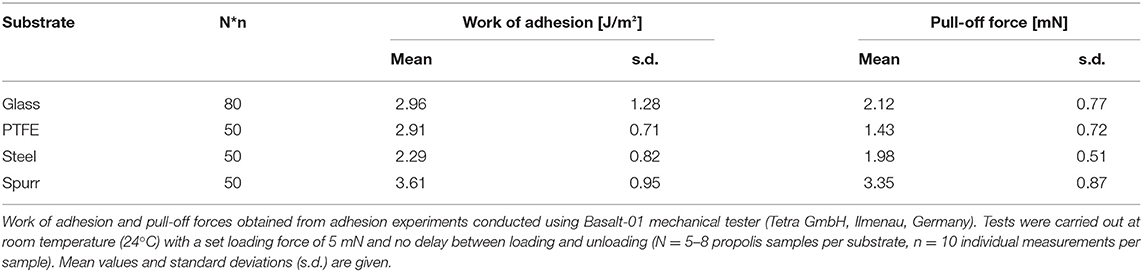
Table 3. Propolis adhesion on different substrates.
Chemical composition and medicinal use of propolis have previously been studied (Burdock, 1998; Anjum et al., 2018), but no in-depth analysis of adhesive and other physical material properties of propolis have been conducted so far. To be able to better understand how bees handle this sticky material, propolis was characterized as a biological adhesive in this paper. Accordingly, thermal properties, viscosity, elastic modulus and density mattered as important parameters in this study in addition to propolis adhesion itself (Kellar, 2011). From the density measurements, we can conclude that the density of propolis (0.953 g/cm3) is very close to the density of beeswax 0.957 g/cm3 reported in (Bernal et al., 2005). Such a density match might simplify the manufacture and handling of propolis by honeybees.
Propolis has previously been described to melt at temperatures between 60 and 70°C (Krell, 1996; Wagh, 2013). When heated in a water bath in our experiments, the beeswax component of propolis melted at 60–70°C. The resin component of propolis only softened, but did not become fluid. In our DSC analysis, propolis demonstrated a phase transition at 63°C. This corresponds to the melting temperature of beeswax at 62–66°C depending on its origin (Morgan et al., 2002; Gaillard et al., 2011). During the heating process, another phase transition occurred at about 55°C. Three polymorphic transitions during the heating of beeswax have previously been identified, one corresponding to the peak at 55°C (Gaillard et al., 2011). The other two transitions were not visible in our DSC results, probably due to a higher heating speed of 20 K/min compared to 1 K/min used by Gaillard et al. (2011). Previous DSC studies performed on beeswax/rosin mixtures also showed that a higher resin content leads to a decrease in the total heat flow and less pronounced or lacking secondary peaks corresponding to phase transitions (Gaillard et al., 2011). Amorphous resins, like rosin gum, often do not exhibit a clear melting point, but soften over a wide temperature range until they become liquid (Gaillard et al., 2011), while volatile essential oils usually have low melting points (−0.79°C for essential oil of cassia) (Ghodki and Goswami, 2016). This could explain why no additional peaks are present in the DSC thermograms apart from those corresponding to the beeswax component of propolis. Propolis has been reported to be hard and brittle when cold (under 15°C) (Krell, 1996; Wagh, 2013) and increasingly soft and sticky, when heated above 45°C (Krell, 1996; Wagh, 2013). This was confirmed by our adhesion and compression tests. Propolis behaved distinctly different in compression tests conducted at 0, 23, and 40°C and with 67 μm/s compression speed. Compared to tests performed at lower temperatures, a considerably lower force was needed at 40°C, to achieve the same level of compression. Both propolis elasticity modulus and viscosity decrease with an increasing temperature. Compression tests with beeswax at 3, 24, and 34°C revealed similar behavior (Morgan et al., 2002).
At 24°C, propolis has an elastic modulus of 11.2 MPa, which resembles elastic modulus of rubber (Smith, 2016). The Young's modulus, however, was very variable between samples, although all were formed from the same batch of homogenized propolis. Presumably, small changes in temperature, humidity, or/and kneading procedure had an influence on the modulus. Additionally, local inhomogeneities within the material might influence the modulus, since homogenized propolis consists of many heterogeneous microparticles, the size of which is comparable to the size of the tip (contact area). A small increase in temperature of 2°C decreased the Young's modulus of propolis significantly from 11.2 to 6.6 MPa. This also supports the observation made during compression tests at 40°C and when handling propolis that propolis becomes softer at higher temperatures. The elastic modulus of beeswax at room temperature was reported to be 39 MPa (Hossain et al., 2009). The addition of plant bud resins, oils, and other components, thus results in a softer and more pliable material compared to the pure beeswax (at room temperature).
Viscoelastic materials show combined elastic and viscous responses under mechanical stress (Ferry, 1980). We found that propolis exhibited viscoelastic behavior. Deformation and relaxation of viscoelastic materials is time-dependent (Kellar, 2011). This became clear, as propolis deformed elastically during adhesion experiments with short contact times, but viscoelastically, when contact times were extended to 60 s. Elastic contact could be distinguished from plastic contact, as the distance of the sample tip to the substrate and the tip profile did not change between single measurements. The multiple components of propolis also affect its viscoelastic behavior. During extended contact time, the measured loading force gradually decreased over time as the material relaxed. The relaxation curve of propolis was best fitted with an exponential function with two exponents, which is indicative of a composite material with at least two components (Xie et al., 2011). This result is not surprising, since propolis mainly composed of resin (50%) and wax (30%) (Burdock, 1998).
Compression tests at different velocities showed that the material behaved stiffer at higher velocities and more force had to be applied in order to deform it. This rate dependence due to non-Newtonian properties is typical for viscoelastic materials (Smith, 2016).
After heating propolis over 50–60°C and cooling down, it hardened considerably, and when exposed to the room temperature a hardened layer formed on the outside of the sample over the course of a day. It has previously been reported that propolis hardens over time, becoming brittle and darker in color (Teslenko et al., 2014). A possible reason for hardening could be the evaporation of water or/and volatile components (Kellar, 2011), as weighing propolis over 7 h showed that samples lost ~0.9% in weight over that period of time. Volatile propolis components, such as mono- and sesquiterpenoids, represent about 10% of propolis constituents and their loss could be responsible for propolis hardening (Bankova et al., 2000; Huang et al., 2014). Some resins also harden over time due to polymerization of diterpenoids initiated by light and oxidation (Langenheim, 1990). While beeswax has not been reported to harden, it is therefore likely that the resin component is responsible for the hardening of propolis.
The work of adhesion calculated from the pull-off force was chosen as the measure for propolis adhesion, as it provides comparable values that do not depend on the sample radius. This made it possible to compare the results of adhesion tests conducted with propolis at different conditions and on various substrates. Propolis adhesion on glass served as a reference and was measured to be ~3 J/m2. In a previous study, work of adhesion of 3.56 J/m2 was reported for a blend of 75% rosin and 25% beeswax (Girard et al., 2014). This material resembles propolis, as it is also a mixture of beeswax and resinous substances in a comparable ratio, and it exhibits similar work of adhesion. The mode of failure of propolis during adhesion experiments was rather adhesive than cohesive, as no visible propolis residues were found in the contact area with the substrate.
Experiments that were conducted repeatedly on the same spot of the substrate further confirmed the assumption that adhesive failure occurs. There was no difference in adhesion between reference measurements and measurements on the same spot, as could be expected if cohesive failure occurs and material residues accumulate in the contact area and tip geometry changes.
Furthermore, propolis also adhered to a glass surface in presence of fluid (oil or water), although here adhesion was significantly lower than that in dry conditions. Most industrial adhesives are not able to adhere in flooded conditions (von Byern and Grunwald, 2010). However, biocompatible glues able to adhere in wet conditions are needed for many biomedical applications (von Byern and Grunwald, 2010). The ability of propolis to adhere under water could therefore be an interesting property worth investigating further.
Significantly higher propolis adhesion was observed when the temperature was increased by only 2°C from to 24 to 26°C. It has been previously described that propolis becomes increasingly soft and sticky, when heated above 45°C (Krell, 1996; Wagh, 2013), but it seems that this process starts at even lower temperatures. At higher temperatures, the Young's modulus of propolis decreased and the material became softer. Adhesion energy is theoretically independent on Youngs' modulus. However, an elastically soft material can adapt to the substrate surface and thereby increase the real contact area and adhesion (Lorenz et al., 2013). Further experiments are necessary to study propolis adhesion at even higher temperatures and further extend our knowledge about this material, since bees handle propolis in the hive at temperatures usually ranging between 32 and 36°C (Jones, 2004). Higher adhesion of propolis was also measured in experiments with longer contact times, because this viscoelastic material had time to flow and adapt to the substrate surface profile, increasing therefore both the contact area and work of adhesion. This effect of time-dependent deformations has previously been reported (Reitsma et al., 2000). The viscoelastic deformation was also visible in the profile of propolis samples after experiments with prolonged contact times.
Substrate surface energy usually has a strong effect on adhesion (Gorb and Heepe, 2017). In our adhesion experiments, conducted on various smooth substrates with different surface energies [glass: 64 mJ/m2 (Weng et al., 2016), PTFE: 19 mJ/m2 (Kinloch, 1987), steel: 40 mJ/m2 (Mantel and Wightman, 1994)], the differences in adhesion forces were lower as expected. Substrates with low surface energy, such as PTFE, have low Hamaker constant and polarizability, and affect the strength of van der Waals interactions, which is why lower adhesion would usually be expected on these surfaces (Gorb and Heepe, 2017). However, propolis adhered more or less similarly to all tested substrates. There was no significant difference between adhesion on a polar glass surface and an unpolar PTFE substrate. Low dependence on substrate chemistry is often a characteristic of biological adhesives (Richter et al., 2018). We assume that some fluid components (e.g., mono- and sesquiterpenoids) of propolis may alter the interface between propolis sample and substrate and make adhesion almost independent of the substrate. These fluids might also be responsible for enlarged real contact area. Chemical characteristics of propolis should be further investigated to better understand their influence on propolis adhesion.
Exact composition of propolis can vary immensely depending on environmental conditions, resin sources, bee colony, season, etc. (Bankova, 2005; Mello and Hubinger, 2012). One can expect that the variability of propolis also extends to its physical and adhesive properties. The presented results are therefore a starting point for further experiments with different propolis types, as well as on propolis components, such as bud resins and different bee waxes.
The results of this work show that the composite nature of propolis is reflected in many of its physical properties, such as viscoelasticity, Young's modulus, and adhesion. Different components of propolis, mainly plant resins and beeswax, have long been used in various adhesives due to their characteristic properties. Resin is a good adhesive that can be added to adhesive mixtures, to provide tack and peel (Richter et al., 2018). In contrast, beeswax does not have initial tack, but it can act as a softener for adhesive formulations (Richter et al., 2018). Combinations of a resin (rosin) and beeswax have been used as adhesives since the Mesolithic period and have also previously been studied for their thermal and mechanical properties (Gaillard et al., 2011; Girard et al., 2014).
As propolis was found to adhere to a wide range of substrates and even in underwater and flooded oil conditions, it might be interesting for numerous adhesive applications in the future. Recently, the interest in bio-inspired adhesives has strongly increased due to the growing need for sustainable or environment-friendly adhesive solutions (Richter et al., 2018). For example, adhesives used for medical applications often have to serve different purposes, such as high tack, moisture resistance, durability, biocompatibility, and removability (von Byern and Grunwald, 2010), which all could at least partly be fulfilled by propolis. The antimicrobial effect of propolis might also be an advantageous additional property for future medical adhesives.
The raw data supporting the conclusions of this article will be made available by the authors, without undue reservation.
LS, JS, OS, SG, and AK contributed to conception and design of the study. LS conducted and evaluated the experiments and wrote the first draft of the manuscript. KW performed and evaluated the DSC analysis. All authors contributed to manuscript revision, read, and approved the submitted version.
The authors declare that the research was conducted in the absence of any commercial or financial relationships that could be construed as a potential conflict of interest.
The Supplementary Material for this article can be found online at: https://www.frontiersin.org/articles/10.3389/fmech.2021.660517/full#supplementary-material
Anjum, S. I., Ullah, A., Khan, K. A., Attaullah, M., Khan, H., Ali, H., et al. (2018). Composition and functional properties of propolis (bee glue): a review. Saudi J. Biol. Sci. 26, 1695–1703. doi: 10.1016/j.sjbs.2018.08.013
Bankova, V. (2005). Chemical diversity of propolis and the problem of standardization. J. Ethnopharmacol. 100, 114–117. doi: 10.1016/j.jep.2005.05.004
Bankova, V., Bertelli, D., Borba, R., Conti, B. J., da Silva Cunha, I. B., Danert, C., et al. (2016). Standard methods for Apis mellifera propolis research. J. Apic Res. 58, 1–49. doi: 10.1080/00218839.2016.1222661
Bankova, V., de Castro, S., and Marcucci, M. (2000). Propolis: recent advances in chemistry and plant origin. Apidologie 31, 3–15. doi: 10.1051/apido:2000102
Bernal, J. L., Jiménez, J. J., del Nozal, M. J., Toribio, L., and Martin, M. T. (2005). Physico-chemical parameters for the characterization of pure beeswax and detection of adulterations. Eur. J. Lipid Sci. Technol. 107, 158–166. doi: 10.1002/ejlt.200401105
Burdock, G. A. (1998). Review of the biological properties and toxicity of bee propolis (propolis). Food Chem. Toxicol. 36, 347–363. doi: 10.1016/S0278-6915(97)00145-2
Cheng, L., Xia, X., Scriven, L. E., and Gerberich, W. W. (2005). Spherical-tip indentation of viscoelastic material. Mech. Mater. 37, 213–226. doi: 10.1016/j.mechmat.2004.03.002
Christensen, R. (1982). Theory of Viscoelasticity, 2nd Edn. London: Academic Press; doi: 10.1016/B978-0-12-174252-2.50012-0
Cirasino, L., Pisati, A., and Fasani, F. (1987). Contact dermatitis from propolis. Contact Dermatitis 16, 110–111. doi: 10.1111/j.1600-0536.1987.tb01394.x
Cornara, L., Biagi, M., Xiao, J., and Burlando, B. (2017). Therapeutic properties of bioactive compounds from different honeybee products. Front. Pharmacol. 8:412. doi: 10.3389/fphar.2017.00412
Gaillard, Y., Mija, A., Burr, A., Darque-Ceretti, E., Felder, E., and Sbirrazzuoli, N. (2011). Green material composites from renewable resources: polymorphic transitions and phase diagram of beeswax rosin resin. Thermochim. Acta 521, 90–97. doi: 10.1016/j.tca.2011.04.010
Ghisalberti, E. L. (1979). Propolis: a review. Bee World 60, 59–84. doi: 10.1080/0005772X.1979.11097738
Ghodki, B. M., and Goswami, T. K. (2016). Physico-thermal and flavoring characteristics of essential oil of cassia. J. Essent. Oil Bear Plants 19, 854–862. doi: 10.1080/0972060X.2016.1187091
Girard, M., Gaillard, Y., Burr, A., Darque-Ceretti, E., and Felder, E. (2014). Nanoindentation of bio-sourced adhesive 75% rosin/25% beeswax: experimental results and modelisation. Mech. Mater. 69, 185–194. doi: 10.1016/j.mechmat.2013.10.005
Gorb, E., Kastner, V., Peressadko, A., Arzt, E., Gaume, L., Rowe, N., et al. (2004). Structure and properties of the glandular surface in the digestive zone of the pitcher in the carnivorous plant Nepenthes ventrata and its role in insect trapping and retention. J. Exp. Biol. 207, 2947–2963. doi: 10.1242/jeb.01128
Gorb, S. N. (2007). Visualisation of native surfaces by two-step moldings. Microscopy Today 15, 44–47. doi: 10.1017/S1551929500051038
Gorb, S. N., and Heepe, L. (2017). “Biological fibrillar adhesives: functional principles and biomimetic applications,” in Handbook of Adhesion Technology, eds L. F. M. da Silva, A. Ochsner, and R. D. Adam (Cham: Springer International Publishing), 1–37. doi: 10.1007/978-3-319-42087-5_54-2
Gorb, S. N., and Scherge, M. (2000). Biological microtribology: anisotropy in frictional forces of orthopteran attachment pads reflects the ultrastructure of a highly deformable material. Proc. R Soc. London Ser. B Biol. Sci. 267, 1239–1244. doi: 10.1098/rspb.2000.1133
Greenaway, W., Scaysbrook, T., and Whatley, F. R. (1990). The composition and plant origins of propolis: a report of work at Oxford. Bee World 71, 107–118. doi: 10.1080/0005772X.1990.11099047
Hossain, M., Ketata, C., and Islam, M. R. (2009). “Experimental study of physical and mechanical properties of natural and synthetic waxes using uniaxial compressive strength test,” in Proceeding of Third International Conference on Modeling, Simulations and Applied Optimization, Sharjah, United Arab Emirates, 1–5.
Huang, S., Zhang, C.-P., Wang, K., Li, G. Q., and Hu, F.-L. (2014). Recent advances in the chemical composition of propolis. Molecules 19, 19610–19632. doi: 10.3390/molecules191219610
Isidorov, V. A., Bakier, S., Piroznikow, E., Zambrzycka, M., and Swiecicka, I. (2016). Selective behaviour of honeybees in acquiring European propolis plant precursors. J. Chem. Ecol. 42, 475–485. doi: 10.1007/s10886-016-0708-9
Jiao, Y., Gorb, S., and Scherge, M. (2000). Adhesion measured on the attachment pads of Tettigonia viridissima (Orthoptera, Insecta). J Exp Biol 203, 1887–1895. doi: 10.1242/jeb.203.12.1887
Johnson, K. L., Kendall, K., and Roberts, A. D. (1971). Surface energy and the contact of elastic solids. Proc. R Soc. A Math. Phys. Eng. Sci. 324, 301–313. doi: 10.1098/rspa.1971.0141
Jones, J. C. (2004). Honey bee nest thermoregulation: diversity promotes stability. Science 305, 402–404. doi: 10.1126/science.1096340
Kellar, E. J. C. (2011). “Selection of adhesives,” in Handbook of Adhesion Technology, eds L. F. M. da Silva, A. Ochsner, and R. D. Adam (Berlin: Springer Berlin Heidelberg), 373–389. doi: 10.1007/978-3-642-01169-6_16
Kinloch, A. J. (1987). Adhesion and Adhesives: A Science and Technology. Dordrecht: Springer Netherlands. doi: 10.1007/978-94-015-7764-9
Koch, K., Schulte, A. J., Fischer, A., Gorb, S. N., and Barthlott, W. (2008). A fast, precise and low-cost replication technique for nano- and high-aspect-ratio structures of biological and artificial surfaces. Bioinspir. Biomim. 3:46002. doi: 10.1088/1748-3182/3/4/046002
Kovalev, A., Filippov, A., and Gorb, S. N. (2018). Slow viscoelastic response of resilin. J. Comp. Physiol. A 204, 409–417. doi: 10.1007/s00359-018-1248-2
Krell, R. (1996). Value-Added Products From Beekeeping. Rome: Food and Agriculture Organization of the United Nations; (FAOAgricul-tural Services Bulletin).
Kumazawa, S., Nakamura, J., Murase, M., Miyagawa, M., Ahn, M.-R., and Fukumoto, S. (2008). Plant origin of Okinawan propolis: honeybee behavior observation and phytochemical analysis. Naturwissenschaften 95, 781–786. doi: 10.1007/s00114-008-0383-y
Lorenz, B., Krick, B. A., Mulakaluri, N., Smolyakova, M., Dieluweit, S., Sawyer, W. G., et al. (2013). Adhesion: role of bulk viscoelasticity and surface roughness. J. Phys. Condens. Matter. 25, 1–16. doi: 10.1088/0953-8984/25/22/225004
Mantel, M., and Wightman, J. P. (1994). Influence of the surface chemistry on the wettability of stainless steel. Surf. Interface Anal. 21, 595–605. doi: 10.1002/sia.740210902
Mello, B. C. B. S., and Hubinger, M. D. (2012). Antioxidant activity and polyphenol contents in Brazilian green propolis extracts prepared with the use of ethanol and water as solvents in different {pH} values. Int. J. Food Sci. Technol. 47, 2510–2518. doi: 10.1111/j.1365-2621.2012.03129.x
Monti, M., Bertt, E., Carminati, G., and Cusini, M. (1983). Occupational and cosmetic dermatitis from propolis. Contact Dermatitis 9:163. doi: 10.1111/j.1600-0536.1983.tb04341.x
Morgan, J., Townley, S., Kemble, G., and Smith, R. (2002). Measurement of physical and mechanical properties of beeswax. Mater. Sci. Technol. 18, 463–467. doi: 10.1179/026708302225001714
Owens, D. K., and Wendt, R. C. (1969). Estimation of the surface free energy of polymers. J. Appl. Polym. Sci. 13, 1741–1747. doi: 10.1002/app.1969.070130815
Popov, V. L., Pohrt, R., and Li, Q. (2017). Strength of adhesive contacts: influence of contact geometry and material gradients. Friction 5, 308–325. doi: 10.1007/s40544-017-0177-3
Reitsma, M., Craig, V. S. J., and Biggs, S. (2000). Measurement of the adhesion of a viscoelastic sphere to a flat non-compliant substrate. J. Adhes. 74, 125–142. doi: 10.1080/00218460008034527
Richter, K., Grunwald, I., and von Byern, J. (2018). “Bioadhesives, ” in Handbook of Adhesion Technology, eds L. F. M. da Silva, A. Ochsner, and R. D. Adam (Cham: Springer International Publishing), p. 1–45. doi: 10.1007/978-3-319-42087-5_53-2
Simone-Finstrom, M., and Spivak, M. (2010). Propolis and bee health: the natural history and significance of resin use by honey bees. Apidologie 41, 295–311. doi: 10.1051/apido/2010016
Smith, A. M. (2016). Biological Adhesives. Cham: Springer International Publishing. doi: 10.1007/978-3-319-46082-6
Teslenko, I. A., Bobro, S. G., and Tikhonov, A. I. (2014). “Development cosmetics based propolis,” in Actual questions of development of new drugs : Abstracts of XX international scientific and practical conference of young scientists and student. Available online at: http://dspace.nuph.edu.ua/handle/123456789/5977 (accessed April 20, 2021).
von Byern, J. G., and Grunwald, I. (2010). Biological Adhesive Systems. Vienna: Springer-Verlag KG. doi: 10.1007/978-3-7091-0286-2
Wagh, V. D. (2013). Propolis: a wonder bees product and its pharmacological potentials. Adv. Pharmacol. Sci. 2013, 1–11. doi: 10.1155/2013/308249
Weng, S-C., Fuh, A., Tang, F-C., and Cheng, K-T. (2016). Effect of surface condition on liquid crystal photoalignment by light induced azo dye adsorption phenomena. Liq. Cryst. 43, 1221–1229. doi: 10.1080/02678292.2016.1163740
Wheater, C. P., and Evans, M. E. G. (1989). The mandibular forces and pressures of some predacious Coleoptera. J. Insect. Physiol. 35, 815–820. doi: 10.1016/0022-1910(89)90096-6
Keywords: propolis, honeybees, adhesion, surface energy, van der Waals interactions, viscoelasticity, plasticity
Citation: Saccardi L, Schiebl J, Weber K, Schwarz O, Gorb S and Kovalev A (2021) Adhesive Behavior of Propolis on Different Substrates. Front. Mech. Eng. 7:660517. doi: 10.3389/fmech.2021.660517
Received: 29 January 2021; Accepted: 06 April 2021;
Published: 07 May 2021.
Edited by:
Hongyu Zhang, Tsinghua University, ChinaReviewed by:
Yoshitaka Nakanishi, Kumamoto University, JapanCopyright © 2021 Saccardi, Schiebl, Weber, Schwarz, Gorb and Kovalev. This is an open-access article distributed under the terms of the Creative Commons Attribution License (CC BY). The use, distribution or reproduction in other forums is permitted, provided the original author(s) and the copyright owner(s) are credited and that the original publication in this journal is cited, in accordance with accepted academic practice. No use, distribution or reproduction is permitted which does not comply with these terms.
*Correspondence: Oliver Schwarz, b2xpdmVyLnNjaHdhcnpAaXBhLmZyYXVuaG9mZXIuZGU=
Disclaimer: All claims expressed in this article are solely those of the authors and do not necessarily represent those of their affiliated organizations, or those of the publisher, the editors and the reviewers. Any product that may be evaluated in this article or claim that may be made by its manufacturer is not guaranteed or endorsed by the publisher.
Research integrity at Frontiers
Learn more about the work of our research integrity team to safeguard the quality of each article we publish.