- Fraunhofer IWM MikroTribologie Centrum, Karlsruhe, Germany
The sliding performance of cross country skis is mainly influenced by the ability of the ski base to minimize capillary forces and contact area. Whereas, the first condition depends on hydrophobicity, the second one is controlled by the ski grinding structure and the morphology of snow. In this contribution the results of sliding tests with five typical grinding structures will be presented and compared to calculations of the real area of contact. Surface topographies were measured and corresponding roughness features were analyzed by 3D optical microscopy. The measured ski base profiles and the measured grain size distribution of granular snow at −2°C were employed within a bearing model for a rough surface in contact with loose and freely-moving snow grains treated as ice spheres. For the five grinding structures, this model revealed a good correlation of the real area of contact between ski and snow with run times in lab-condition sliding tests. The results indicate that the snow-containing volume of the grinding structure is pivotal for tailoring the sliding behavior.
1. Introduction
According to the microscopic friction law by Bowden and Tabor Ff = τAr (Bowden and Hughes, 1939) there are two entities that determine the magnitude of friction Ff: the shear stress τ as a joint contribution of upper and lower friction body and the real area of contact Ar. The shear stress τ is a complex entity, since it comprises the near-surface shear conditions of the ski base, which can be altered by ski preparation. In addition, τ is strongly influenced by a nanometer-thin water film due to pre-melting of snow. This water film grows upon mechanical contact, mainly by the action of frictional heat. τ cannot be measured and will be treated as a constant in this contribution, as it is well-known that this assumption only holds under well-defined lab-conditions.
The upper body of the tribological system, the grinding structure, results from the treatment of the ski base with a circular grinding stone. The abrasives of the stone remove base material (ultra-high molecular weight polyethylen = UHMWPE) so that after proper conditioning of the stone prior to grinding a regular groove and ridge pattern appears. The real area of contact between the grinding structure with the snow withdraws itself from direct observation. This phenomenon is the inbuilt calamity of tribology as the science of friction, wear, and lubrication.
The real area of contact Ar is a fraction of the apparent (geometric) area of contact, i.e., the width of the ski times the percentage of ski length in contact with snow. The latter depends on ski construction (flex) and shape of the terrain. The real area of contact cannot be measured, it has to be calculated. This task falls into the field of contact mechanics with its roots dating back to the research of Hertz (1882). At this time it was possible to compute Ar for a simple pairing of a sphere vs. a flat. In addition, Hertzian contact mechanics allowed to determine both contact stress and indentation depth, for instance of a harder sphere into a softer flat. Hertz' solution of the Bousinesq differential equation was possible under certain boundary conditions: (i) completely elastic behavior of both bodies, (ii) small indentation depth in comparison with the diameter of the sphere, and (iii) no adhesion between ball and flat.
For a grinding structure in contact with a snow surface, roughness has to be considered. Furthermore, plasticity cannot be neglected and therefore a Hertz-type analytical solution is not possible. Fortunately, the advent of powerful computers and algorithms allows for the consideration of rough surfaces and plastic deformation to estimate Ar with numerical means (e.g., by using Fourier transform techniques, Pastewka et al., 2012).
Snow—as the lower body of the tribological system—is a complex material and it would exceed the page limit of this contribution to explain all properties in detail. We therefore concentrate on snow which is present in most of the competitions in cross country skiing. This type of snow is a mixture of natural and artificial snow after numerous contacts with a snow groomer. The single constituting grains of snow are connected by sinter necks for very low temperatures or by capillary bridges for intermediate temperatures. Close to the melting point intergranular adhesion is negligible. Here, we concentrate on the third case. Under this conditions, the ski base material has a higher hardness than the snow grains suggesting that plastic deformation will occur in the snow, only.
The ice grains in the snow considered in this article have a high Young's modulus E and a rather low hardness H. Therefore, almost no elastic deformation takes place and deformations are dominated by plasticity. Thus, numeric approaches based on elastic-plastic contact mechanics represent an unnecessarily complicated approach that would waste computational resources for the calculation of the unimportant elastic deformation of the ice grains. Therefore, we focus on the purely plastic problem and use the so-called Bearing Model. In this model, plastic deformation occurs when the local compressive stress equals the hardness of the snow grains (Popov, 2010; Weber et al., 2018).
Summarizing, in order to reflect the real conditions in skiing, a contact model must take into account surface features of the grinding structure and the snow. It is the aim of this contribution to relate the results of sliding tests in the field to calculations of the real area of contact emerging from the contact of grinded skis and snow. Five different typical grinding structures were used in sliding tests in a ski tunnel. Microscopical analysis of the snow coroborated the above assumptions i.e., the snow model can be based on an ensemble of individual round ice grains with no inter-granular adhesion. This approach allowed us to set up a simple contact model to compute the real area of contact between the ski base and the top layer of ice grains.
2. Experimental Methods
The experimental section explains the ski base preparation, the way how the sliding tests were performed and how snow was analyzed.
2.1. Ski Base Preparation
In total five skis with different grinding structures (S1–S5) were prepared for the test. Structures were provided by Montana Germany according to the parameters displayed in Table 1. Both average and maximum roughness Ra and Rz adequately reflect the grinding machine settings to realize a linear structure which is fine, medium, and coarse (S1–S3). Structure S4 was linear as well, however the grinding process was multiply repeated with altered parameters. In contrast to all linear structures, S5 was cross-hatched. After grinding, the topography of the ski base was analyzed by optical profilometry using a Bruker white light interferometer. The gained surface topography then was Fourier filtered with a cut-off wavelength of 33 μm to decrease noise of the profile. For each grinding structure, one topography was captured.
2.2. Sliding Tests
All sliding tests were performed under lab-conditions (Skitunnel Oberhof, Germany) with snow at a constant temperature of -2°C and a humidity between 30 and 40% (Doser). For sliding, a straight section in the tunnel with moderate slope was chosen (see Figure 1). The individual runs were executed outside of the tracks prepared for classic technique. The tester—a professional skier and Olympian with a height of 1,65 m and a mass of 70 kg—carried an optical sensor, attached to the ski boot, that was started by a reflector and 40 m later stopped by a second reflector. Each ski was tested three times and the sliding time was averaged. In all tests the skis were not waxed.
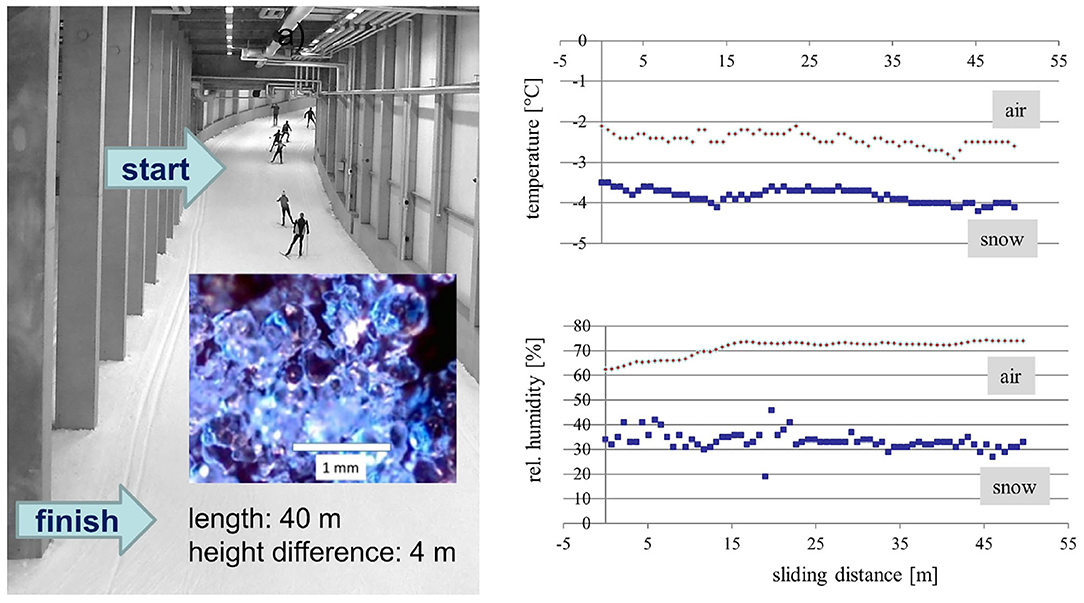
Figure 1. Sliding test in the skitunnel in Oberhof. The sliding distance was 40 m with a difference in height of 4 m. The insets show snow outside of a track as well as the course of temperatures and relative humidities along the sliding path.
2.3. Snow Analysis
Snow was analyzed using an optical microscope with a magnification of 60 times. To increase contrast, snow was placed on a black plastic pad. Three different captures were taken. Snow was found to be composed of individual rounded grains with an average diameter between 500 and 750 μm. The grains were not sintered and separated upon slightest mechanical contact. Additionally, temperature and humidity of snow and air were measured.
3. Computational Methods
On a microscopic scale, sliding on snow is governed by the interaction of ice grains with the ski base (see Figure 2A).
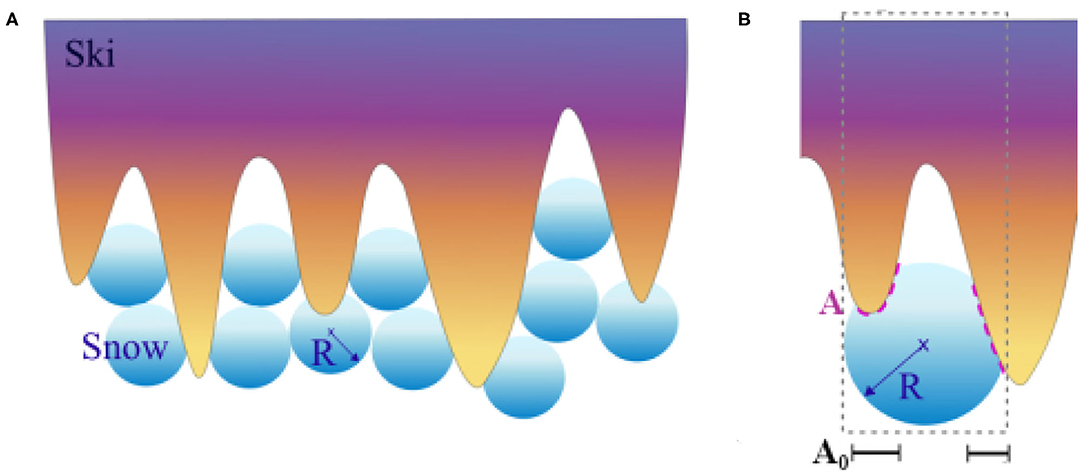
Figure 2. Model of the ski-snow contact. Snow consisting of unsintered, loose snow grains is considered. These grains move freely against each other and fill the ski base topography. In (A), the filling process is schematically illustrated with snow grains modeled as spheres having a certain radius R. In (B), it is shown, how the real contact area A is calculated when a single snow grain is pressed into a ski topography valley. The softer grain deforms plastically and the real contact area A between ski and snow is determined as the surface of the harder material (the ski) that is wrapped by the softer material (the ice). Projecting A on the sliding plane yields A0, the projected area of contact. Finally, the fractional contact area is calculated as .
3.1. Snow Model
Excluding the case of fresh precipitation, snow is composed of individual ice grains with either polyhedral or roughly spherical form–depending on the state of transformation. In our case, a microscopic analysis suggests that the snow consists of individual unconnected grains. Due to the repeated mechanical stress by snow groomer and skiers, the snow grains have lost their cohesion. Caused by the prevailing snow temperature of −2°C there is no free water between the grains and therefore also capillary interaction can be neglected. Thus, in contrast to completely sintered or wet snow, the grains have a high mobility and are able to occupy the valleys within the grinding structure (see Figure 2A). This surface structure of snow impacts the real area of contact and friction.
The calculation of the real area of contact starts with the surfaces of ski base and snow which are brought into contact. Both surfaces are described by a 3D-topography as well as the mechanical properties (hardness H, Young's modulus E, and a Poisson's ratio ν). Next, the ski base is lowered toward the snow surface until indention starts. Deformation takes places and after equilibration the real area of contact is calculated. As the mechanical properties of the two contacting materials determine the equilibrium deformation, we first discuss the experimentally available values for hardness H, Young's modulus E and Poisson's ratio ν.
3.2. Young's Modulus E of Ice
Published values for the Young's modulus E of ice show a large scatter—literature values range between 1.2 GPa and more than 10 GPa dependent on the method of measurement, on temperature and on the orientation of the ice crystals within the granular network (Shapiro et al., 1997; Schulson, 1999; Theile et al., 2009; Fellin, 2013; Böttcher et al., 2017).
Literature values of Poisson's ratios ν exhibit a deviation between 0.29 and 0.33 (Schulson, 1999; Fellin, 2013; Böttcher et al., 2017). For randomly oriented polycrystals, typical values of Young's modulus and Poisson's ratio are 9 GPa and 0.33 (Schulson, 1999), respectively. In this work, the values employed by Böttcher et al. (2017) are used and the calculations are performed with a Young's modulus of 9.5 GPa and a Poisson's ratio of 0.31 (Böttcher et al., 2017).
3.3. Hardness of Ice
There is a strong dependence of the ice hardness on the loading rate. The ice hardness H has to be determined on a time scale relevant to winter sports (Petrovic, 2003; Poirier et al., 2011; Makkonen and Tikanmäki, 2014). Therefore, the time scale for the plastic deformation process in our experiments has to be estimated. We consider the contact time as the duration of the contact between the ski grinding structure and a grain of the snow surface. We assume that a skier has an average velocity of the order of 10 km/h and a snow grain has an average diameter d of 500 μm. We define the contact time tcontact as the time a ski asperity needs to slide over a snow grain and therefore, tcontact can be estimated via the following expression:
Based on our estimate for tcontact, two hardness models appear to be adequate. These models provide hardness values as function of temperature for s. One model is provided by Poirier et al. (2011) and the second one by Makkonen and Tikanmäki (2014). Both models employ a linear relation between hardness and temperature with different parameters. While Poirier's equation is valid for T <-1°C
Makkonen and Tikanmäki's expression is valid from −10 to −3°C
These models show a certain discrepancy for the ice hardness as function of temperature. In this work, the hardness model of Poirier is used as it provides more realistic hardness values close to the melting point (the Makkonen and Tikanmäki model shows negative hardnesses for T>−3°C).
3.4. Mechanical Properties of Ski Base Material
The ski base is made of UHMWPE with a Poissons's ratio of 0.46 and a Young's modulus of 840 MPa. The hardness of UHMWPE is estimated using the following equation:
3.5. Deformation Regime
Table 2 summarizes the mechanical properties of the two materials in contact at T = −2°C. At this temperature, hardness of UHMWPE is significantly higher than the hardness of ice. Thus, snow is plastically deformed by the harder ski base surface. Interestingly, the mechanical properties of snow are determined by a very high Young's modulus and a relatively low hardness of the ice grains. This peculiar combination of mechanical properties renders the ice grain a very stiff material that yields plastically while exhibiting small elastic deformation. In order to simplify the contact area calculations, one could assume that the contact mechanics of ice is determined by plasticity alone and elasticity can be neglected. This assumption was confirmed by comparing elastic-plastic contact mechanic calculations with calculations considering plasticity, only. The real contact area of the ski topography in contact with a flat ice surface was calculated with elastic-plastic contact mechanic calculations based on Pastewka et al. (2012) and compared to calculations using an approach considering only plastic deformation (the so-called bearing model; Popov, 2010; Weber et al., 2018). The qualitative results and especially the resulting ranking of the grinding structures S1–S5 is unchanged when elasticity is neglected (see Figure 3).

Table 2. The mechanical properties of an ice grain in snow and the ski base material at T = −2°C (Poirier et al., 2011; Fellin, 2013; Böttcher et al., 2017).
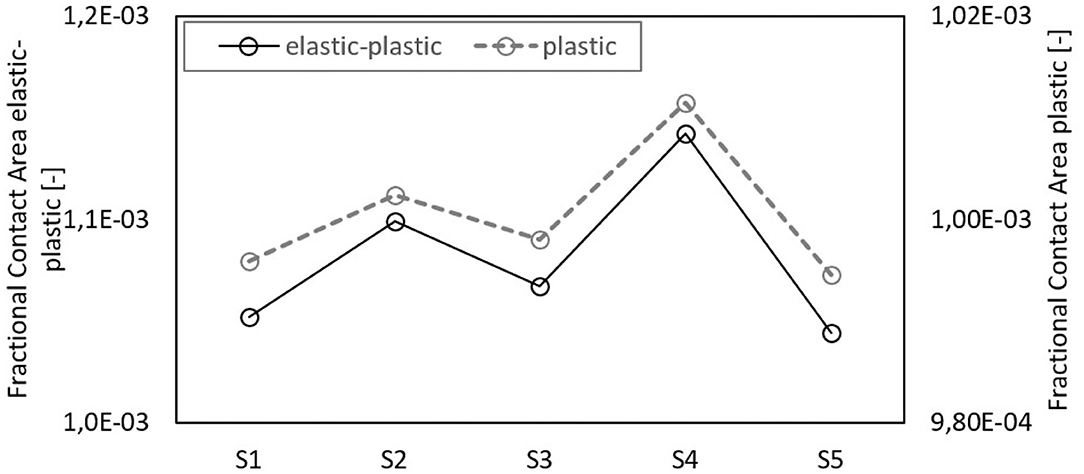
Figure 3. Fractional contact area of the ski topographies S1–S5 in contact with an ice surface. Comparison of an elastic-plastic contact mechanics calculation (black curve) with a calculation considering plastic deformation, only (gray curve). The fractional contact area was calculated between the ski base and a plane surface having a hardness of 20 MPa and with an applied pressure of 20 kPa. The calculation considered the whole ski sole surface topographies having a nominal area of 1, 660 × 800μm.
3.6. Macroscopic Pressure in the Ski-Snow Contact
The macroscopic pressure in a cross country ski-snow contact is calculated based on assumptions of the average ski surface dimensions and on the mean stature of a skier. It is assumed that an athlete of 80 kg is skiing on a pair of 1,900 mm long and 40 mm wide cross country skis. During skating, most of the time only one ski is in contact with snow. Assuming that the whole ski base carries the load of the skier, results in a pressure of 9.6 kPa. In reality, a cross country ski shows a curvature along the sliding direction resulting in two major contact areas which are together much smaller than the total ski base area. Therefore, a 1.5–3 times higher pressures (15–30 kPa) is chosen for the contact area calculations. As mean value to work with, 20 kPa is used as a default pressure (Böttcher et al., 2017).
3.7. Calculation of the Real Area of Contact Ar
The ski surface is described as topography on a grid of (x, y) values having height values hski(x, y) (see Figure 4). The snow surface is represented by a sphere having a certain diameter D = 2R and also modeled as topography grid hsnow(x, y). When the ski base surface is lowered enough such that the macroscopic pressure of the skier is reached, the contact areas between the ice grains and the grindings structure sum up to the real area of contact. Based on the estimates of the mechanical properties, we assume that plastic deformation of the softer material (the ice grains) takes places at all contact points.
Starting point of the Ar calculation is the following special case. The ski base grinding structure is brought in contact with a single spherical ice grain with radius R (see Figure 2B). The ski surface topography hski(x, y) is lowered by a distance δ until indentation of the ice sphere takes place and the ice deforms plastically. This lowering process stops, when a certain projected contact area A0(δ) is established such that the local contact pressure is equal to the hardness of the ice Hice. In this situation the sphere carries a load A0(δ)Hice that is equal to the macroscopic pressure times the effective area occupied by the sphere
The projected contact area A0(δ) is calculated as follows. The gap between the ski surface and the ice sphere is given by
with the topographies hski(x, y) and hice(x, y). The lowering distance δ of the ski topography determines the projected contact area
The Heavyside function Θ ensures that only zones that are in contact [i.e., with a negative gap g(x, y, δ)] contribute to this integral.
The real area of contact is determined by the integrated surface of the part of the ski surface that is wrapped by the ice sphere (see Figure 2B). The equation to calculate the real contact area is given by:
The result of the surface calculation can be translated into a (dimensionless) fractional contact area Afr which gives the amount of the computed real contact area Ar over its apparent contact area (2R)2, which is the assumed area an ice sphere occupies on the ski surface:
In a final step, the surface of the grinding structure is raster scanned with the ice sphere and the real contact area is calculated for all sphere positions with the sphere pressed into a topography valley of the ski base surface. Finally, a mean value of Afr is computed for each sphere size R.
3.8. Pearson Correlation
In order to quantify the statistical relation rPear between sliding times and the fractional contact area Afr, the Pearson correlation coefficient is employed. It quantifies a statistical correlation between two random variables X and Y:
where xi is the value of feature X of the ith sample and yi is the value of feature Y of the ith sample having n samples in total and where and ȳ are the mean values of Features X and Y.
The Pearson correlation coefficients ranges between −1 and 1 where the sign indicates the direction of the correlation between X and Y. While a coefficient of ±1 suggests a complete monotonic linear relation, an rPear of zero indicates that X and Y are uncorrelated (Ho et al., 2016).
4. Results
4.1. Sliding Tests
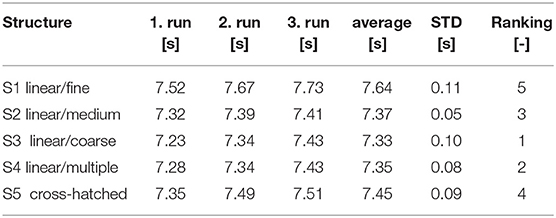
Each ski (with grinding structure S1–S5) was tested three times and the sliding time was recorded. Then the averaged sliding time was calculated and the standard deviation as well as the ranking was determined. In the ranking, the fastest ski occupies rank number 1 (S3 linear/coarse), while the slowest ski has rank number 5 (S1 linear/fine). The results are listed in Table 3. The standard deviations in Table 3 indicate that while the two slowest skis (S1, S5) can easily be determined, the sliding times of the three fastest skies (S3, S4, S2) are close together. In the following we want to present sliding test results in comparison to the slowest ski (S1) and therefore the dimensionless sliding time is introduced for each grinding structure Sj:
Here, Sj denotes the number of the grinding structure and tSj is the mean sliding time of the skies (see Table 3). The results are normalized by the sliding time of the slowest ski. Thus, the slowest ski has a dimensionless sliding time of 1 and the faster skies have values smaller than 1.
4.2. Grinding Structures of Ski Base
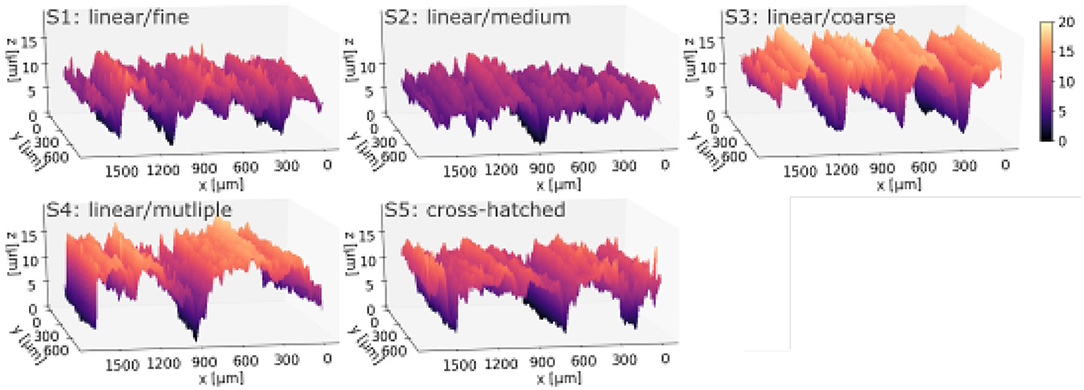
Figure 4 shows all 3D images of the grinding structures considered in this article. To characterize and categorize surface properties of the grinding structures, various characteristic 3D surface parameters are calculated and listed in Table 4.

Table 4. 3D roughness information from topographical scans h(x, y) of the ski soles S1–S5 measured by white light interferometry and post-processed by Fourier filtering.
The amplitude parameters Sa and Sq characterize the surface based on the vertical deviations of the 3D topography from its mean height. The root mean square slope Sdq is also given to provide more insight into the short length scale properties of the grinding structures. The higher the variation of the texture within a short lateral spacing, the higher Sdq. To regard surface parameters which reveal information about the profile shape, the parameters skewness Ssk and kurtosis Sku are calculated. Ssk measures the asymmetry of the topography about the mean plane and thus describes the shape of the topography height distribution. Sku indicates the sharpness of the roughness profile and thus measures the peakedness of the surface profile about the mean plane. When the Pearson correlations were calculated between these surface parameters and the sliding time (see Table 4), no significant correlation could be found. Note, that for a significance of α = 0.05 an |rPear| ≥ 0.88 is required.
4.3. Snow Analysis
Based on various microscopy images of the snow at the test day in Oberhof (see inset in Figure 5), a grain size distribution was estimated (see Figure 5). To do so, snow grains were identified in the microscopic pictures and elliptic forms were matched.
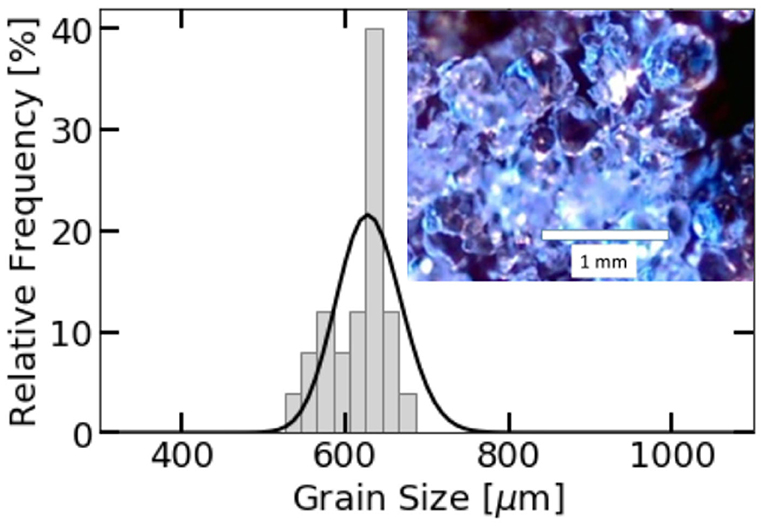
Figure 5. Distribution of the snow grain diameters. Three microscopic snow images of the loose, unsintered snow grains (inset) are analyzed and snow grain sizes are estimated from the microscopic images. From the resulting diameters a histogram is calculated (gray barplot) that is approximated by a smooth, normalized grain size distribution (black line) using Equation (12).
Using the discrete grain size distribution, a normalized grain size distribution of the form f(D) = a·ecD·Db was matched (Nakamura et al., 2001). Fitted was the function to the relative frequencies of the grain sizes using a non-linear least squares fit. The resulting grain size distribution is the following (see black curve in Figure 5):
4.4. Correlations of Real Area of Contact With Sliding Times
The raster scanning of the ski surface was performed employing ice spheres with diameters between 500 and 750 μm (see grain size distribution in Figure 5). For each grain diameter, the fractional contact area for the grinding structures S1–S5 was calculated. In Figure 6, the resulting Afr is plotted over the dimensionless sliding time for some selected grain sizes. Figure 6A shows this relation for ice grains which can be found in the grain size distribution, while Figure 6B displays results for grain sizes outside the size distribution.
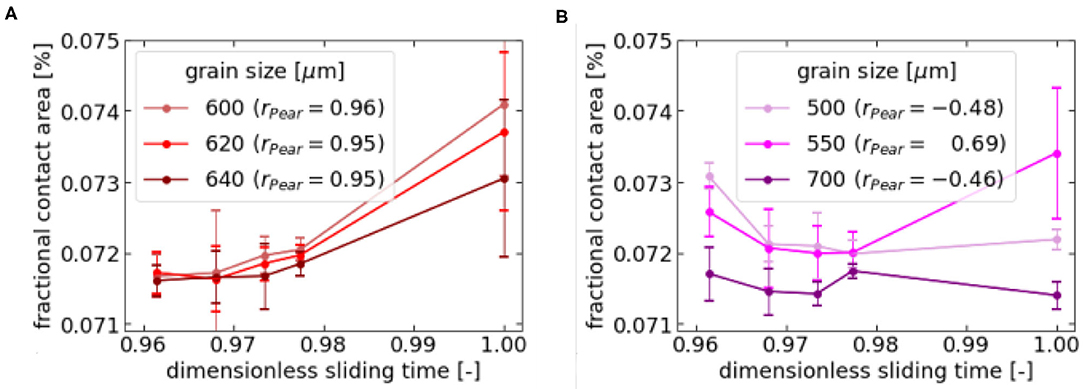
Figure 6. Fractional contact area as a function of the dimensionless sliding time of skis with grinding structure S1–S5. Grain sizes representing the grain size distribution of the experimental snow exhibit monotone relations between Afr and dimensionless sliding time (A), while for grain sizes outside the range of the grain size distribution no significant correlations can be detected (B). The dimensionless sliding time is defined by the sliding time of each ski divided by the sliding time of the slowest ski. The strength of the correlations in (A,B) is measured by the Pearson correlation coefficient rPear; see Equation (10). Note, that for a significance of α = 0.05 an |rPear| ≥ 0.88 is required.
As can be seen, a significant correlations between fractional contact area and dimensionless sliding time can be detected for grain sizes occurring in our experimental snow. To quantify these correlations, the Pearson correlation coefficient was calculated for grain sizes ranging from 450 to 700 μm (see Figure 7). Interestingly, for grain sizes outside the size distribution the Pearson correlations showed small negative correlation coefficients. Conversely, for grain sizes between 550 and 670 μm the Pearson correlation turns positive and reveals a strong dependency of sliding time on real area of contact i.e., the larger the Afr of the ski the larger the sliding time.
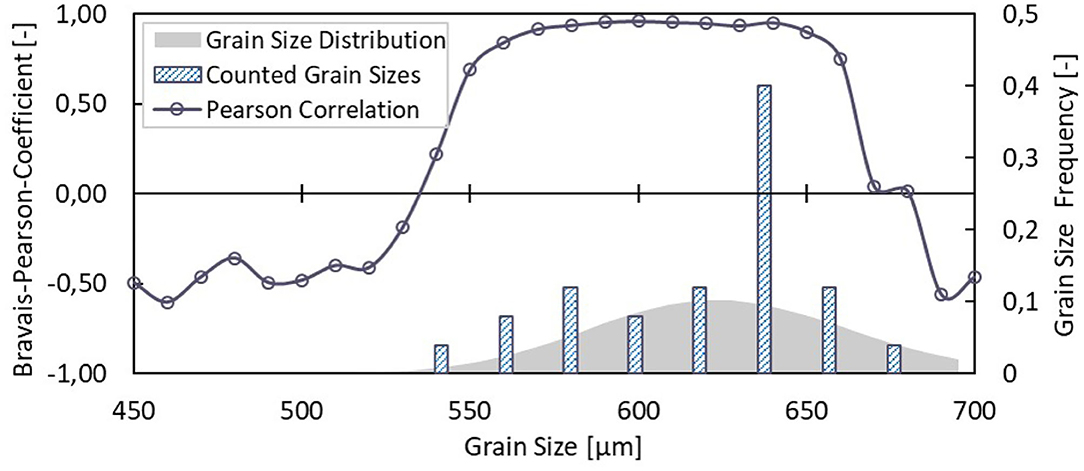
Figure 7. Pearson correlation coefficient (see Equation 10) as a function of grain size. The gray colored area and the histogram illustrates the grain size distribution calculated from the grain sizes measured by snow microscopy (see Figure 5). For each grain size, the fractional contact areas between grain and ski sole topographies is calculated and a Pearson correlation coefficient is determined (see Figure 6 which shows this relation exemplary for some grain sizes).
Finally, a grain size averaged fractional contact area is calculated by
where f(D) describes the grain size distribution in Equation (12), D the grain size diameter and Afr(D) the real contact area for a grain with diameter D. Figure 8 displays the relation of 〈Afr〉 and the dimensionless sliding time. An rPear of 0.93 marks a significant correlation (see Figure 8). This result underlines the usefulness of the contact model developed in this article for loose granular snow in contact with ski grinding structures. It also highlights the apparent grain size as a decisive factor to predict ranking of sliding times and that the grinding structure has to be matched to the grain radii.
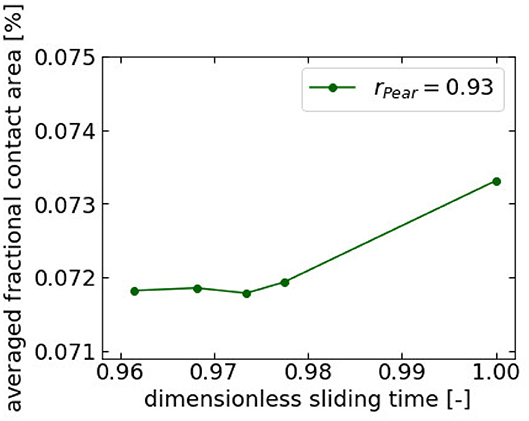
Figure 8. Average fractional contact area as a function of dimensionless sliding time. The fractional area of contact Afr(D) is averaged using the normalized grain size distribution f(D). This yields 〈Afr〉; see Equation (13). The inset shows the corresponding Pearson correlation coefficient. Note, the similarity to Figure 6A.
5. Discussion and Conclusions
The aim of this work was to quantify the influence of the ski base microtopography on the sliding performance of cross country ski. Since the correlations between standard 3D roughness parameters with the skis' sliding times turned out to be insignificant, we focused our attention on the real area of contact. This was achieved using a simple contact mechanical approach for snow close to the melting point. For the prevailing snow conditions at an experimental temperature of −2°C the snow can be modeled by an ensemble of freely-moving snow grains. At this temperature, the Young's modulus of ice is ~9,500 MPa, while the ice hardness has been estimated by Poirier's constitutive equation to be 15.9 MPa. These values have to be compared to the mechanical properties of the ski base material (UHMWPE) which has a Young's modulus of 840 MPa and a hardness of 42.3 MPa. Since the snow grains posses a much lower hardness than the polyethylene ski base, plastic deformations are restricted to the ice grains. In addition, the Young's modulus of the ice is rather large compared to its small hardness. In this case, our full contact mechanic calculations of the grinding structures in contact with a flat ice surface showed the same ranking as a calculation on a Bearing Model approach that neglects elasticity of the ice and takes only into account plastic deformations. Therefore, only purely plastic deformations of the ice grains were taken into account in our ski/snow contact model.
Snow was modeled as granular material consisting of single spherical ice grains with a certain grain radius. This model assumes that the single ice spheres are not connected by sinter necks and therefore the grains can freely organize and fill the valleys of the grinding structure. When the ensemble of grains has adapted to the ski surface topography, individual grains in the top layer carry the load of the skier and the related high local contact pressure result in a plastic deformation of the top grains. The interfacial area between the grinding structure and a deformed ice sphere can be calculated by simple geometrical considerations. This provides an estimate of the fractional real area of contact for a single grain at lateral position (x, y). The total fractional real area of contact can be determined by an average over the individual after scanning the lateral position (x, y) of the ski topography with the ice sphere.
It could be shown that grain size in this simple bearing model has a crucial impact on the qualitative relation between the sliding times and the calculated real area of contact of the ski/snow interface. While for the experimental grain radii (observed in the experimental snow) a significant correlation could be found, for radii outside the experimental grain size distribution the correlation was insignificant. This observation could hint toward a general design rule for ski microtopographies. It seems to be beneficial when the spatial scale of the grinding structure can be adapted to the prevailing sizes of the ice grains in the snow. However, considering the small number of tested structures and the neglect of other important snow parameters (such as grain shape), the results in this article represent only a first glimps on such a design rule. In future, more ski structures and a broader variety of test conditions should be considered in order to corroborate our first qualitative results and to elucidate further the relation between the microscopic properties of the snow and the ski microtopography.
Data Availability Statement
The raw data supporting the conclusions of this article will be made available by the authors, without undue reservation.
Author Contributions
The article was written by MSc and MM. All computations were performed by MSt. All authors contributed to the article and approved the submitted version.
Conflict of Interest
The authors declare that the research was conducted in the absence of any commercial or financial relationships that could be construed as a potential conflict of interest.
Acknowledgments
The authors acknowledge Thierry Langer and Sigmar Holland-Moritz for their effort in ski tunnel testing.
References
Böttcher, R., Seidelmann, M., and Scherge, M. (2017). Sliding of UHMWPE on ice: experiment vs. modeling. Cold Regions Sci. Technol. 141, 171–180. doi: 10.1016/j.coldregions.2017.06.010
Bowden, F. P., and Hughes, T. (1939). The mechanism of sliding on ice and snow. Proc. R. Soc. Lond. Ser. A Math. Phys. Sci. 172, 280–298. doi: 10.1098/rspa.1939.0104
Fellin, W. (2013). Einfuhrung in Eis-, Schnee-und Lawinenmechanik. Berlin; Heidelberg: Springer–Verlag.
Hertz, H. (1882). Ueber die berührung fester elastischer körper. J. Reine Angew. Math. 1882, 156–171. doi: 10.1515/crll.1882.92.156
Ho, H. S., Bigerelle, M., Vincent, R., and Deltomb, R. (2016). Correlation between process condition of sandblasting and surface texture: a multi-scale approach. Scanning 38, 191–201. doi: 10.1002/sca.21254
Makkonen, L., and Tikanmäki, M. (2014). Modeling the friction of ice. Cold Reg. Sci. Technol. 102, 84–93. doi: 10.1016/j.coldregions.2014.03.002
Nakamura, T., Abe, O., Hasegawa, T., Tamura, R., and Ohta, T. (2001). Spectral reflectance of snow with a known grain-size distribution in successive metamorphism. Cold Reg. Sci. Technol. 32, 13–26. doi: 10.1016/S0165-232X(01)00019-2
Pastewka, L., Sharp, T. A., and Robbins, M. O. (2012). Seamless elastic boundaries for atomistic calculations. Phys. Rev. B 86:075459. doi: 10.1103/PhysRevB.86.075459
Petrovic, J. (2003). Review mechanical properties of ice and snow. J. Mater. Sci. 38, 1–6. doi: 10.1023/A:1021134128038
Poirier, L., Lozowski, E. P., and Thompson, R. I. (2011). Ice hardness in winter sports. Cold Reg. Sci. Technol. 67, 129–134. doi: 10.1016/j.coldregions.2011.02.005
Popov, V. L. (2010). Contact Mechanics and Friction. Berlin; Heidelberg: Springer-Verlag. doi: 10.1007/978-3-642-10803-7
Schulson, E. M. (1999). The structure and mechanical behavior of ice. Jom 51, 21–27. doi: 10.1007/s11837-999-0206-4
Shapiro, L., Johnson, J., Sturm, M., and Blaisdell, G. (1997). Snow Mechanics–Review of the State of Knowledge and Applications. Report 97-3. US Army CRREL, Hanover, NH. doi: 10.21236/ADA330695
Theile, T., Szabo, D., Luthi, A., Rhyner, H., and Schneebeli, M. (2009). Mechanics of the ski-snow contact. Tribol. Lett. 36, 223–231. doi: 10.1007/s11249-009-9476-9
Keywords: sliding friction, topography, experiment, simulation, contact mechanics
Citation: Scherge M, Stoll M and Moseler M (2021) On the Influence of Microtopography on the Sliding Performance of Cross Country Skis. Front. Mech. Eng. 7:659995. doi: 10.3389/fmech.2021.659995
Received: 28 January 2021; Accepted: 01 April 2021;
Published: 04 May 2021.
Edited by:
Igor Velkavrh, V-Research, AustriaReviewed by:
Andras Vernes, Vienna University of Technology, AustriaJoichi Sugimura, Kyushu University, Japan
Copyright © 2021 Scherge, Stoll and Moseler. This is an open-access article distributed under the terms of the Creative Commons Attribution License (CC BY). The use, distribution or reproduction in other forums is permitted, provided the original author(s) and the copyright owner(s) are credited and that the original publication in this journal is cited, in accordance with accepted academic practice. No use, distribution or reproduction is permitted which does not comply with these terms.
*Correspondence: Matthias Scherge, bWF0dGhpYXMuc2NoZXJnZUBpd20uZnJhdW5ob2Zlci5kZQ==
 Matthias Scherge
 Melissa Stoll
