 Iakov A. Lyashenko
 Qiang Li
 Valentin L. Popov
94% of researchers rate our articles as excellent or good
Learn more about the work of our research integrity team to safeguard the quality of each article we publish.
Find out more
ORIGINAL RESEARCH article
Front. Mech. Eng., 24 March 2021
Sec. Tribology
Volume 7 - 2021 | https://doi.org/10.3389/fmech.2021.658858
This article is part of the Research TopicAdhesion: Visualization, Understanding, and DesignView all 5 articles
We investigate experimentally and numerically the influence of chemical heterogeneity and of third-body particles on adhesive contact. Chemical heterogeneity is generated by chemical treatment of the contacting bodies changing locally the surface energy. For studying the influence of the third body, two types of particles are used: sand particles with various geometrical shapes and sizes, and steel spheres of equal radius. Dependencies of the normal force on the indentation depth at both indenting and pull-off as well as the evolution of the contact configuration are investigated. Corresponding numerical simulations are carried out using the boundary element method (BEM).
Adhesion can strongly affect the contact properties (Pocius, 2012; da Silva et al., 2020). It determines the bonding strength of an adhesive contact and significantly influences the static and the dynamic friction. In technological processes, adhesion plays a decisive role in soldering, welding, surface gluing, granulation processes, etc. The first theory of adhesion of elastic bodies was formulated by Johnson et al. (1971), known as JKR theory. In JKR, it is assumed that adhesion forces only act inside the area of contact. In 1975, Derjaguin et al. proposed another theory (DMT theory) describing the case of long-range adhesive forces (Derjaguin et al., 1975) but disregarding elastic deformation caused by adhesion forces. The JKR and DMT theories are limiting cases of the general situation. Maugis illustrated the transition from one limiting case to the other in a case of a simple model interaction potential with finite action range (Maugis, 1992). In the last years, especially the influence of roughness on the adhesive properties was in focus of investigations (Guduru, 2007; Pastewka and Robbins, 2014; Papangelo and Ciavarella, 2017; Li et al., 2019; Lyashenko and Pohrt, 2020). In particular, it was shown that roughness can both reduce and increase the adhesion of surfaces, which can be used for developing systems with controllable adhesive properties. Furthermore, adhesive contact has been investigated by taking other effects into account such as surface tension (Karpitschka et al., 2016) or adhesion in presence of a liquid (Charlaix and Crassous, 2005), as well in tangential motion (Waters and Guduru, 2010; Salehani et al., 2018; Papangelo et al., 2019).
In many technical applications, surfaces of contacting bodies may be contaminated, or micro wear particles could be generated in the interface. This leads to a significant change in the chemical and mechanical properties of surfaces. Recently a series of experimental studies on the influence of surface roughness, duration of contact and oscillating load on adhesive contact has been carried out (Lyashenko and Pohrt, 2020; Lyashenko and Popov, 2020a,b). Using a similar experimental setup, we investigate the effect of the chemical heterogeneities of the contacting surfaces as well as of solid particles in the contact zone on adhesive properties. For all experimentally investigated cases, simulation results are correspondingly presented for comparison. Numerical simulations are carried out using the boundary element method (BEM) for the JKR-type adhesive contact of layered systems. The details on this method can be found in reference (Li et al., 2020).
In experiment, a displacement-controlled indenter was indented into an elastomer and then pulled-off. As indenter a steel sphere cap with radius R = 100 mm was used. Its smooth surface was processed with P800 sandpaper to obtain diffuse reflection from lighting system, because diffuse reflection provides better visualization of difference between contact and noncontact area. As elastomer, an optically transparent rubber sheet (TARNAC CRG N3005) with the size of 100 mm × 100 mm and thickness of h = 5 mm (10 mm in the case of micro steel spheres) was used. Compared with hardened aqueous gelatin solution used in Popov et al. (2017), chemical and mechanical properties of this rubber remain unchanged for a long time. This allows carrying out of extended series of experiments with the same sample. On the bottom side, the rubber sheet sticks strongly to a smooth silicate glass. Under the glass a video camera was mounted for recording the development of the contact configuration.
Figure 1 shows the experimental device used for experiments. Aluminum plate (2) was moved with the help of the precision linear stage PI L-511.24AD00 (1) in the normal direction. Its movement was controlled by controller PI C-863 (10). The indenter (4) was attached to the plate over the force sensor ME K3D40 (3). The contact area was observed from below with a digital camera (9) with resolution of 1,600 × 1,200 pixels. Experiments were carried out under condition of controlled displacement and a constant velocity of v = 1 μm/s or less was used in all experiments. The normal force was measured by the force sensor (3) with amplifier GSV-1A4, which was connected to a PC with 16-bit NI USB-6211 analog to digital converter. The rubber layer (6) could be tilted around two horizontal axes with a tilted mechanism (8). Rubber layer was located on silicate glass plate (7). The control, data storage and processing were carried out within a LabVIEW computer program. The lighting of the contact area was realized using 80 LEDs which illuminated the contact zone from all four sides (5). Because the light enters the rubber at low angle, a good contrast between contact and non-contact zones could be achieved.
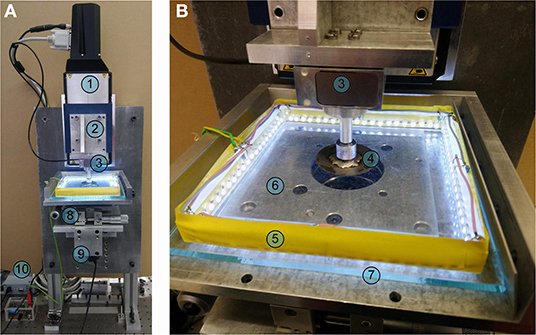
Figure 1. Experimental device: (A) general view; (B) contact zone between the steel indenter and 5 mm thick transparent rubber layer placed on the glass plate.
In the present work, adhesive contacts of the following three systems have been studied experimentally:
(1) Contact of chemically heterogeneous surfaces. Parts of the surface of the indenter were etched in a solution of ferric chloride FeCl3 for 1–2 min while other remained non-treated. After that, the surface was cleaned by water and alcohol consequently, and then was dried by a compressed air jet. The etched areas showed a significant increase in adhesive strength.
(2) Contact in the presence of sand particles. These particles have various sizes (diameter changing from ~0.1 to 1 mm) and shapes and were placed on the rubber sheet before the experiment.
(3) Contact in the presence of steel spheres. Steel spheres with equal diameter of D = 1 mm were placed on the surface of rubber before starting indentation.
Experimental procedure was the same in all these cases: The indenter was pressed into the rubber sheet and pulled off, both with a very low velocity of v ≤ 1 μm/s, so that the contact could be considered as quasi-static at all times. Data including photographs of the contact configuration, value of normal force and indentation depth were collected every second.
As a reference system, we first consider the case of the spherical indenter with a chemically homogeneous surface. The indenter was pressed with velocity of v = 1 μm/s into the rubber sheet to a depth of dmax = 0.35 mm, and then pulled off. After complete detachment, the indenter was moved quickly to zero indentation depth d = 0 mm, and cycle was repeated three times. The dependencies of the normal force, the contact area and the contact stiffness on indentation depth are shown in Figure 2 with solid lines. Different colors correspond to three indentation cycles. It is seen that these curves merge into a single one, so this experiment has a good repeatability. In Figure 2C, the contact stiffness is shown only for the first indentation cycle.
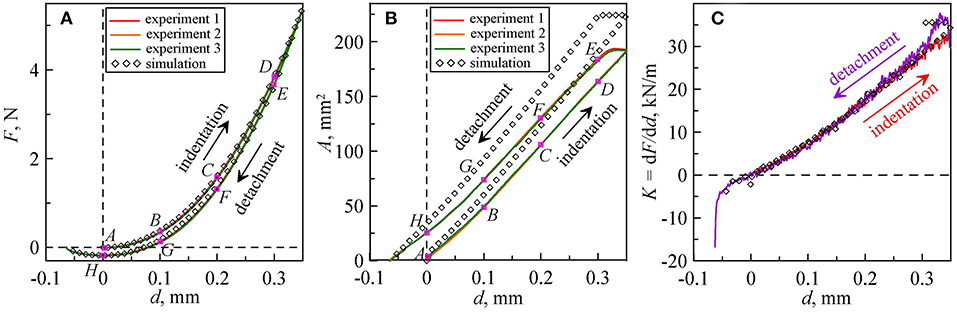
Figure 2. Dependencies of (A) normal force, (B) contact area, and (C) contact stiffness on indentation depth in a contact between a steel ball with radius of R = 100 mm and a rubber sheet with thickness h = 5 mm. Solid lines are experimental results for three consecutive loading cycles; symbols are results of numerical simulations. Panel (C) shows dependence of contact stiffness only for the first indentation cycle.
It is clearly seen that the curves at indenting and pull-off phases are different. Similar behavior has been observed in many experiments on different scales, from AFM experiments to macroscopic engineering contacts (Greenwood, 2017; Dalvi et al., 2019; Deng and Kesari, 2019a,b; Lyashenko and Popov, 2020a,b). One of the explanations for this behavior is the chemical heterogeneity of the indenter surface (Popov, 2021). Such a hysteresis in the indenting and pull-off process can be described using the JKR solution by introducing two different values of effective specific work of adhesion γeff. Let us denote the effective surface energy in the indentation phase as γ0, and in the separation phase γ1. From experimental results shown in Figure 2, it follows that γ0 < γ1. It should be noted that after the turning point (from approach to pull-off), the contact area and the contact stiffness remain approximately constant in some interval of indentations which already has been shown earlier in Lyashenko and Popov (2020b). This “pinning” of the contact area is due to the friction force acting on the border line. It is this friction force which leads to dissipation of mechanical energy in an oscillating contact (Lyashenko and Popov, 2020b). Since the indenter moved very slowly, viscoelastic effects cannot be the reason for such significantly pronounced hysteresis behavior. A video of this experiment can be found in the Supplementary Video 1. In Figure 2, the symbols show the results of numerical simulations with the BEM for the layered system (Li et al., 2020). In simulation the elastic modulus E = 0.283 MPa and Poisson's ratio ν = 0.47 of the layer were used. Layer thickness and radius of the spherical indenter were same as in experiment. The substrate under the elastic layer was considered as being rigid (E → ∞). The specific work of adhesion for the approach phase was found to be γ0 = 0.0175 J/m2, and for pull-off phase γ1 = 0.35 J/m2. The simulation results show a good agreement with the experiment, especially for the force-indentation depth relation (see Figure 2A). Some differences are observed in the dependence of the contact area A(d) shown in Figure 2B. The reason could be a deviation of the shape of indenter from the spherical one and non-homogeneous surface energy distribution over the contact area, which can be seen in Figure 3 at the non-circular shape of the contact area.
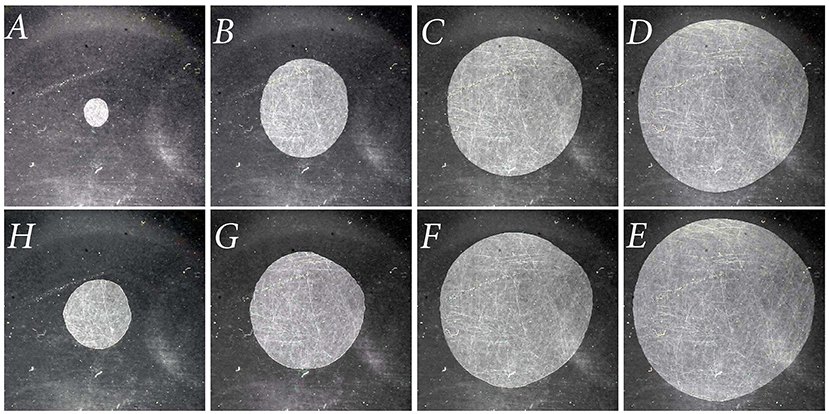
Figure 3. Snapshots of the contact configuration with size 17 mm × 17 mm corresponding to the stages in the first loading cycle in Figure 2. Panels (A–H) correspond to points A–H in Figure 2.
Figure 3 shows a few snapshots of the contact area in the indenting phase (A–D) and pull-off phase (E–H), corresponding to the points A–H marked in Figure 2. Pictures in the same column correspond to the same values of the indentation depth. Panel (A) corresponds to the moment of the first touch (d = 0 mm). The panel (H) also corresponds to d = 0 mm, but during the detachment process.
From both experimental and numerical results, it follows that the adhesive interaction in the indentation phase is very weak, so that one can use the non-adhesive contact to describe this process (Lyashenko and Popov, 2020a). Another observed feature is that the contact region and the value of the contact area almost do not change at the beginning of the pull-off, in a certain interval of indentation depths (Figure 2B). If the indenter oscillates in such a range of indentation depths, the force-indentation depth curve will follow the same line and there will be no dissipation of mechanical energy (Lyashenko and Popov, 2020b).
In this experiment, the part of indenter surface was treated with a solution of ferric chloride FeCl3 for 2 min for obtaining different surface properties. The shape of this area can be seen in the snapshot A of Figure 4 with darker color. In the experiment, the treated areas of the indenter showed increased strength of adhesive contact. The maximal indentation depth and velocity of movement are same as in the previous case. The dependences of the normal force on the indentation depth for four loading cycles are shown in Figure 4a.
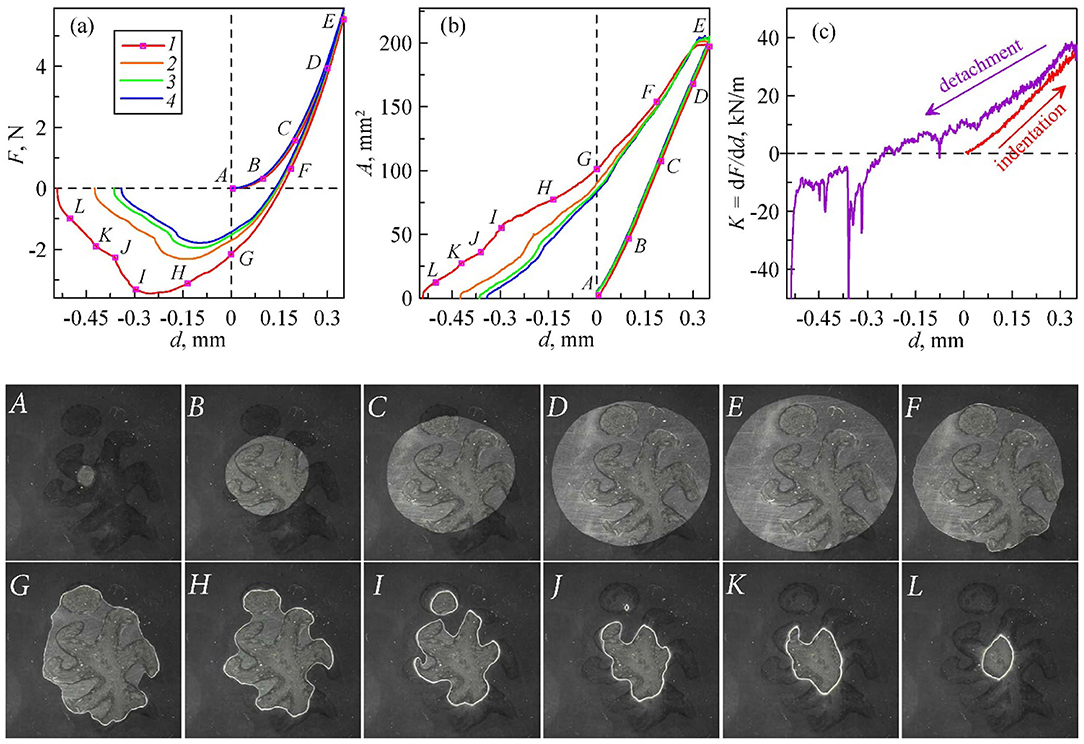
Figure 4. Dependences of (a) the normal force, (b) contact area, and (c) contact stiffness on indentation depth in indentation test of a steel ball with chemically heterogeneous surface into a rubber sheet. Solid lines with different colors show the results of four cycles in a series. Contact stiffness is shown only for the first indentation cycle. The lower part of the figure shows snapshots of contact area with size 17mm × 17mm for the first indentation cycle. These images correspond to the points marked with the same letters in subplots (a) and (b).
One can see that a freshly prepared surface shows the maximum adhesive strength in the first cycle and the adhesive strength significantly decreases in the following cycles, probably due to the oxidation and contamination of the indenter surface after its interaction with the elastomer. A similar feature was observed in the experiments on rough contacts (Lyashenko and Pohrt, 2020). The size of contact area was evaluated by analysis of the contact images. Figure 4b shows that a decrease in adhesion strength is accompanied by a decreasing in the contact area. The contact stiffness for the first indentation cycle is shown in Figure 4c, from which it follows that stiffness increases monotonically during the indentation phase. In all cases, contact spreads smoothly in the indenting phase, despite the fact that the indenter has non-homogeneous surface energy distribution. But during detachment, jump-like changes appear. The lower part of Figure 4 shows 12 images of the contact area for the first indentation cycle. All images are marked with letters corresponding to the points shown in Figures 4a,b. Images (A–E) correspond to the indenting phase, and (E–L) to pull-off. In these photos, the points A and G correspond to the same indentation depth d = 0 mm.
Comparing with the previous case, it is found that in the indenting phase, the contact behavior in both homogeneous and non-homogeneous cases are qualitatively and quantitatively the same. This means, that heterogeneity of surface energy does not lead to a change in the nature of the propagation of the contact region. Obviously, the force of friction acting on the boundary line is larger than the driving force due to adhesion, so that the propagation of the boundary line is completely impeded, unless new contact regions come into contact due to normal indentation. This means, that the approach phase corresponds in our experiments to a practically non-adhesive contact. And it can be indeed described well by the Hertz' solution.
Consider now the detachment phase. The force of adhesion, |Fmin| = 3.45 N, is in this case much larger than that in the homogeneous case, |Fmin| = 0.19 N, (see Figure 2). The chemically treated areas of the indenter surface show much higher adhesive strength. The contact areas shrink slower in these regions during the pull-off (snapshots E–L in Figure 4). The contact area may become disconnected as shown in snapshot I in Figure 4.
Another significant difference from the homogeneous case is that the detachment curves are different in four cycles: the adhesive strength was reduced gradually in the following three repeated experiments (Figure 4a). The possible reason is the contamination of the indenter surface. Initially, the rubber sheet “sees” the high energy surface treated with the FeCl3 solution. But after the subsequent cycles, the surface should have been changed due to the interaction with the rubber. There are data, that the rubber molecules can remain on the hard surface after opening of an adhesive contact (Gong et al., 2019). The video of this experiment can be found in the Supplementary Video 2.
For simulations, the same shape of chemically treated zone was used as in experiment, as shown in Figure 5 picture A in red. The elastic modulus, Poisson's ratio, thickness of the layer, and the radius of spherical indenter were same as in the case of homogeneous surface. From the experiment, it is found that the contact in the indenting process is repeatable and could be roughly described by (almost) non-adhesive contact, so we used a very small and uniform value of specific work of adhesion γ0 = 0.0175 J/m2 for the whole region to simulate the indenting process, as it was done in the homogeneous case. For the pull-off, the values of specific work of adhesion, in the “untreated” region γ1 and “treated” region γ2 in detachment phase were chosen to fit the adhesive forces (absolute value of minimal negative normal force) FA=|Fmin| to the values obtained in experiment: γ1 = 0.8 J/m2, and γ2 = 16γ1, 10γ1, 8γ1, and 6.5γ1, respectively for the four consecutive cycles.
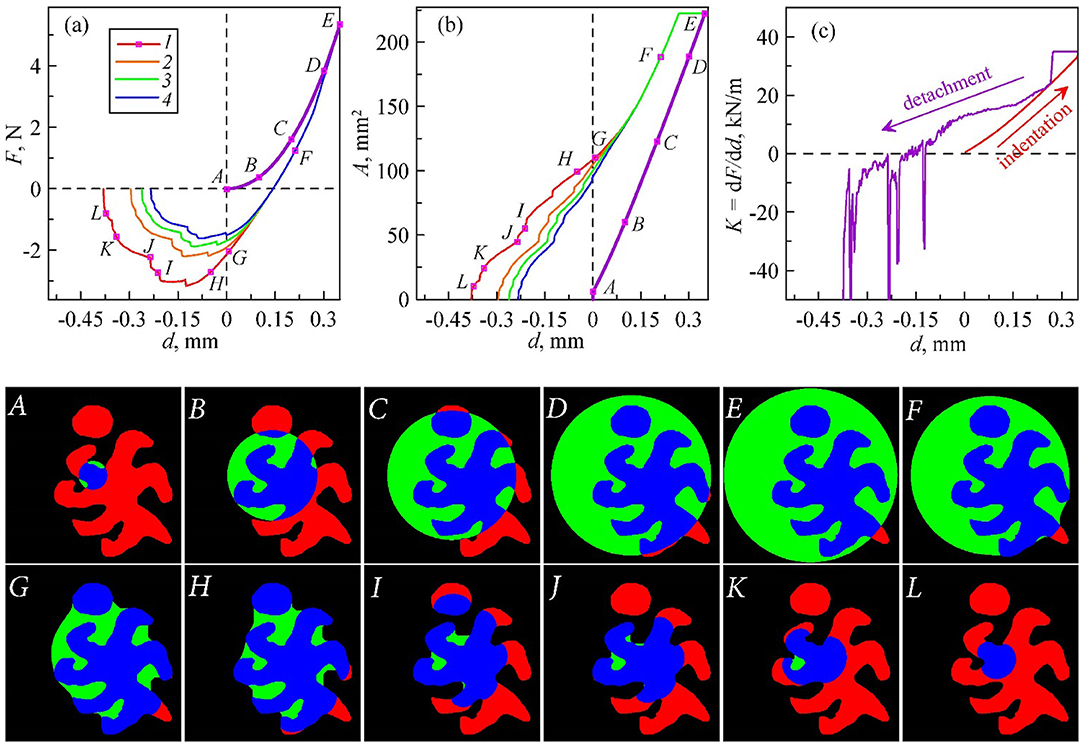
Figure 5. Numerical simulation corresponding to the experiment in Figure 4. Considered is a non-homogeneous distribution of the indenter surface energy. Dependence of: (a) normal force, (b) contact area, and (c) contact stiffness on the indentation depth. The images below show the evolution of contact zone in different colors: black—noncontact area with smaller surface energy; red—noncontact area with larger surface energy; green—contact area with smaller surface energy; blue—contact area with larger surface energy.
The dependences of normal force, contact area and the contact stiffness on indentation depth are shown in Figures 5a–c. The ranges of the axes are the same as in the Figure 4 showing experimental results. Pictures below are contact configurations at several states, A–E for indenting and E–L for pull-off. Noncontact areas are shown in black and red where black corresponds to the region with smaller work of adhesion and red to the larger one. Contact area is shown in green and blue where green corresponds to the region with smaller work of adhesion and blue to the larger one. It is noted that the states A–E for indenting correspond to the same indentation depths as in experiment, but E–L for pull-off not. It is found that detachment in the simulation is faster than in experiment.
Simulation results (Figure 5) show a good quantitative agreement with experiment (see Figure 4). However, there are some minor deviations. In the simulation, complete detachment occurs at lower values of |d|. A similar difference was also observed in experiments of detachment of indenters with a flat base of various shapes from the body of gelatin (Popov et al., 2017). In the simulation with increasing |d| the next stable contact configuration is calculated at points of contact instability immediately. But in experiment, system may need some time to reach a stable contact configuration. The video of this simulation can be found in the Supplementary Video 3.
Sand particles with various sizes and geometries were randomly located on the elastomer surface, as shown in Figure 6 picture A. The metal surface of the indenter was uniformly treated with the FeCl3 solution to obtain stronger adhesion. The results of four indentation cycles in a series are shown in Figure 6. It is noted that the contact area Arub shown in Figure 6 is only the area of direct contact between the rubber and the indenter because it is difficult to define the contact area between particles and rubber unambiguously from the images. The regions of direct contact of indenter and particles are also clearly distinguishable as the particles under loading are brighter than the unloaded ones.
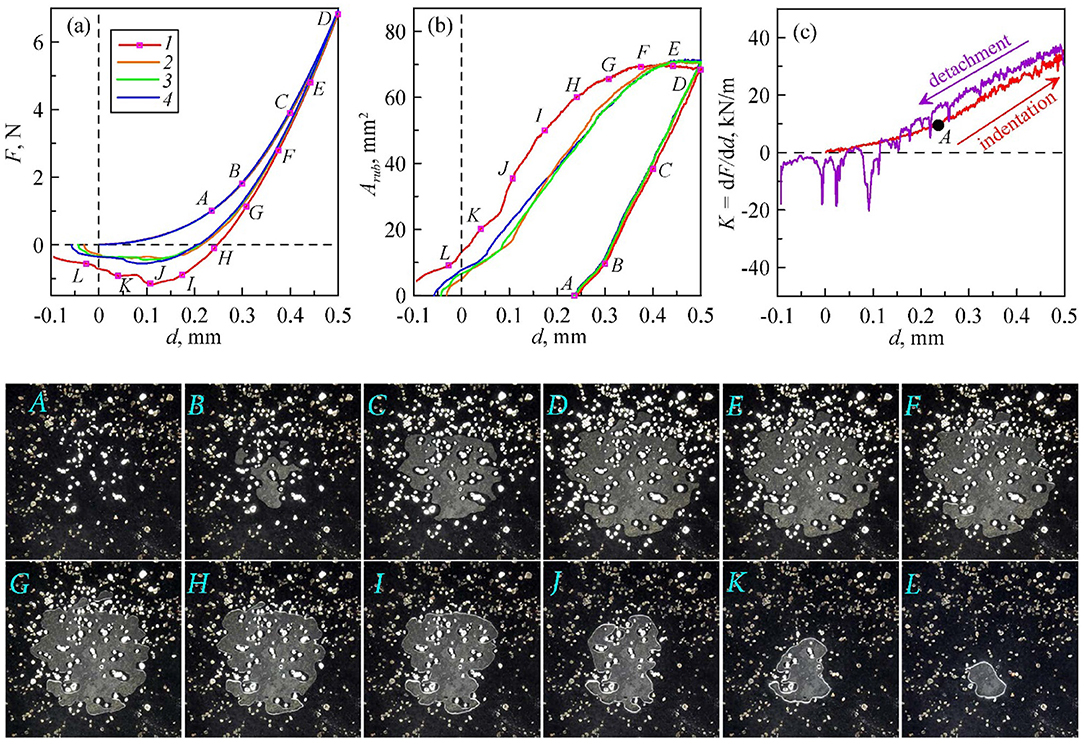
Figure 6. Experiment of indentation of a smooth steel sphere in a rubber sheet with sand particles in the interface. Dependences of: (a) the normal force, (b) contact area between elastomer and indenter, and (c) contact stiffness on indentation depth. Solid lines with different colors show the four experiments in a series. Contact stiffness is shown only for the first indentation cycle. The snapshots below show contact areas with size 17 mm × 17 mm for the first indentation cycle, corresponding to the points marked in panels (a,b).
In the first indentation phase up to the point A, the increasing number of particles comes into contact and the normal force and the contact stiffness increase (Figures 6a,c). However, up to some critical indentation, no direct contact between the indenter and the rubber is observed. Snapshot A in Figure 6 shows the contact before the first direct contact between the indenter and the rubber. The contact area Arub up to this point is zero (Figure 6b). The indenter is further indented to the depth d = 0.5 mm (point D on the curve). In this process, new contact areas form at different locations (see for example snapshot B). With increasing load, some areas merge and the gaps around the particles are reduced. The process of contact formation can be seen in the Supplementary Video 4.
The pull-off starts from the point D. It is seen that at the beginning of pull-off, the shape and the area of contact between the indenter and the elastomer, Arub, is practically unchanged (from point D to F). In the case of chemical heterogeneity, contact area also remained unchanged for a while; the same was valid for the contact stiffness (Figures 4, 5). But in the case of particles, the contact stiffness decreases almost immediately after the change in the direction of motion. This may indicate that the contact area with particles also gives a significant contribution to contact properties and that this area decreases while the contact area with rubber still remaining constant.
In the experiment, the indenter was lifted to the position d = −0.1 mm in all four cycles. As seen in Figure 6, in the first cycle the contact was still not completely detached at d = −0.1 mm, but it was detached in all subsequent cycles, due to a significant decrease in the effective adhesion strength. Interestingly, the second, third, and fourth indentation cycles show practically identical dependences of F(d) and Arub(d).
The BEM can of course be used not only for simulation of a contact of two elastic bodies but also for multi-body systems (Li, 2020). However, the simulation becomes very involved if many factors have to be considered at once, for example motion of particles, local friction and so on. In the described experiments on indentation, it is observed that the particles neither move in the tangential direction nor rotate (or these movement are negligible). Therefore, we use a simplified model to qualitatively describe the main effects observed in the experiment without considering complicated kinematical restrictions: we assume that in the indenting phase the particles are “welded” to the surface of indenter and pressed into the rubber together at the position and with the orientation they had without the contact. Further, we assume that there is no adhesion between the indenter and the particles. This is realized by setting zero the surface energy in the areas where particles are located.
The effective “roughness” due to particles was modeled as follows. By analyzing the image of the contact zone at the maximum indentation depth (shown in the snapshot D of Figure 6), the location of all particles and their shapes in the two-dimensional plane were determined. For each particle, we calculate its size of cross-sections by scanning the obtained 2D shape line by line in horizontal direction. Each cross-section was then replaced by a circle with the same area (and the diameter l), and then rescaled by multiplying with the factor 0.65, which was found empirically. Finally, the geometry of indenter was generated as a smooth sphere superposed by the above-described roughness.
Adhesive contact between such a rough indenter and a rubber layer was simulated by BEM with the following parameters: surface energy in indenting phase γ0 = 0.0175 J/m2, surface energy in the detachment phase γ1 = 5 J/m2 for non-particle area and γ2 = 0 J/m2 for particle area. For the second cycle of indentation, γ1 = 2.7 J/m2 was chosen to fit experimental data. In experiment, the last three cycles show little difference, therefore only 2 cycles were simulated.
The results of simulation are presented in Figure 7. They show good qualitative and quantitative agreement with experimental observations. In both tests, first not connected contact areas do appear, which merge during further indentation. The point A on curves and corresponding picture A in Figure 7 corresponds to the moment of the first direct contact between the indenter and the elastomer in the indentation phase. A video of this simulation can be found in Supplementary Video 5.
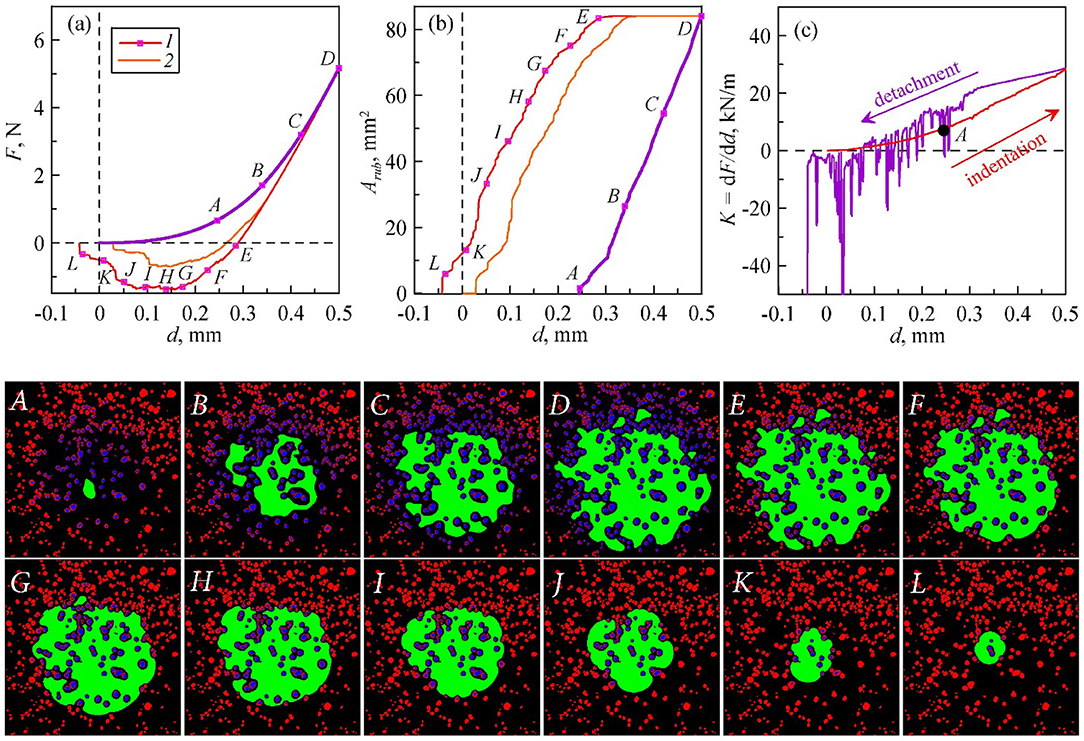
Figure 7. Simulation of adhesive contact of spherical indenter on elastomer layer with particles. Dependencies of normal force (a), contact area (b), and contact stiffness (c) on indentation depth. The images below show the contact zones in different colors: black—noncontact area without particles; red—noncontact area with particles; blue—contact area between elastomer and particles (asperities of indenter); green—direct contact region between elastomer and indenter.
In this experiment, 10 identical steel spheres with diameter 1 mm were located on the rubber sheet, near the center of indenter (snapshot A in Figure 8). The thickness of the elastomer was h = 10 mm. The results are shown in Figure 8.
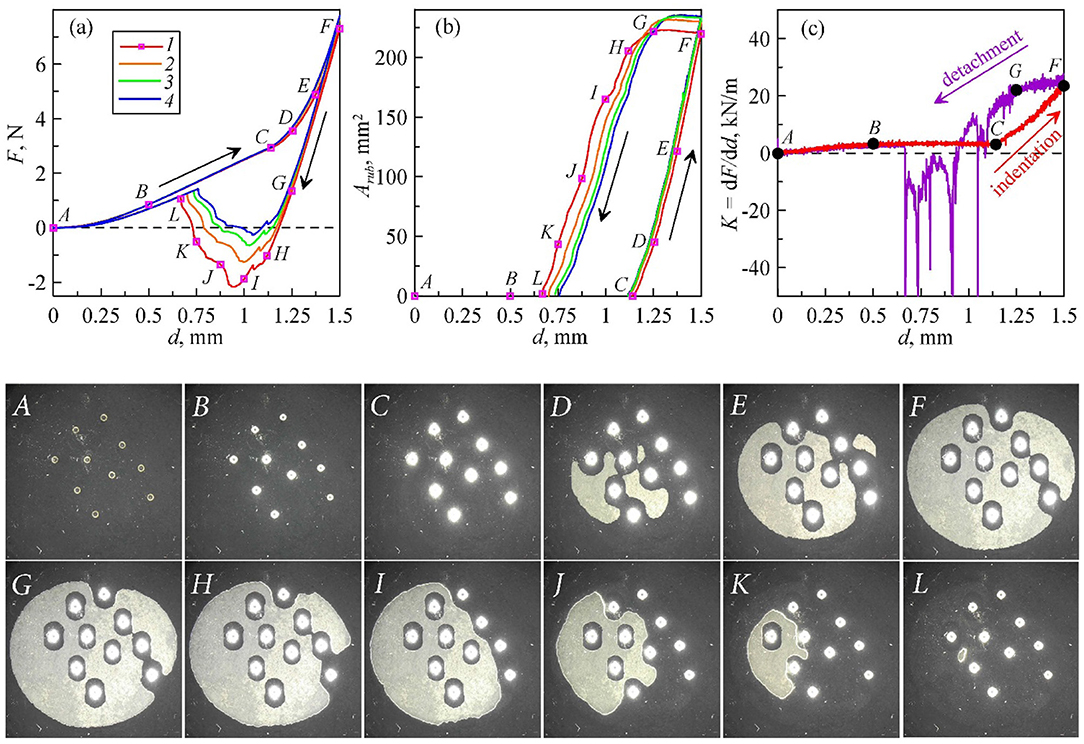
Figure 8. Experiment of indentation test with 10 identical micro steel spheres (diameter 1 mm). Dependences of the normal force (a), direct contact area between elastomer and indenter (b), and contact stiffness (c) on indentation depth d. Solid lines with different colors show the results of four cycles in a series. Dependence of contact stiffness is shown only for the first indentation cycle. The snapshots below show contact areas in a region with size 22 mm × 22 mm for the first indentation cycle.
During the indenting phase, all particles come into contact gradually, (from point A to B) while the contact stiffness increases in this stage. With an increasing load, these particles bear the load until the appearance of direct contact between the indenter and the elastomer (from point A to C). The contact stiffness in this interval B–C is constant [linear dependence of F(d)]. The last contact configuration before direct contact can be seen in the snapshot C. The indenting process continues to the point F and then begins the pull-off. Directly after reversing the direction of movement, from F to G, the contact area practically does not change, and the contact stiffness K is almost constant. The weak dependency of the stiffness on the indentation in this region could be caused by possible small movement of particles in the contact zone. The detachment of the indenter from rubber begins from the point G, and ends at point L. After that only particles are in contact with rubber.
It can be seen in Figure 8 that the curves in pull-off phase in the four cycles are different, which mainly caused by the change in surface energy. The video of this experiment can be seen in the Supplementary Video 6.
The corresponding simulations are similar to the case of sand particles. The elastomer thickness was h = 10 mm. The roughness of indenter was now modeled by the spheres with diameter 1 mm at the locations obtained from the experimental image. For the indenting phase, surface energy is set as γ0 = 0.0175 J/m2, and for pull-off γ1 = 7.5 J/m2 in the areas where no particle is located and γ2 = 0 J/m2 in the areas where particles are located. In the following three cycles γ1 = 6.0, 4.9 and 4.4 J/m2 correspondingly. Results are shown in Figure 9.
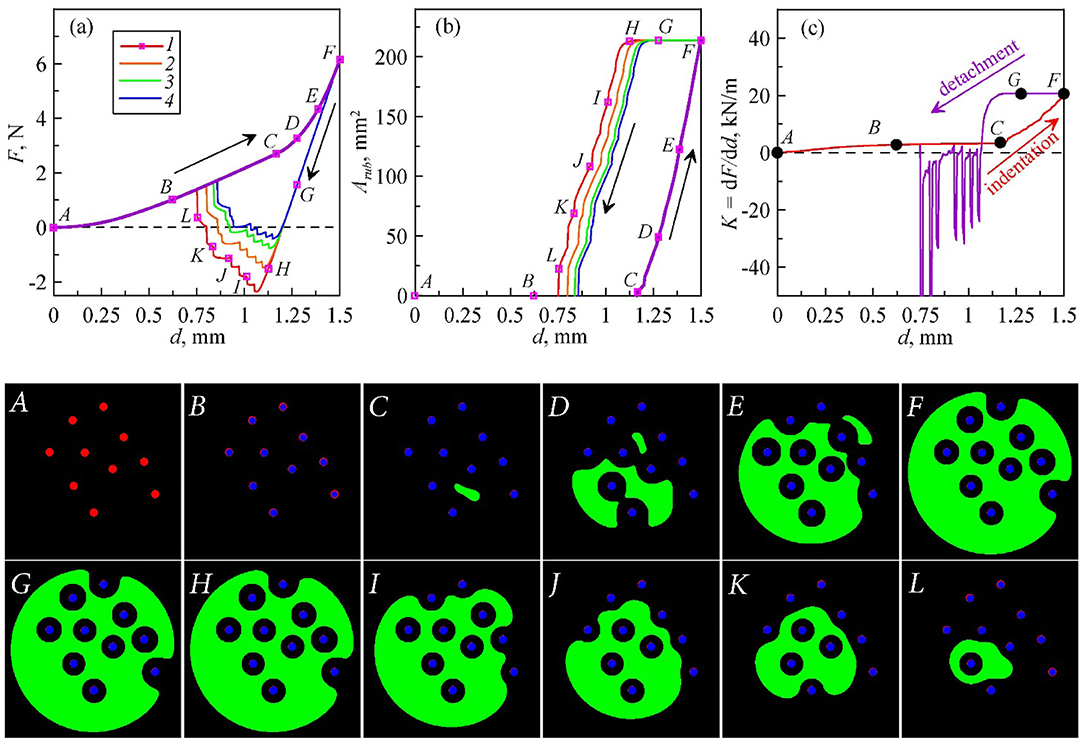
Figure 9. Simulation of adhesive contact between a spherical indenter and elastomer sheet with 10 identical micro particles. Dependencies of normal force (a), direct contact area (b), and contact stiffness (c) on indentation depth. Images below show evolution of contact zones in different colors: black—noncontact area without particles; red—noncontact area where particles located; blue—area of contact between elastomer and particles (asperities on the indenter surface); green—area of direct contact between elastomer and indenter.
Observing the curves and images, it is seen that simulation shows a contact behavior, which is very similar to that observed in experiment: in the indenting phase (A–F), particles come into contact and bear the load (A–C), then direct contact between indenter and elastomer appears (C–F); in pull-off (F–L), the area remains first unchanged (F–G), then detachment begins (G–L). Finally, there are only particles in contact with rubber (from about point L to end). The video of this simulation can be found in the Supplementary Video 7.
There is one interesting difference between the simulation and experiment. At the initial stage of indenting and the last detachment of pull-off, where only particles are in contact with elastomer, the F(d) curves in this part are reversible in simulation (since they correspond to the non-adhesive elastic contact). However, in experiment the F(d) curves in the pull-off phase a lower than that in the indentation phase even in the region without direct contact between indenter and elastomer. This behavior could be caused by adhesive interaction between particles and rubber sheet in experiment. Another reason could be some displacement of particles from the contact center induced by tangential force due to the curved indenter during the indenting.
We studied the effects of chemical heterogeneity of surfaces and of the presence of third-body particles in the contact zone on the adhesive contact of a rigid body on a soft layer. Independently on the case (chemically homogeneous, chemically heterogeneous surface, third-bodies particles in the interface), the influence of adhesion in the indenting process is very weak, so that the contact can practically be considered non-adhesive. During the detachment phase, on the contrary, these factors affect the contact behavior significantly. It was found that the strength of adhesion is maximal in the first indentation cycle and decreases in the subsequent cycles. The reason may be the change in the surface energy after contacting of bodies. In the chemically non-homogeneous case, the contact area during detachment shrinks first mainly in the area with lower surface energy, then the area with higher surface energy, while a series of instable transitions can be observed. All experiments were simulated using the BEM. The results shown a good agreement with experiment qualitatively and quantitatively thus showing that we have a correct basic understanding of the studied phenomena. However, there are also slight differences between experiment and simulations which can be awaited as we made a number of simplifying assumptions in modeling the interfacial particles.
The original contributions presented in the study are included in the article/Supplementary Material, further inquiries can be directed to the corresponding author/s.
VP conceived the study and carried out theoretical analysis of results. IL carried out experiments. IL and QL carried out numerical simulations. All authors drafted and reviewed the manuscript.
We acknowledge the financial support of the Deutsche Forschungsgemeinschaft (DFG PO 810/55-1). This work was partially supported by the Tomsk State University competitiveness improvement programme. We also acknowledge the support by the Open Access Publication Fund of TU Berlin.
The authors declare that the research was conducted in the absence of any commercial or financial relationships that could be construed as a potential conflict of interest.
The Supplementary Material for this article can be found online at: https://www.frontiersin.org/articles/10.3389/fmech.2021.658858/full#supplementary-material
Supplementary Video 1. Video of experiment for indentation of a steel ball (indenter) with radius 100 mm in a transparent rubber sheet TARNAC CRG N3005 with thickness of h = 5 mm. The velocity of indenter motion is 1 μm/s. Panels from left to right show the contact configuration and the dependencies of normal force and contact area on the indentation depth. In the images of contact area, the experiment duration in seconds is shown. Three consecutive indentation cycles are shown. The video corresponds to Figures 2, 3.
Supplementary Video 2. Video of experiment for indentation of a steel ball (indenter) with radius 100 mm in a transparent rubber sheet TARNAC CRG N3005 with thickness of h = 5 mm. The velocity of indenter motion is v = 1 μm/s. The indenter surface had a heterogeneous distribution of surface energy. Heterogeneities were caused by the chemical treatment of some area of the indenter surface with ferric chloride FeCl3. Panels from left to right show the contact configuration and the dependencies of normal force and contact area on the indentation depth. In the pictures of contact area, experiment duration in seconds is shown. Four consecutive indentation cycles are shown. The movie corresponds to Figure 4.
Supplementary Video 3. Video of simulation for indentation of rigid sphere with radius 100 mm in an elastic layer with thickness of h = 5 mm, Young modulus E = 0.283 MPa and Poisson's ratio ν = 0.47. Panels from left to right show the contact configuration and dependencies of normal force and contact area on the indentation depth. Specific work of adhesion at the indenting stage was homogeneously distributed with a small value γ0 = 0.0175 J/m2. In the stage of pull-off, specific work of adhesion in the untreated region was given by γ1 = 0.8 J/m2 and in the treated region γ2 = 16γ1, 10γ1, 8γ1, 6.5γ1 for the four subsequent cycles. Contact zones are shown in different colors: black—noncontact area with γ1; red—noncontact areas with γ2; green—contact areas with γ1; blue—contact areas with γ2. The movie corresponds to Figure 5.
Supplementary Video 4. Video of experiment for indentation of a steel ball (indenter) with radius 100 mm in a transparent rubber sheet TARNAC CRG N3005 with thickness of h = 5 mm. The velocity of indenter motion is v = 1 μm/s. Sand particles with different sizes and shapes were located on rubber; Panels from left to right show the contact configuration and the dependencies of normal force and direct contact area between indenter and elastomer on the indentation depth. In the dependencies of contact area, the experiment duration in seconds is shown. The movie corresponds to Figure 6.
Supplementary Video 5. Video of simulation for indentation of rigid sphere with radius 100 mm in an elastic layer with thickness of h = 5 mm, Young modulus E = 0.283 MPa and Poisson's ratio ν = 0.47. Solid particles with different geometrical shapes are located on the elastomer. Panels from left to right show the contact configuration and the dependencies of normal force and direct contact area between indenter and elastomer on the indentation depth. Surface energy in the indenting process is very small γ0 = 0.0175 J/m2. In the pull-off phase, it is zero in the region where particles are located and γ1 = 5 J/m2 in the remaining region. In the second cycle, γ1 = 2.7 J/m2. Contact zones are shown in different colors: black—noncontact area where no particle located; red—noncontact areas where particles located; green—area of direct contact between elastomer and indenter; blue—area of contact between indenter and particles. The movie corresponds to Figure 7.
Supplementary Video 6. Video of experiment for indentation of a steel ball (indenter) with radius 100 mm in a transparent rubber sheet TARNAC CRG N3005 with thickness of h = 10 mm. The velocity of indenter movement is v = 0.676 μm/s. Ten identical steel spheres with diameter 1 mm were located on the rubber. Panels from left to right show the contact configuration and the dependencies of normal force and direct contact area between indenter and elastomer on the indentation depth. In the dependencies of the contact area, the experiment duration in seconds is shown. The video corresponds to Figure 8.
Supplementary Video 7. Video of simulation for indentation of rigid sphere with radius 100 mm in an elastic layer with thickness of h = 10 mm, Young modulus E = 0.283 MPa and Poisson's ratio ν = 0.47. Ten identical micro steel spheres with diameter 1 mm were located on the rubber. Panels from left to right show the contact configuration and the dependencies of normal force and direct contact area between indenter and elastomer on the indentation depth. Surface energy in the indenting process is very small, γ0 = 0.0175 J/m2. In the pull-off phase, it is zero in the region where particles are located and γ1 = 7.5 J/m2 in the remaining region. In the subsequent three cycles γ1 = 6.0, 4.9 and 4.4 J/m2. Contact zones are shown in different colors: black—noncontact area where no particle located; red—noncontact areas where particles located; green—area of direct contact between elastomer and indenter; blue—area of contact between indenter and particles. The movie corresponds to Figure 9.
Charlaix, E., and Crassous, J. (2005). Adhesion forces between wetted solid surfaces. J. Chem. Phys. 122:184701. doi: 10.1063/1.1886732
da Silva, L. F. M., Öchsner, A., and Adams, R. D. (2020). Handbook of Adhesion Technology. Cham: Springer International Publishing: Imprint: Springer.
Dalvi, S., Gujrati, A., Khanal, S. R., Pastewka, L., Dhinojwala, A., and Jacobs, T. D. B. (2019). Linking energy loss in soft adhesion to surface roughness. Proc. Natl. Acad. Sci. U.S.A. 116:25484. doi: 10.1073/pnas.1913126116
Deng, W., and Kesari, H. (2019a). Depth-dependent hysteresis in adhesive elastic contacts at large surface roughness. Sci. Rep. 9:1639. doi: 10.1038/s41598-018-38212-z
Deng, W., and Kesari, H. (2019b). Effect of machine stiffness on interpreting contact force-indentation depth curves in adhesive elastic contact experiments. J. Mech. Phys. Solids 131, 404–423. doi: 10.1016/j.jmps.2019.07.009
Derjaguin, B. V., Muller, V. M., and Toporov, Y. P. (1975). Effect of contact deformations on the adhesion of particles. J. Colloid Interface Sci. 53, 314–326. doi: 10.1016/0021-9797(75)90018-1
Gong, L., Xiang, L., Zhang, J., Chen, J., and Zeng, H. (2019). Fundamentals and advances in the adhesion of polymer surfaces and thin films. Langmuir 35, 15914–15936. doi: 10.1021/acs.langmuir.9b02123
Greenwood, J. A. (2017). Reflections on and extensions of the Fuller and Tabor theory of rough surface adhesion. Tribol. Lett. 65:159. doi: 10.1007/s11249-017-0938-1
Guduru, P. R. (2007). Detachment of a rigid solid from an elastic wavy surface: theory. J. Mech. Phys. Solids 55, 445–472. doi: 10.1016/j.jmps.2006.09.004
Johnson, K. L., Kendall, K., and Roberts, A. D. (1971). Surface energy and the contact of elastic solids. Proc. R. Soc. Lond. A 324, 301–313. doi: 10.1098/rspa.1971.0141
Karpitschka, S., van Wijngaarden, L., and Snoeijer, J. H. (2016). Surface tension regularizes the crack singularity of adhesion. Soft Matter. 12, 4463–4471. doi: 10.1039/C5SM03079J
Li, Q. (2020). Simulation of a single third-body particle in frictional contact. FU Ser. Mech. Eng. 18, 537–544. doi: 10.22190/FUME201002045L
Li, Q., Pohrt, R., Lyashenko, I. A., and Popov, V. L. (2020). Boundary element method for nonadhesive and adhesive contacts of a coated elastic half-space. Proc. Inst. Mech. Eng. Part J. J. Eng. Tribol. 234, 73–83. doi: 10.1177/1350650119854250
Li, Q., Pohrt, R., and Popov, V. L. (2019). Adhesive strength of contacts of rough spheres. Front. Mech. Eng. 5:7. doi: 10.3389/fmech.2019.00007
Lyashenko, I. A., and Pohrt, R. (2020). Adhesion between rigid indenter and soft rubber layer: influence of roughness. Front. Mech. Eng. 6:49. doi: 10.3389/fmech.2020.00049
Lyashenko, I. A., and Popov, V. L. (2020a). The effect of contact duration and indentation depth on adhesion strength: experiment and numerical simulation. Tech. Phys. 65, 1695–1707. doi: 10.1134/S1063784220100126
Lyashenko, I. A., and Popov, V. L. (2020b). Dissipation of mechanical energy in an oscillating adhesive contact between a hard indenter and an elastomer. Tech. Phys. Lett. 46, 1092–1095. doi: 10.1134/S1063785020110097
Maugis, D. (1992). Adhesion of spheres: The JKR-DMT transition using a dugdale model. J. Colloid Interface Sci. 150, 243–269. doi: 10.1016/0021-9797(92)90285-T
Papangelo, A., and Ciavarella, M. (2017). A Maugis-Dugdale cohesive solution for adhesion of a surface with a dimple. J. R. Soc. Interface 14, 1–9. doi: 10.1098/rsif.2016.0996
Papangelo, A., Scheibert, J., Sahli, R., Pallares, G., and Ciavarella, M. (2019). Shear-induced contact area anisotropy explained by a fracture mechanics model. Phys. Rev. E 99:053005. doi: 10.1103/PhysRevE.99.053005
Pastewka, L., and Robbins, M. O. (2014). Contact between rough surfaces and a criterion for macroscopic adhesion. Proc. Natl. Acad. Sci. U.S.A. 111, 3298–3303. doi: 10.1073/pnas.1320846111
Popov, V. L. (2021). “Adhesion hysteresis due to chemical heterogeneity,” in Multiscale Biomechanics and Tribology of Inorganic and Organic Systems, Springer Tracts in Mechanical Engineering, eds G. P. Ostermeyer, V. L. Popov, E. V. Shilko, O. S. Vasiljeva (Cham: Springer), 473–483.
Popov, V. L., Pohrt, R., and Li, Q. (2017). Strength of adhesive contacts: influence of contact geometry and material gradients. Friction 5, 308–325. doi: 10.1007/s40544-017-0177-3
Salehani, M. K., Irani, N., Müser, M. H., and Nicola, L. (2018). Modelling coupled normal and tan-gential tractions in adhesive contacts. Tribol. Int. 124, 93–101. doi: 10.1016/j.triboint.2018.03.022
Keywords: surface energy, adhesive contact, hysteresis, third body, chemical heterogeneity
Citation: Lyashenko IA, Li Q and Popov VL (2021) Influence of Chemical Heterogeneity and Third Body on Adhesive Strength: Experiment and Simulation. Front. Mech. Eng. 7:658858. doi: 10.3389/fmech.2021.658858
Received: 26 January 2021; Accepted: 04 March 2021;
Published: 24 March 2021.
Edited by:
Martin H. Müser, Saarland University, GermanyReviewed by:
Gangfeng Wang, Xi'an Jiaotong University, ChinaCopyright © 2021 Lyashenko, Li and Popov. This is an open-access article distributed under the terms of the Creative Commons Attribution License (CC BY). The use, distribution or reproduction in other forums is permitted, provided the original author(s) and the copyright owner(s) are credited and that the original publication in this journal is cited, in accordance with accepted academic practice. No use, distribution or reproduction is permitted which does not comply with these terms.
*Correspondence: Valentin L. Popov, di5wb3BvdkB0dS1iZXJsaW4uZGU=
Disclaimer: All claims expressed in this article are solely those of the authors and do not necessarily represent those of their affiliated organizations, or those of the publisher, the editors and the reviewers. Any product that may be evaluated in this article or claim that may be made by its manufacturer is not guaranteed or endorsed by the publisher.
Research integrity at Frontiers
Learn more about the work of our research integrity team to safeguard the quality of each article we publish.