 Fabian Großmann
 Georgios Bikas
- Laboratory of Internal Combustion Engines, Department of Mechanical Engineering, Georg Simon Ohm University of Applied Sciences Nuremberg, Nuremberg, Germany
Despite the public debate nowadays on the future of Internal Combustion Engines (ICE), which is impeding their development, one limitation towards further optimization of ICE in terms of fuel consumption and emissions can be seen in the current approach and more specifically in the transient engine operation and its control. The main drawbacks in the current approach source from: 1) complex structure of mechanization including sensors and actuators, 2) low time resolution and accuracy of sensing (cost driven), 3) complex Electronic Control Unit (ECU)-software architecture associated with huge calibration effort and 4) recently, funded research due to unsecure business model of ICE is becoming less. To overcome these difficulties unexploited potential should be utilized. Some of this potential lies in cycle-by-cycle and cylinder-by-cylinder accurate fuel and air control, and in the development of physical based virtual sensors with high time resolution and accuracy. One of the main motivations for this study was to develop a measurement technique that enables crank-angle resolved air mass flow rate measurements during engine operation in a dynamometer test cell. The measurement principle is quite simple and is based on gauging the dynamic pressure in both the intake and exhaust duct at the closest possible positions to the valves. To fulfill these requirements aerodynamic probes have been developed and manufactured utilizing 3D printing. The probes have been integrated in special developed flanges, which correspond exactly to the shape of the air channels in the cylinder head of the engine. Hence, they can be mounted either in front of the valves at the intake or behind the valves at the exhaust duct. Results at different engine operating conditions have been obtained, analyzed and correlated to other sensors like air-flow meter. Those post-processed results can be further used to validate 1-D gas exchange models, or 3-D Computational Fluid Dynamics (CFD) port flow models. The ultimate scope of these measurements is to calibrate fast physical-based gas exchange models that can be directly used in the engine control framework on an embedded system.
1 Introduction
A detailed understanding of the flow structure and turbulence generation within the cylinder of an ICE has been the focus of countless research projects and publications over the last few decades. It has been recognized that engine flows are responsible for describing the key processes of turbulence, mixing and combustion that define the engine performance and efficiency. Other areas where in-cylinder flows impact engine operation include misfire and cycle-to-cycle variability (CCV), post-combustion mixing (important for completion of the final oxidation of CO and particulate matter as well as reduction of NOx formation), heat transfer, and mixing of crevice hydrocarbons with hot bulk gases during the expansion stroke [(Lumley, 1999), (Heywood, 1988), (Boree and Miles, 2014), (Borée and Miles, 2014), (Miles et al., 2008) (Miles et al., 2004), (Miles et al., 2002), (Miles et al., 2007), (Miles et al., 2009), (Arcoumanis and Whitelaw, 1987)]. Well-designed experiments in optically accessible engines utilizing optical measurement techniques like laser Doppler anemometry and particle image velocimetry have been used extensively to understand the engine flow physics, with particular emphasis on turbulent flow generation and cycle-to-cycle variability. [(Reuss, 2000), (Baby et al., 2002)] Advances in diagnostics have led to the ability to capture transient, multi-dimensional flow information within internal combustion engines. [(Haworth, 1999), (Celik et al., 2001)] As engine flows are inherently 3D, the ability to resolve the complete flow structure becomes increasingly important to analyze instantaneous turbulent flow phenomena and validate turbulent models. Such capabilities are anticipated to provide further insight into the study of turbulence and CCV as well as build more predictive models describing the engine flow [(Pope, 2015)]. Numerical simulation of internal combustion engines has become an indispensable tool for engine design and optimization. Both bulk flow structures and turbulence levels must be accurately predicted in order to find optimal designs. Despite the variety of 3D high-fidelity turbulence models for describing engine flows, the flow upstream the intake valves and the associated boundary conditions need to be defined. There are in general two approaches, in the simplest case they are set as time invariant, or if time varying boundary conditions are necessary, they are set by a coupled one-dimensional (1D) gas exchange model. Co-simulation of a 1D gas exchange model with a 3D model potentially offers the best of both worlds. It enables the sharing of boundary data between 1D and 3D models in a single or multi-domain system. This way the in-cylinder process is resolved using more detailed CFD simulation of 3D flows and is coupled to a 1D gas exchange model to account for time varying boundary conditions in the intake duct. One dimensional (1D) CFD allows engineers to understand the flow rates and pressures at system boundaries, and how they might change, within an engine cycle–particularly as the operating state of the components changes, for example, as valves open or close. Although the focus in the present study clearly lies on the application of the aerodynamic probes, the 1D commercial software WAVE has been utilized to correlate with the test data. WAVE simulation software solves the 1D form of the Navier-Stokes equations governing the transfer of mass, momentum and energy for compressible gas flows, and includes sub-models for combustion and emissions. Quite often the information used to validate the 1D models is based on low frequency experimental data, acquired by mass flow meters, pressure and temperature transducers at the locations of interest. Hence, there is a limited chance to evaluate crank-angle-based flow velocities and turbulence in the intake duct but also the mass flow rate through the intake and exhaust valves during the opening period [(Lomas, 2011), (Westerweel et al., 2013), (Jainski et al., 2013), (Hwang et al., 2007), (Desantes, et al., 2010)].
It is well known that the intake process influences the air flow structure coming inside the cylinder. The complex engine dynamics and working conditions make the intake air estimation a challenging work. In the present study we were aiming to develop a measurement technique that enables crank-angle resolved air mass flow rate measurements during engine operation in a dynamometer test cell. The measurement principle is quite simple and is based on gauging the dynamic pressure in both the intake and exhaust duct at the closest possible positions to the valves. To fulfill these requirements aerodynamic probes have been developed and manufactured utilizing 3D printing [(Heckmeier et al., 2019), (Heckmeier et al., 2020)]. To demonstrate the aforementioned limitation and the potential proposed in the present study, let us choose but not limit ourselves to the precise control of air-fuel ratio (A/F) to the stoichiometric value under certain operating conditions, which is necessary to minimize exhaust emissions in vehicles employing a three-way catalytic converter. A/F control has two principal components: a closed-loop portion based on the signal from an exhaust gas oxygen sensor, and an open-loop, or feedforward portion in which injector fuel flow is controlled in response to a signal from an air flow meter. Due to the relatively long delay, the feedback, or closed-loop portion of the A/F control system, is fully effective only under steady state operating conditions and is getting poorer at transient conditions. As test cycle dynamics get faster and legal driven tolerances get tighter, emissions control becomes more demanding and the simple PI control schemes are pushed to their limits. Although the fuel path is well understood and efficiently controlled, the big unknown during transient engine operation, is the air path and its dynamics. However, the transient cylinder air mass cannot get acquired by sensors directly and, moreover, limits the accuracy of A/F control. The complex engine dynamics and working conditions make the intake air estimation a challenging work. To help understand the transient engine gas exchange and develop crank-angle resolved accurate virtual sensors, more sophisticated measurement techniques are necessary. The aerodynamic probes are mainly piezoresistive pressure transducers consisting of a Kiel probe, few holes in the flange of the sensor, which serve as measuring points for the static pressure and piezo crystals. They are able to determine the existing dynamic pressure in the range of 0–2 psig at a sampling rate of 50 kHz and have a maximum output voltage of 300 mV. The Kiel probe measures the total pressure according to the principle of Prandtl’s tube and was specially developed for inflows up to
The signal from the aerodynamic probes is amplified before it is fed for further processing to the dSpace Micro Autobox II (MAB), which is simultaneously the data acquisition system and the prototype ECU of the test engine. A special algorithm has been developed in Matlab/Simulink to ensure “in-situ” and “in-memory” signal processing on the MAB at a real time frequency of 4 kHz (high speed).
Furthermore, each probe exhibits a double head resulting to two measuring points, so that in addition to the flow velocity, the flow direction can also be detected. In other words, the intake and exhaust probe can determine the mass flow rate, both, in and against the flow direction. Hence, further information about the engine operation, such as the blow-by behavior, the characterization of turbulence intensity at the intake and exhaust duct or the real opening and closing valve timing during engine operation, can be obtained.
In the following sections the experimental setup, the test methodology including the data acquisition system and post-processing and the achieved results will be discussed in detail.
2 Motivation
The main task of the current study is to provide an alternative way to experimentally characterize the air flow highly resolved in the intake duct of an ICE during real engine operation. As already mentioned in the introduction, the air mass is currently determined by inertial sensors, such as a hot-film air-mass meter (HFM). The HFM senses the heat transfer of the air mass flow through temperature measurements at two distinct points, which are located in front of and behind a heated sensor element. The flow velocity and the air mass flow are proportional to the temperature difference. A more detailed functional description of such a sensor is described in 3. Due to the relatively large time scale of a HFM in order of 20 ms, its transient response to highly pulsating flows is getting poor, especially when the frequency of the pulsating flow is higher than 50 Hz. This is often the case in the intake air flow of an ICE. The measurement errors reported in those cases can be up to 100% of the average value [(Paulweber and Lebert, 2014)]. An exact determination of the trapped charge mass in the cylinder after the intake valve is closed, is therefore almost impossible. However, since the information of fresh air trapped into the cylinder at the end of the gas exchange phase is decisive for the air-fuel mixture control, the amount of fuel to be injected can only be approximately calculated. Nevertheless, its low cost and small measurement error in the air mass flowrate (Eq. 1) under steady state engine operation, justifies the HFM application in serial production vehicles.
The required fuel mass can now be calculated from corresponding lookup tables in the ECU to ensure accurate lambda control. Unfortunately, the accuracy level does strongly deteriorate at transient engine operation. If a step response is now applied to the sensor, it takes up to 15 ms to capture the change in the measured airflow by 63% of its final value (
Implementation of the aerodynamic probes at the TH Nuremberg research engine allows a high-resolution data acquisition of the dynamic pressure, in the intake duct of the engine and consequently enables the calculation of the flow velocity. Although, aerodynamic probes for both the intake and exhaust ducts have been developed and applied, only the intake duct has been considered in the present study. Neverthelesss, data from the exhaust duct aerodynamic probe has been acquired but not presented here. This data goes beyond of the scope of the present work as described in the title and will be subject of further future analysis, in conjunction with the investigation of the entirely gas exchange process, including residual gas and blow-by behaviour. Emphasis has been put on the synchronous data acquisition and post-processing for an in-situ and in-memory data analysis. This way we get cycle synchronous information about the amount of air flowing through the intake valve. In order to achieve the aforementioned goal, namely the exact detection of the in- and outflowing air, beside the velocity profile in the ducts the information of the static pressure and the temperature is required. This additional information is provided by a high-resolution static pressure transducer at a resolution of 1 kHz and a temperature sensor. In the following an overview of the measurement technique adopted here will be presented.
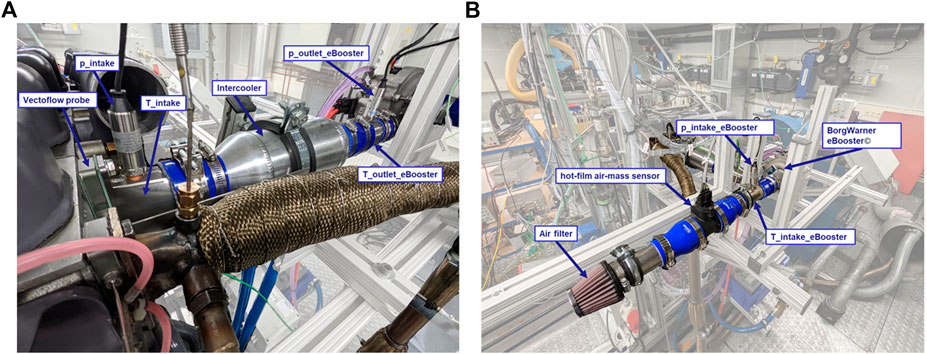
FIGURE 1. (A) Intake System after eBooster© Outlet, (B) Intake System in front of eBooster© Inlet.
First the question that should be asked is, whether the undertaken effort for a high-resolution air mass measurement is appropriate. As already mentioned in the introduction, the air-fuel mixture has the most dominant influence on raw engine emissions. This requires an exact metering of the fuel for each individual cylinder. However, to make this measurement possible at all, the air mass in the cylinder must be known beforehand. The filling of the cylinder of an engine is indicated by the volumetric efficiency (
where,
Currently, the charge mass remaining in the cylinder cannot be measured. In order to determine this approximately the following procedure is chosen [(van Basshuysen et al, 2017)]:
• Cylinder pressure indication in one or all engine cylinders,
• Assume that the cylinder charge temperature at the time “inlet valve closes (
• Applying the ideal gas equation
At the same time, the air-fuel ratio λ, continues to be the focus of attention, which determines the ratio of air
where,
The air mass at stoichiometric ratio (
A cycle-to-cycle and cylinder individual precise control of A/F to the stoichiometric value under certain operating conditions, which is necessary to minimize exhaust emissions in vehicles employing a three-way catalytic converter, is a very challenging task. A/F control has two principal components: a closed-loop portion based on the signal from an exhaust gas oxygen sensor, and an open-loop, or feedforward portion in which injector fuel flow is controlled in response to a signal from an air flow meter. Due to the relatively long delay, the feedback, or closed-loop portion of the A/F control system, is fully effective only under steady state operating conditions and is getting poorer at transient conditions. Although the fuel path is well understood and efficiently controlled, the big unknown during transient engine operation, is the air path and its dynamics. However, the transient cylinder air mass cannot get acquired by sensors directly and, moreover, limits the accuracy of A/F control. The complex engine dynamics and working conditions make the intake air estimation a challenging work. To help understand the transient engine gas exchange and develop crank-angle resolved accurate virtual sensors, more sophisticated measurement techniques are necessary. In the following the state of the art will be discussed.
3 State of the Art
Well-designed experiments in optically accessible engines utilizing optical measurement techniques like laser Doppler anemometry and particle image velocimetry have been used extensively to understand the engine flow physics, with particular emphasis on turbulent flow generation and cycle-to-cycle variability. However, such sophisticated techniques can be very difficult applied on a serial engine, in order to investigate flow phenomena during real engine operation. A rather hybrid approach is followed to understand engine flow physics in serial production engines. This includes a combination of 1D-CFD gas exchange simulation utilizing test bench data and high-fidelity 3D-CFD models. Pressure, temperature and mass flowrate data acquired at an engine test bench are mainly used to correlate the CFD models. There are several methods to experimentally determine the air mass flow through an ICE. The most commonly used are hot-wire anemometers or sensors based on ultrasound measurement principles. In our engine we are using a HFM from Bosch in parallel to the Vectoflow GmbH aerodynamic probes. HFMs are thermal flow sensors and determine the mass flow of the flow medium by means of temperature differences at distinct measuring points. In the center of the sensor element there is a heated zone, which consists of an externally or self-heated resistor [(Borgeest, 2014), (Bernstein, 2013)]. On both sides of the heater there are temperature sensors which measure the radiating heat of the heater. If the voltage of both temperature sensors is the same, there is no temperature difference and consequently zero mass flowrate is sensed. In contrast, when air flows through the HFM, the two temperature sensors are cooled down resulting in a temperature difference across the sensor, which is a measure for the mass flowrate [(Borgeest, 2014)].
The output voltage of the temperature sensors is then converted into a gravimetric mass flow by the ECU. For an accurate measurement it is important to ensure laminar flow of the medium to be measured. In order to convert a turbulent flow into a laminar one, flow straighteners are integrated at the entrance of the sensor.
The HFM has a very high accuracy in stationary operation. However, if a dynamic or pulsating flow is present, the HFM only determines the average amass flow. The Bosch HFM-5 sensor data sheet reports a time constant
This means that a time of 75 ms is needed by the HFM to detect 99.3% of the steady state value after introducing a step change in the input. However, since the opening duration of the intake valve of the research engine at an idling speed of 650 rpm is only about 70 ms, the HFM dynamic response is not sufficient to capture the mass flow rate accurately. A minimum sampling frequency according to Shannon should be at least twice as high as the frequency to be measured in order to obtain correct values.
However, the air mass flow on the exhaust side cannot be measured with the help of these sensors, due to the high temperatures of up to 1,000 Celsius. According to the data sheet, the Bosch HFM-5 has a temperature application range between −40 and +120°C. For this reason, the exhaust air mass flow rate can only be determined with an ultrasonic sensor or via the residual oxygen concentration. The latter is usually measured by a lambda sensor. The flowrate can then be calculated approximately from the measured lambda-value and the fuel mass flow rate, according to Eq. 4. To overcome all these difficulties the aerodynamic probes have been developed and implemented in the research engine, allowing high frequency and accurate air mass flowrate measurements. In the following subchapters the measurement technique used for this work will be described.
4 Experimental Setup
4.1 Testbench Build
The research engine is a naturally aspirated, inline four-cylinder, air-cooled Diesel Deutz F4l 912 engine with individual cylinder heads and two valves per cylinder, build in 2010. In its original state the engine is equipped with a high-pressure fuel system that utilizes an in-line injection pump with mechanical centrifugal governor.
For research purposes, cylinder one and four have been modified featuring a modern common rail injection system from Delphi Technologies equivalent to a EU6d passenger car serial application. The engine is installed on a Dyno with eddy brake system. Cylinders two and three are still driven by the serial in-line fuel injection pump and can start the engine on the dyno. Injection for both cylinders one and four is controlled by rapid prototyping control system, as well as the boost pressure control for cylinder 4. Furthermore, the complete intake path of cylinder 4 has been replaced with the intake section seen below (Figure 2).
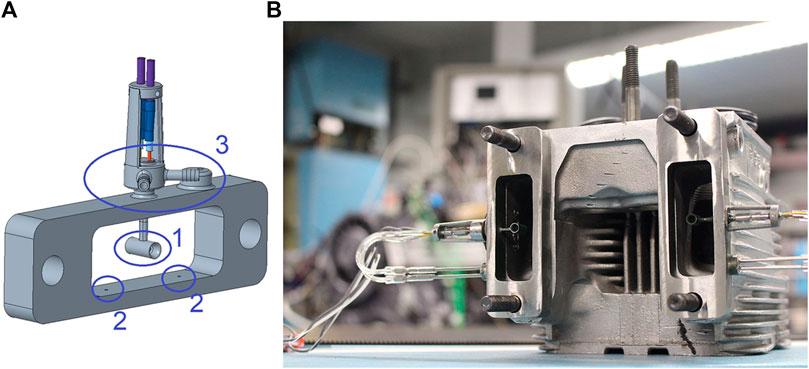
FIGURE 2. (A) 3D-CAD model of a Vectoflow probe, (B) Probes mounted on the cylinder head.
In order to prevent foreign matter from entering the intake manifold and causing lethal damage to the system the intake path starts with a separate air filter. After the air filter a widely used Bosch hot-film air-mass meter measures the air mass flow, followed up by a pressure-sensor (p_intake_ebooster) and a thermocouple-adapter (T_intake_eBooster) to capture the thermodynamic conditions close to the inlet of the eBooster©. The eBooster© is an electrical driven compressor from Borgwarner, which enables a boosted engine operation in that cylinder four of our research engine, without the need to integrate a turbocharger to the engine. The compressed air after the eBooster© is fed to the intercooler for cooling. In addition, to energetically balance the eBooster©, both the pressure and temperature of the air are measured directly at its outlet (p_outlet_eBooster, T_outlet_eBooster). Additional pressure sensor (the used pressure sensors are Memotec V20Z942 absolute pressure Sensor 0–2 bar with a resolution up to 1 kHz) is used to measure the static pressure with a resolution of 1 kHz to ensure that it is captured correctly and follows the gas dynamic changes of the air flow in the intake duct. The information of the pressure in conjunction with the slower changed temperature is needed to calculate the air density. The latter together with the flow velocity determined by the Vectoflow aerodynamic probes will define the instantaneous mass flow rate through the intake valve. The Vectflow aerodynamic probe for the inlet is attached to the cylinder head of the engine with two gaskets for sealing. Throughout the manifold, several ducts and pipe segments used for the transition between the various diameters and flange shapes.
4.1.1 Data Acquisition Hardware
There are two main hardware objects for the measurement data acquisition and the subsequent in-situ and in-memory data post-processing. Both components have been manufactured by the company dSpace. In this case, the MAB as the master and the RapidPro as the slave are used. Both have a modular structure and can be combined individually according to the intended use. In our setup we utilize the MAB with DS 1401/1513/1,514 configuration and the RapidPro with the modules “DS 1638” and “DS 1637”, which have the following functions:
• DS 1638: This module serves here as a sensor input module for thermocouples and can directly evaluate the signals of the connected type K thermocouples. Certain temperature sensors instrumented in our research engine are integrated in this module.
• DS 1637: This module is used to record the mechanical engine characteristics. The crankshaft and camshaft sensors are integrated in this module. The crank angle signal is required to synchronize the entire data acquisition system and to control the common rail injection with our rapid control prototyping. The angle sensor is the 365°C from AVL List GmbH, which uses infrared light reflection on a marker disc to output both the speed and the absolute angle with a resolution of up to 0.5°CA.
The RapidPro communicates with the MAB via Low Voltage Differential Signaling link (LVDS) and can therefore both transfer and receive data. Using Analog Input-Outputs and Digital Input-Outputs, the MAB records the remaining measurement data, such as pressures and the signals of the Vectoflow-probes. Furthermore, target values can be determined via outputs. E.g., the throttle position, the brake torque and the speed of the eBooster© can be specified. All these measured variables and target values can be monitored and specified with dSpace’s ControlDesk. All the algorithms for in-situ and in-memory processing of the acquired data have been generated using MATLAB/Simulink from MathWorks® and then compiled on MAB. This has the advantage that the rapid control algorithms can be generated in house and the flexibility for modifications is maintained. The compiled software on the MAB runs on a IBM PPC 750 GL processor at 900 MHz, including 1 MB level 2 cache, 16 MB main memory and another 6 MB memory exclusively for communication between MicroAutoBox II and the PC.
4.1.2 Vectoflow Aerodynamic Probes
One of the main motivations for this study was to develop a measurement technique that enables crank angle resolved air mass flow rate measurements during engine operation in a dynamometer test cell. The core components are the aerodynamic probes designed in cooperation with the Vectoflow GmbH. These probes are essentially piezoresistive pressure transducers of the type 8507C-2 from Meggit, which can determine the existing dynamic pressure at a high sampling frequency of up to 50 kHz. Figure 2A shows the basic structure of such a probe in a 3D-CAD model. The Kiel probe 1), bores for the static pressure sensing 2) and the cooling connectors 3) can be identified.
In order to keep flow losses as low as possible and thus to obtain the measurement result as accurate as possible, the two Vectoflow probes are mounted directly at the cylinder head of the engine in a distance of 45 mm from the intake valve seat. The flange shown in Figure 2B was designed specifically for our application on the Deutz F4L 912 research engine and corresponds exactly to the shape of the air ducts of its cylinder head. This allows the measuring probes mounted in the closest vicinity of the cylinder valves. Additive manufacturing allows individual solutions to get realized, in order to ensure ideal sensor installation and position. The Kiel probes measure the total pressure according to the principle of Prandtl’s tube and was specially developed to capture flows with angles of attack up to
4.2 Test Methodology
The MAB, which is simultaneously the data acquisition system and the prototype ECU of the test engine, supports an input voltage between −10 and +10 V, so the maximum 300 mV output of the Vectoflow probes are within the measuring range of the MAB. The raw signal from the Vectoflow probes is amplified before it will be transmitted to the MAB (Figure 3A).
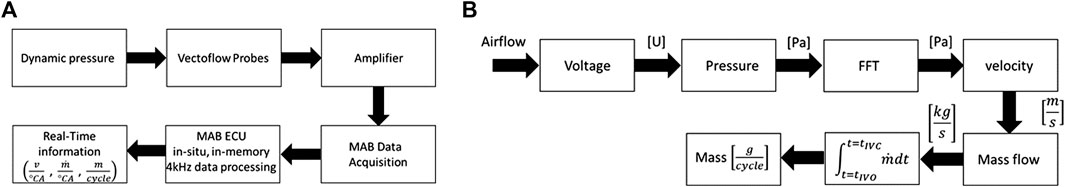
FIGURE 3. (A) signal chain and (B) signal processing of the probes.
On the MAB the amplified dynamic pressure signals are further processed by specially developed algorithms and the instantaneous mass flow is calculated. This value is then available to the ECU as a further parameter. The steps required to obtain the mass flow from the raw signals are listed below.
As shown in Figure 3B, several steps are required to obtain the mass flow from the raw signal. First the output voltage must be converted into a pressure signal. In addition, the influences of the measuring amplifiers must be compensated. Additionally, the probes have been calibrated at Vectoflow in order to identify their damping frequencies and the corresponding transfer function. The latter is used on our FFT processed signal. The final result does only contain flow information and any other disturbance or noise is eliminated. The signals are then subjected to a Fast Fourier transformation (FFT) in order to filter noise from the measurement data. Furthermore, the flow direction will be evaluated based on the gathered data from the double head probe (two piezo crystals per probe) simultaneously. After these steps the flow velocity u can be calculated as a function of the Mach number to:
where, c = speed of sound and Ma = Mach number, which results from:
where, κ = isentropic exponent,
where, R = the gas constant and T = the temperature in K. Another way of obtaining the flow velocity is the Bernoulli equation, which states that the sum of the occurring pressures is constant.
where,
As already mentioned, the Vectoflow probes sense both absolute and static pressure simultaneously but provide as output only the difference between the two pressures as dynamic pressure, which was confirmed by 12:
Thus incompressible Bernoulli implies that the flow velocity in this paper can be calculated as
where,
where,
where,
5 Results and Discussion
As shown in Figure 3B, the recorded raw signals have to be in-situ, in-memory post processed to get the crank angle resolved mass flow. There is no storage of raw data for later off-line post processing. All the measurements are evaluated on the MAB in real time at a frequency of 4 kHz. The results obtained from these calculations will be considered and discussed in the following. As a first validation check the repeatability of the received signals shall be verified. Figure 4 shows the probe signals at the inlet. The engine speed and the boost pressure has been varied in two steps. At 1,200 rpm cylinder four was running unfired first in the naturally aspirated mode and then in a boosted mode at a pressure of 1.3 bar absolute. The same is repeated at a higher engine speed of 2000 rpm. To ensure a robust and synchronous analysis of the acquired data on the MAB, they need to be organized in data packages. At every operating point a time window of 50 consecutive engine cycles has been chosen for data buffering and post-processing. The measurements are taking place without firing the cylinder 4, which is instrumented with the aerodynamic probes. Just gas exchange process occurs in that cylinder in all measurements shown in this study.
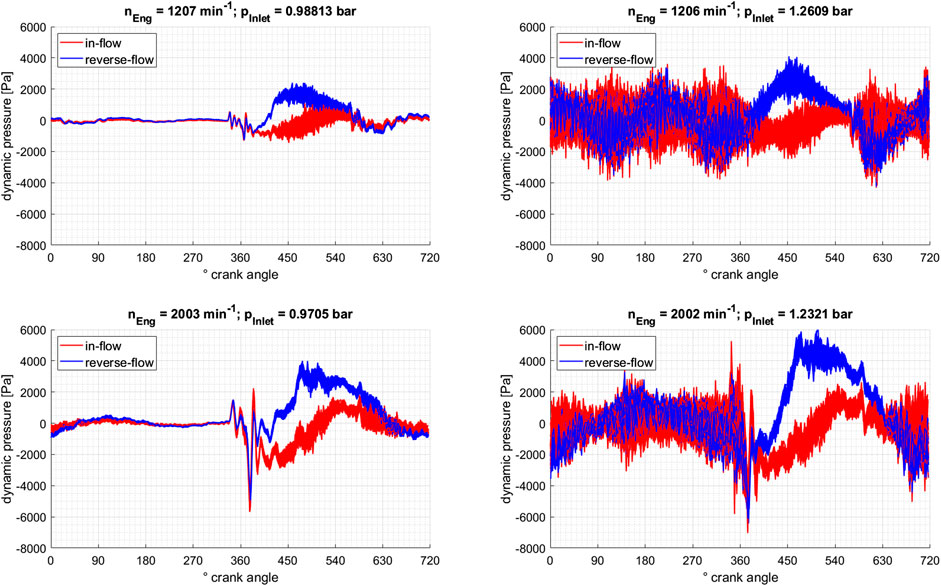
FIGURE 4. Individual cycle dynamic pressure in the inlet duct of 50 consecutive cycles for four measuring points.
The blue lines represent the data of the probe in flow direction towards the engine cylinder, while the reverse flow is shown in red. We analyzed every of the four measuring points shown in Figure 4 in more detail. All of them exhibit similar systematic behavior and a detailed description of every one goes beyond the scope and space limitation of the present work. We exemplary focus in Figures 5, 6 at one set of conditions, representing the engine speed at 1,200 rpm and naturally aspirated mode. In addition to a very high repeatability without really perceptible outliers, further information can be obtained from Figure 7. In the interval between zero (firing top dead center-TDC) and 330°CA the graphs of the two probes are almost congruent. Considering the reverse flow data of the piezoresistive sensors in that respective probe, it is concluded that both sensors detect the same change in dynamic pressure over that period in time. By converting the dynamic pressure into a flow velocity and subsequently to a mass flow, a value close to zero would result. Since during this period the inlet valve of this cylinder is closed, these are plausible results. In the following interval between 330 and 380°CA the graphs are congruent too. During that time the inlet valve begins to open. Due to the low engine speed and the ramp of the cam lobe causing a low valve velocity and consequently the flow area between valve body and seat is slowly increasing, it takes few time steps before a noticeable air mass flow is established. Between 380 and about 600°CA the inlet valve is fully open and air flows into the cylinder and this is clearly indicated in the same Figure 7 by the big difference between the blue and the red curve. While the inflow probe detects a positive flow towards the cylinder, the reverse flow probe results a negative value, that is also in the direction towards the cylinder. At the end of the opening period, as expected, the dynamic pressure in the inflow direction decreases, as the flow area is reduced again. At the same time, the pressure at the reverse flow probe increases. The time period in which the inlet valve is open is discussed in more detail below. After the valve is completely closed, the measured values are again balanced, which indicates that no flow is taking place through the engine. In order to analyze the CCV of the engine inflow we focus on cycle averaged quantities e.g. trapped mass in the cylinder per cycle. This is the result of the instantaneous mass flow rate integration from the inlet valve opening to its closing time. Both integration limits are knowing from the valve profiles as measured at the engine. Nevertheless, the exact opening and closing time of the valves are impacted from the overall engine dynamics during real operation. It is more than desirable to identify the effective opening and closing time and hence the opening duration of the valves during engine operation. We are looking for an automatic procedure to identify the effective opening duration of the valves.
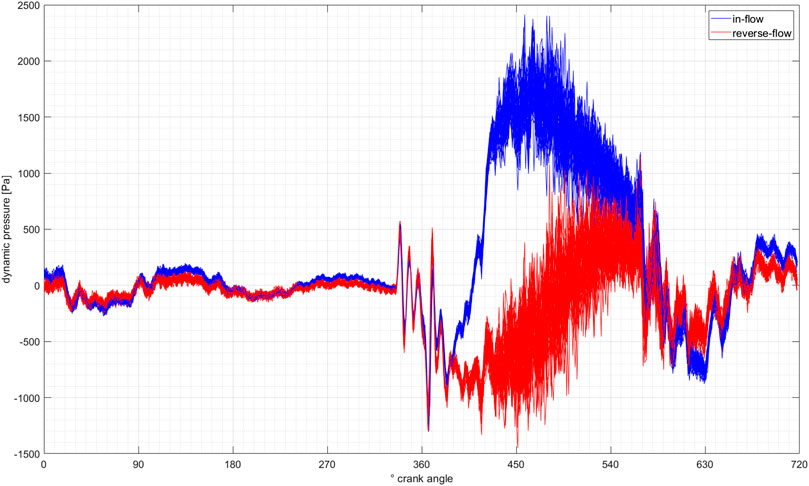
FIGURE 5. The dynamic and static pressure in the intake duct for one engine cycle at an engine speed of 1,200 rpm in natural aspirated mode.
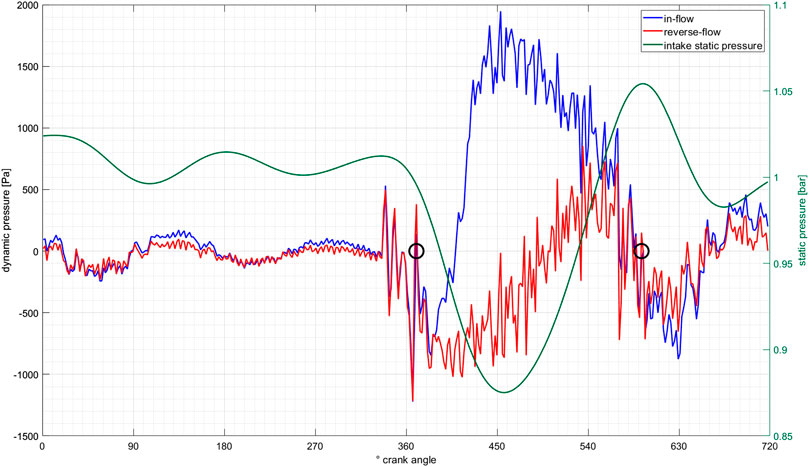
FIGURE 6. Recorded mass flow rate using the Vectoflow probes and the HFM. Conditions identical to Figure 4.
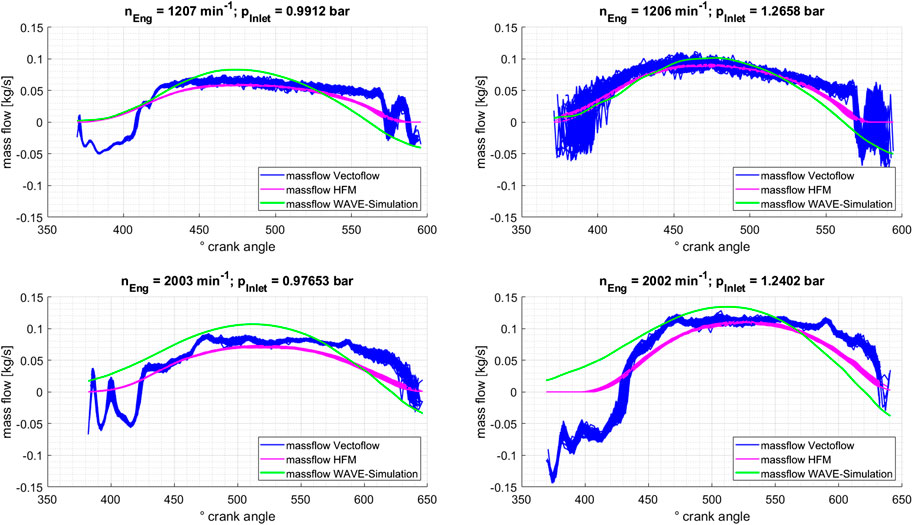
FIGURE 7. Individual cycle dynamic pressure in the inlet duct of 50 consecutive cycles at an engine speed of 1,200 rpm.
Since, in addition to the signals from the Vectoflow probes, the filtered static pressure measured at 1 kHz at the inlet duct is also considered. A drop in static pressure at the time of valve opening can be clearly detected. The same applies to an increase again in the static pressure as soon as the valve is closed. By deriving the static pressure signal twice over time, the points of the highest gradients can be determined. By applying a simple algorithm the minima of the second derivative can be detected. The points just obtained reflect the times of the effective inlet valve opening
The air mass flowrate during the induction phase at each individual engine cycle for the four selected measuring points are graphically shown in Figure 6. In that graph the impact of the increasing speed and boost pressure on the mass flow is evident and as anticipated. Adding the HFM measured values to the same plot, the plausibility of the aerodynamic probes results can be checked. Although the measurement frequency of the HFM is very low, its time scale of 15 ms corresponds to 67 Hz, it is sampled at 12 kHz in our measurements. This can be recognized by the smoother shape of the corresponding curves. In the same graph, the mass flow rate results from the 1D WAVE simulations are presented too. Due to the deterministic nature of the model, there is obviously no cycle variations. Furthermore, flow coefficients and cam profiles determine significantly the mass flow rate through the valves. It is in the nature of the modeling approach that high frequency velocity variations and consequently mass flow rate during the valve opening period cannot be captured by the 1D model in detail. Nevertheless, the trapped mass per cycle agree very well with the measurements.
At a first view, a good agreement between aerodynamic probes and HFM can be observed. The HFM values are anticipated to be accurate, as we are running at steady state points and HFM accuracy has been discussed above. Since the magenta colored lines correspond to the 50 individual engine cycles, can be concluded that the repeatability of the HFM is high. At the same time, due to its low measuring frequency of 67 Hz, despite the high sampling rate in our application, a characterization of CCV based on HFM measurements can be practically excluded. When the obtained air mass flowrate is integrated over the valve opening period, which is automatically detected as described above, the air mass trapped into the cylinder at each individual engine cycle is obtained and it is shown in Figure 8. The mass measured by the HFM should be taken as a reference line, indicating the ensembled averaged value over 50 cycles. The air mass calculated with the Vectoflow probes for each individual cycle is plotted as well and the CCV at those steady state points can be evaluated.
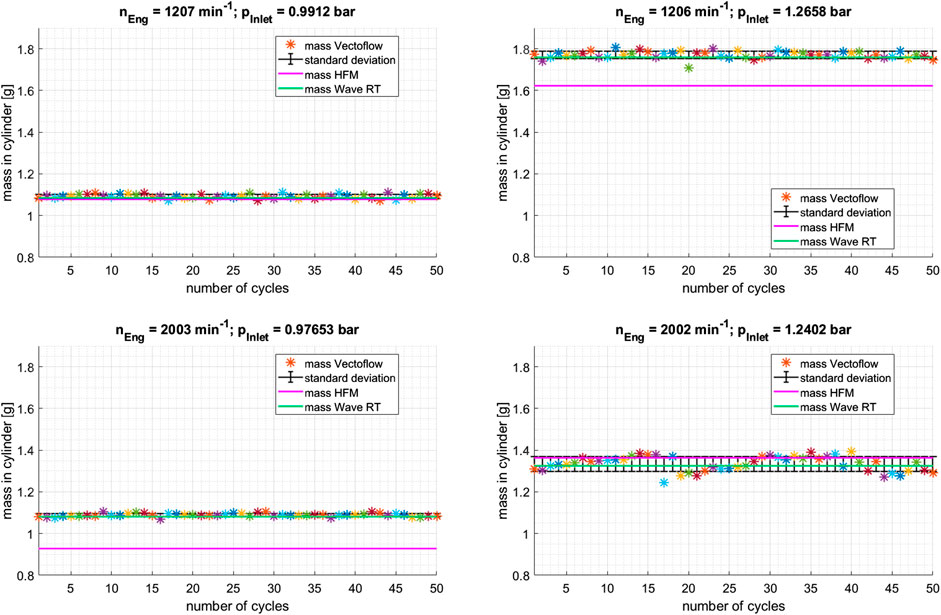
FIGURE 8. Calculated mass in the cylinder per cycle and operating point. Conditions identical to Figure 4.
Since these results appear to be very different and inconsistent at the first glance, the respective measurements will be analyzed more precisely. The plot on the upper left corner of Figure 8 shows the trapped air mass at the end of each cycle for 50 consecutive engine cycles at 1,207 rpm in the naturally aspirated (NA) mode. Due to the steady state operation, the HFM is able to determine the mass flow with high accuracy, but it is unable to capture the CCV which can be clearly observed with the aerodynamic probes. At the same NA mode but at higher engine speed of 2000 rpm the deviation of the mean air mass between HFM and aerodynamic probes is almost 15%. This difference can not be explained by a drop in the volumetric efficiency of the engine. A drop of the volumetric efficiency of 15% could not even been confirmed by WAVE gas exchange simulation of the engine. The value of the WAVE calculation is plotted in the same graph. It is therefore concluded that the HFM response at this point is erroneous. An accurate air-fuel control cycle by cycle and especially under transient engine operation seems, if not impossible, extremely challenging using a feedforward approach by utilizing the HFM signal. If the engine is additionally charged at constant speed, the values between the HFM and the aerodynamic probes differ significantly. This is not anticipated and we are seeking for an explanation. Assuming that at these two operating points the temperature in the inlet duct is slowly changed and well captured by the thermocouple, the gas constant of the air and the volume of the cylinder remain constant, then the mass of air would increase directly proportional to the air density and consequently directly proportional to the pressure increase.
Since the charging generates produces a pressure increase of about 28%, a mass increase of the same percentage to about
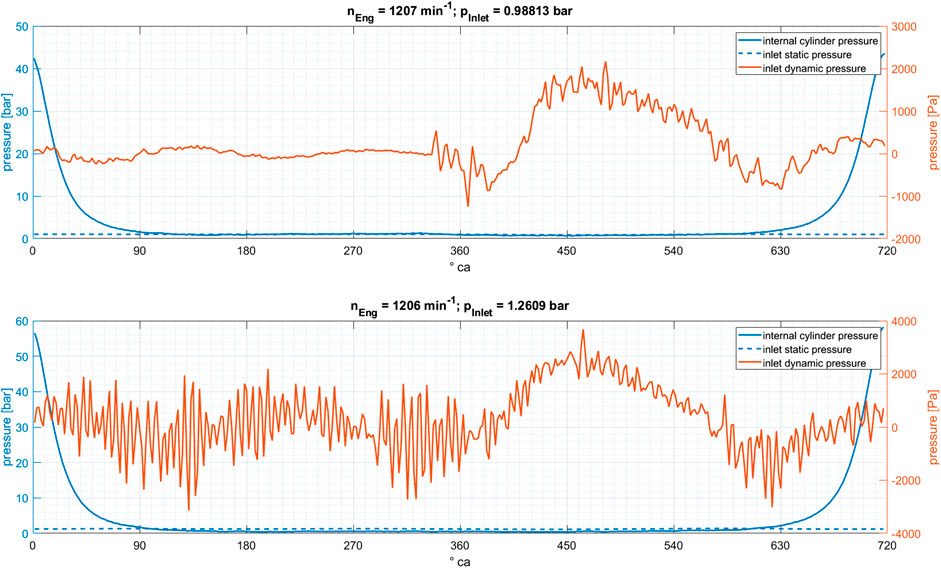
FIGURE 9. The static and dynamic pressure in the inlet duct along with the in-cylinder pressure at the engine speed of 1,200 rpm. Top graph: naturally aspirated mode; Bottom graph: boosted conditions.
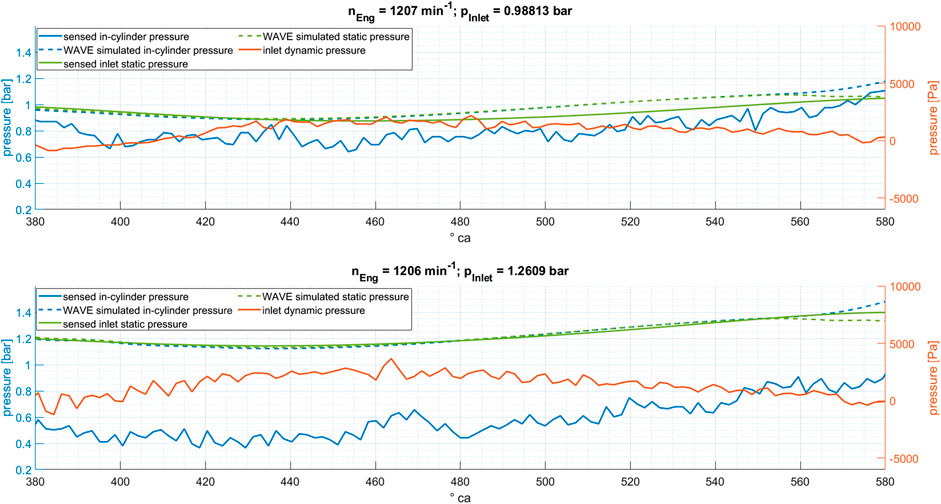
FIGURE 10. The static and dynamic pressure in the inlet duct along with the in-cylinder pressure zooming in the intake valve opening duration at the engine speed of 1,200 rpm. Top graph: naturally aspirated mode; Bottom graph: boosted conditions.
If we look at the second measuring point with a speed of 2000 rpm, a second difference appears. This time the HFM’s fault is already in the NA mode of the engine. There is a difference of the calculated mass of the two measuring devices close to 15%. This is due to the now almost doubled rotational frequency of the engine, since the HFM can no longer follow the mass flow and gives incorrect results. In comparison to the speed of 1,200 rpm, the air massflow measured with the Vectoflow probes is pretty much the same, which is in line with the WAVE calculations. At this operating point, the two curves approach each other due to charging. The ratio of the air flow between the NA mode and the charged mode scales with the pressure ratio between both operating modes as anticipated. Comparing the evolution of the static and cylinder pressure per °CA at 2000 rpm and both the NA and charge mode, can be shown in Figure 11 that the ratio of the in-cylinder to inlet pressure, upstream the intake valve, remains almost the same among both NA and charged operating mode of the engine at 2000 rpm.
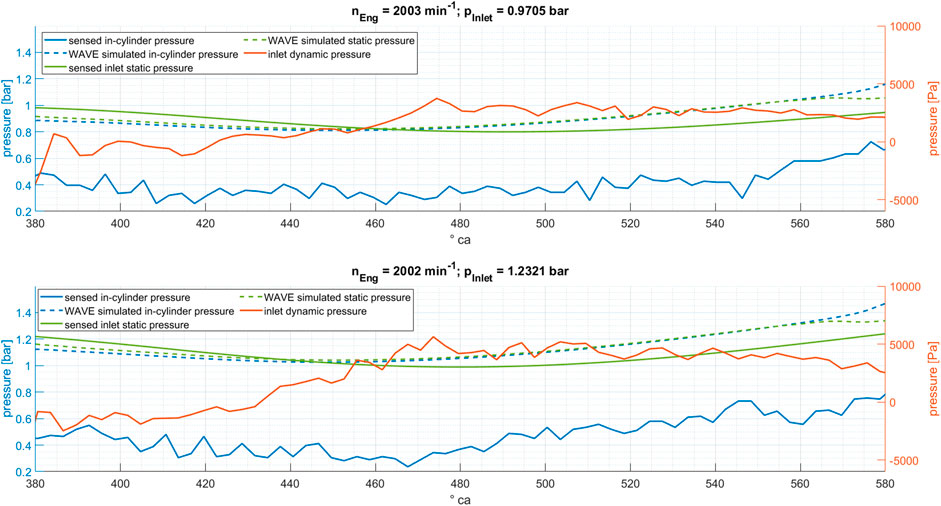
FIGURE 11. The static and dynamic pressure in the inlet duct along with the in-cylinder pressure zooming in the intake valve opening duration at the engine speed of 2000 rpm. Top graph: naturally aspirated mode; Bottom graph: boosted conditions.
In addition, a CCV of the air mass can be shown in Figure 8 and is clearly evident, especially at higher speed and charged operating mode. This deviation occurs stochastically among the cycles. Since the HFM is not able to diagnose such deviations exactly, this can lead to large deviations in air-fuel ratio from cycle to cycle. We are considering steady state engine operation in the present study and still show the benefit of crank-angle-based resolution of the air mass flowrate. We anticipate this benefit to get even bigger during transient engine operation.
6 Conclusion
A novel aerodynamic probe has been developed in cooperation with the probe manufacturer Vectoflow GmbH and applied on a research engine at TH Nuremberg. The main task set originally, namely to develop a measurement technique that enables crank-angle resolved air mass flow rate measurements during engine operation in a dynamometer test cell, has been successfully achieved. The measurement principle is based on gauging the dynamic pressure in both the intake and exhaust duct at the closest possible positions to the valves. To fulfill these requirements the aerodynamic probes, which are utilizing piezoresistive sensors, have been manufactured with 3D printing. The probes have been integrated in special designed flanges, which correspond exactly to the shape of the air channels in the cylinder head of the research engine. Results at different engine operating conditions have been obtained, analyzed and correlated to other sensors like air-flow meter. Those post-processed results can be further used to validate 1-D gas exchange models, or 3-D CFD port flow models. The ultimate scope of these measurements is to calibrate fast, physical-based, gas exchange models that can be directly used in the engine control framework on an embedded system. To our knowledge this is the first application of this type on a fired serial production engine and has been successfully implemented. The method enables a crank-angle resolved measurement of the mass flow rate and this has been demonstrated in the present study. Furthermore, effort has to be undertaken to extract more useful information e.g., velocity fluctuations in the intake duct of the engine, in order to characterize the turbulence level. This will be subject of research in the near future. The used methodology can also be extended to feature a multi-hole probe in order to better resolve the unsteady high frequency flow phenomena. This will definitely enable a better CCV characterization in real engine operation. Moreover, the port flow characterization, especially under transient conditions will be more realistic than assuming flow coefficients gained on a steady state flow bench. For most nowadays ICE featuring a fully variable valve train the detection of opening and closing valve times during real operation will be of great value and will enable the development of high-fidelity real-time control algorithms. Although, aerodynamic probes for both the intake and exhaust ducts have been developed and applied, only the intake duct has been considered in the present study. Nevertheless, data from the exhaust duct aerodynamic probe has been acquired at the same measuring points presented in the current analysis but not included here. This data goes beyond of the scope of the present work, that focus on the intake side as described in the title and will be subject of future analysis, in conjunction with the investigation of the entirely gas exchange process, including residual gas and blow-by behavior.
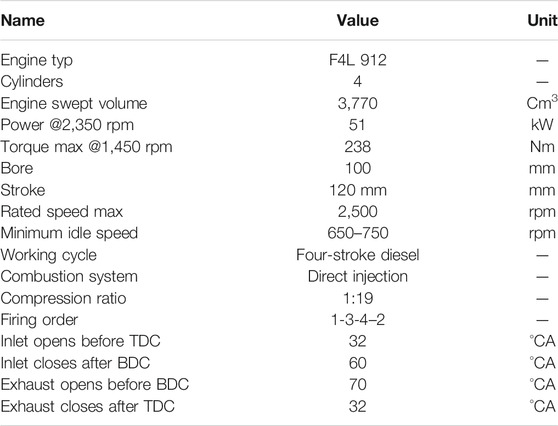
TABLE 1. Engine parameters.
TABLE 2. Nomenclature
Data Availability Statement
The original contributions presented in the study are included in the article/Supplementary Material, further inquiries can be directed to the corresponding author.
Author Contributions
FG wrote the code for in-situ, in-memory, high frequency data post processing, performed engine measurements and actively contributed with the writing. TM was leading the engine hardware modifications, instrumentation and rapid control prototyping and performed engine measurements. PR supervised the performed engine tests, was fundamental in discussions about the methods and results, and actively contributed with the writing. GB conceived the idea behind the paper, led the research activities, and took the lead in the writing of the paper.
Funding
FG and TM have been funded from “Vorlaufforschung” of TH Nuremberg.
Conflict of Interest
The authors declare that the research was conducted in the absence of any commercial or financial relationships that could be construed as a potential conflict of interest.
Acknowledgments
The authors would like to thank Daniel Iglesias and Sean Jeankins from Vectoflow GmbH for numerous discussions and the permanently support in the implementation of the aerodynamic probes. GB would like to thank Zekun Xing who performed the gas exchange simulations of the research engine using WAVE.
References
Arcoumanis, C., and Whitelaw, J. H. (1987). Fluid Mechanics of internal combustion engines-a review. Proc. IME C J. Mech. Eng. Sci. 201, 57–74. doi:10.1243/pime_proc_1987_201_087_02
Baby, X., Dupont, A., Ahmed, A., Deslandes, W., Charnay, G., and Michard, M. (2002). A new methodology to analyze cycle-to-cycle aerodynamic variations. SAE international. Technical Paper 2002-01-28.
Bernstein, H. (2013). Messelektronik und Sensoren: grundlagen der Messtechnik, Sensoren, analoge und digitale Signalverarbeitung. Wiesbaden, Germany: Springer.
Borée, J., and Miles, P. (2014). In-cylinder flow: encyclopedia of automotive engineering. Editors D. Crolla, D. E. Foster, and T. Kobayashi (Chichester, England: Wiley, 1–31.
Borgeest, K. (2014). Elektronik in der Fahrzeugtechnik: hardware, software, Systeme und projektmanagment. Auflage Edn. Wiesbaden, Germany. Springer.
Celik, I., Yavuz, I., and Smirnov, A. (2001). Large eddy simulations of in-cylinder turbulence for internal combustion engines: a review. Int. J. Engine Res. 2, 119–148. doi:10.1243/1468087011545389
Desantes, J. M., Galindo, J., Guardiola, C., and Dolz, V. (2010). Air mass flow estimation in turbocharged diesel engines from in cylinder pressure measurement. Experimental thermal and fluid science. 34, 37–47. doi:10.1016/j.expthermflusci.2009.08.009
Haworth, D. C. (1999). Large-eddy simulation of in-cylinder flows. Oil & Gas Science and Technology— Rev. IFP. 54, 175–185. doi:10.2516/ogst:1999012
Heckmeier, F. M., Iglesias, D., Kienitz, S., and Breitsamter, C. (2019). An innovative development of a five-hole pressure probe for highly unsteady flow phenomena,” in Proceedings of the ASME turbo expo: turbomachinery technical conference and exposition - 2019. New York, NY: American Society of Mechanical Engineers (ASME)., vol. 142. Cham: Springer. doi:10.1115/GT2019-90079
Heckmeier, F.M., Iglesias, D., and Breitsamter, C. (2020). „Unsteady multi-hole probe measurements of the near wake of a circular cylinder at sub-critical reynolds numbers.” in New results in numerical and experimental fluid mechanics XII. DGLR 2018. Notes on numerical fluid mechanics and multidisciplinary design. Editors. A. Dillmann, G. Heller, E. Krämer, C. Wagner, C. Tropea, and S. Jakirlić doi:10.1007/978-3-030-25253-3_61
Hwang, I. G., Myung, C. L., Park, S., and Yeo, G. K. (2007). Theoretical and experimental flow analysis of exhaust manifolds for pzev: sae technical paper, Technical Paper 2007-01. doi:10.4271/2007-01-3444
Jainski, C., Lu, L., Dreizler, A., and Sick, V. (2013). High-speed micro particle image velocimetry studies of boundary-layer flows in a direct-injection engine. Int. J. Engine Res. 14 3, 247–259. doi:10.1177/1468087412455746
Lomas, C. G. (2011). Fundamentals of hot wire anemometry. Cambridge, England: Cambridge University Press.
Miles, P. C. (2008). “Turbulent flow structure in direct-injection, swirl-supported diesel engines.” in Flow and combustion in reciprocating engines. Experimental Fluid Mechanics. Editors C. Arcoumanis, and T. Kamimoto (Berlin, Heidelberg: Springer). doi:10.1007/978-3-540-68901-0_4
Miles, P. C., Megerle, M., Hammer, J., Nagel, Z., Reitz, R. D., and Sick, V. (2002). Late-cycle turbulence generation in swirl-supported, direct-injection diesel engines: SAE Technical Paper Series. Technical Paper 2002-01-0891. doi:10.4271/2002-01-0891
Miles, P. C., Choi, D., Megerle, M., RempelEwert, B., Reitz, R. D., Lai, M.-C., et al. (2004). The influence of swirl ratio on turbulent flow structure in a motored hsdi diesel engine—a combined experimental and numerical study. SAE Technical Paper Series. Technical Paper 2004-01-1678. doi:10.4271/2004-01-1678
Miles, P. C., Rempelewert, B. H., and Reitz, R. D. (2007). Experimental assessment of Reynolds-averaged dissipation modeling in engine flows. SAE Technical Paper Series. Technical Paper 2007-24-0046. doi:10.4271/2007-24-0046
Miles, P. C., Rempelewert, B. H., and Reitz, R. D. (2009). Experimental assessment of a nonlinear turbulent stress relation in a complex reciprocating engine flow. Exp. Fluid. 47, 451–461. doi:10.1007/s00348-009-0669-7
Paulweber, M., and Lebert, K. (2014). Mess-und Prüfstandstechnik: antriebsstrangentwicklung, Hybridisierung, Elektrifizierung. Berlin, Germany: Springer.
Reuss, D. L. (2000). Cyclic variability of large-scale turbulent structures in directed and undirected ic engine flows. SAE Technical Paper Series. Technical Paper 2000-01-0246. doi:10.4271/2000-01-0246
van Basshuysen, R., chäfer, , and Fred, (2017). Handbuch verbrennungsmotor bad wimpfen/hamm. Auflage Edn. New York, NY: Springer.
Keywords: aerodynamic probes, in-memory data analysis, high frequency, cycle-to-cycle variability CCV, gas exchange, real time, emissions reduction, accurate lambda control
Citation: Großmann F, Mühlpfordt T, Rambacher P and Bikas G (2021) Crank-Angle Resolved Flow Measurements in the Intake Duct of a Research Engine Using Novel and Fast Response Aerodynamic Probes. Front. Mech. Eng 7:633690. doi: 10.3389/fmech.2021.633690
Received: 25 November 2020; Accepted: 07 January 2021;
Published: 22 February 2021.
Edited by:
Felix Charles Penrice Leach, University of Oxford, United KingdomReviewed by:
David Richardson, University of Bradford, United KingdomJose Ramon Serrano, Universitat Politècnica de València, Spain
Copyright © 2021 Großmann, Mühlpfordt, Rambacher and Bikas. This is an open-access article distributed under the terms of the Creative Commons Attribution License (CC BY). The use, distribution or reproduction in other forums is permitted, provided the original author(s) and the copyright owner(s) are credited and that the original publication in this journal is cited, in accordance with accepted academic practice. No use, distribution or reproduction is permitted which does not comply with these terms.
*Correspondence: Georgios Bikas, Z2Vvcmdpb3MuYmlrYXNAdGgtbnVlcm5iZXJnLmRl