 Maria Alessandra Ancona*
 Michele BianchiLisa BranchiniAndrea De Pascale
 Francesco MelinoAntonio Peretto
 Jessica Rosati
- Department of Industrial Engineering (DIN), Alma Mater Studiorum-Università di Bologna, Bologna, Italy
To face the climate change and global warming issues, European countries have set new targets in order to reduce the CO2 emissions to 40% by 2030 and to 80% by 2050. The district heating networks, and in particular low-temperature networks, due to their efficient heat supply and distribution represent a key point for meeting these goals, as well as the renewable sources integration. Nowadays, in fact, about 40% of the energy consumed in Europe is for heating, most of which is provided by fossil fuels employment. This article concerns the smart district heating, namely, the possibility of a bidirectional energy exchange between the district heating network and the connected users. The main purpose of this study is to evaluate the possibility of including a prosumer—that is, a customer who can both consume and produce heat—in an existing small/medium district heating network. To this purpose, an in-house–developed software has been applied to analyze whether and which user of the district heating network is more suitable to be set as prosumer and the effect of the installed distributed generation system on the network. The results show how the choice of a prosumer over another and how the amount of exchanged thermal power affect the performance of the network, with a consequent need of a modification in its operation and management.
Introduction
According to the recent legislations and policies, European countries have to reach new targets in terms of CO2 emissions. The new goals are set in order to decrease the current emissions level, compared to the one of the 1990, of 40% by 2030 and up to 80% by 2050 (European Climate Change Programme, 2020; Lehmann et al., 2019; Mathiesen et al., 2019). In order to reduce the CO2 of this significant amount, one of the strategies to be implemented consists in the improvement of energy systems efficiency and, at the same time, promoting the increase in the renewable sources exploitation by a major integration of renewable-based systems for energy production. In this context, the heating sector plays an important role; indeed, in the European Union, about 50% of the final energy demand is due to the heating sector (Kozarcanin et al., 2019). Furthermore, in EU Countries, an amount equal to 27% of the total final energy consumption is attributable to the household sector, most of which is due to the thermal request (Statistical Office of the European Communities, 1990). In this respect, about two-thirds of the household total energy demand is used for space heating (Statistical Office of the European Communities, 1990).
Thereby, an important role is played by the district heating (DH), and in particular the low-temperature DH. The use of low-temperature district heating, under 50°C, allows reduction of the heat losses along the pipelines and the exploitation of the low-enthalpy thermal energy sources and/or to recover the heat wasted from industries, with the consequent increase in the heat distribution efficiency (Schmidt et al., 2017).
Nowadays, in the European Union, the district heating supplies about 30% of the heat demand, 12% of which is for domestic hot water and space heating in residential buildings (Paardekooper et al., 2018).
During the years, the district heating development can be divided into five different generations. The first generation of DH systems was first introduced in the 1880’s in the Unites States. The main characteristic of this generation is the use of pressurized steam as a transportation media operating with high temperature. In fact, because of its large enthalpy content, steam was considered a good carrier fluid. However, the use of high temperatures undermines issues related to the reliability and safety of the network and high heat losses. In the second generation, which has been developed in the 1930’s, indeed, the carrier fluid consists in pressurized hot water with a temperature above 100°C. Even the third generation of DH was based on the employment of hot water but with temperatures below 100°C with a consequent increase in the network efficiency. Nevertheless, the needs for greater security, reliability as flexibility of the energy systems, and the renewable energy source integration entail the use of even lower temperatures (Lund et al., 2014). Therefore, with the fourth-generation district heating the temperature of water distribution has further decreased around 50–60°C (Lund et al., 2010). Consequently, it allows the recovery of the waste heat from the electric power plant by collecting it and sending it to the users when required. At present, the fifth generation of district heating is under development. This generation has been designed with the main purpose of further reducing the carrier fluid temperature to avoid the heat losses along the DHN (Buffa et al., 2019). The temperature is controlled by a heat exchanger in order to range from 15 to 25°C (von Rhein et al., 2019).
In addition, the low temperature characterizing the last DH generation promotes the smart district heating (SDH), namely, the possibility of a bidirectional energy exchange between the district heating network and the connected users. The bidirectionality of the flow is possible thanks to the installation of distributed generation (DG) systems at the final users, allowing the latter to act both as consumers and as producers (the so-called prosumers) (Bünning et al., 2018; Pass et al., 2018; The European Comission, 2015).
In this context, this study addresses the smart district heating topic with the main aim to investigate the possibility of converting the users of a given DHN into prosumers and how this action will affect the network performance. An existing small/medium size district heating network located within a university campus in the north of Italy has been considered as a case study. To this purpose, an in-house–developed software has been applied in order to analyze whether and which user of the district heating network is more suitable to be set as prosumer considering both the energy and economic points of view.
Smart District Heating Networks and User Substations
The smart district heating networks (SDHNs) extend the DHN concept by including the possibility of realizing a bidirectional thermal energy exchange between the district heating network and the users thanks to the installation of distributed generation systems. This allows the inclusion of one or more prosumers (i.e., producer and consumer) along the district heating network. A distributed generation system placed at the opportune user will be able to produce a part, the total or more of the needs of the user itself and then simultaneously interact with the district heating network. The difference between the user’s need and distributed generation system production will be balanced by the network: the excess of production can be introduced into the network or, on the contrary, the lack of production can be covered by the withdrawal from the network. To ensure the bidirectional energy flux, the traditional user substation has to be deeply modified. In fact, in DHNs, the traditional substation is characterized by a heat exchanger that allows the heat transfer between a primary circuit and a secondary circuit which are connected respectively to the DHN and to the user. On the other hand, in case of the distributed generation systems, a tertiary circuit is necessary in order to connect the distributed generation system with both the network and the user.
To this respect, four different configurations of smart (bidirectional) substation have been elaborated by the authors in a previous study (Ancona et al., 2015). The simplified four schemes are represented in Figure 1 (from 1A to 1D):
• Scheme 1 (feed to return—Figure 1A): a mass flow rate is taken from the feed line of the network and reintroduced in the return line after being heated from the decentralized production system.
• Scheme 2 (feed to feed—Figure 1B): the thermal energy exchange from the decentralized production system and the distribution network affects only the feed line.
• Scheme 3 (return to return—Figure 1C): the thermal energy transfer from the user to the network concerns only the return line of the network.
• Scheme 4 (return to feed—Figure 1D): a mass flow rate is extracted from the return line of the network and reintroduced in the feed line after being heated from the decentralized production system.
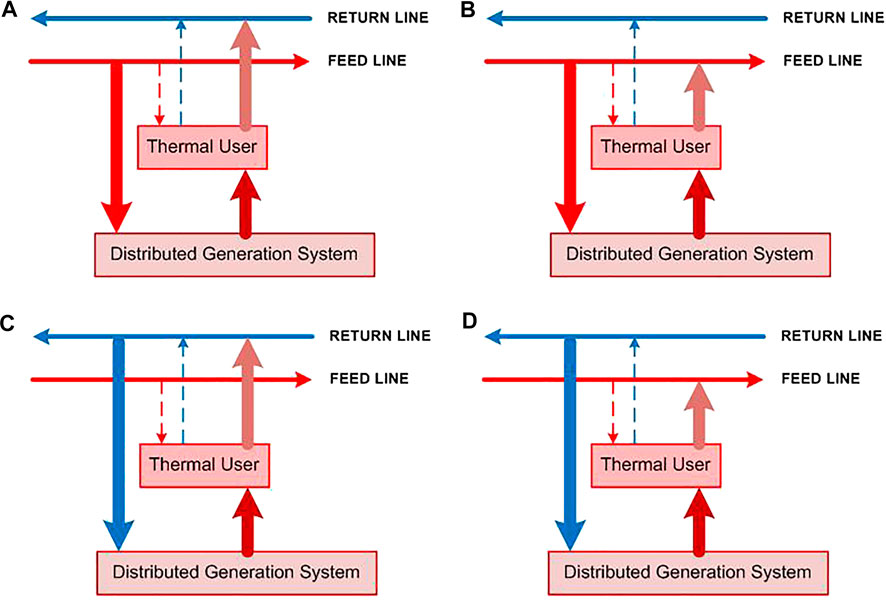
FIGURE 1. Schematic representation of (A) Scheme 1: feed to return, (B) Scheme 2: feed to feed, (C) Scheme 3: return to return, (D) Scheme 4: return to feed.
According to Figure 1, it is important to point up that the key aspect in converting a traditional district heating network into a smart one is the appropriate choice of one of the schemes of the bidirectional substation. The following observation can be done to highlight their main characteristics.
First, it can be noted that Scheme 1 is not appreciated from the network management point of view, since the temperature increase in the return line of the distributed network (and thus also in the return temperature to the thermal power station) reduces the efficiency of the centralized production systems of the network. On the other hand, this scheme represents the simplest configuration since it does not affect the network flows and, consequently, the regulation of the network will be easier for the network management.
Furthermore, by considering Scheme 2, it can be observed that the increase in the temperature mainly affects the feed line. Therefore, if the network management is able to predict and optimally control the local production, the feed temperature in correspondence of the thermal power stations can be adapted each time to the new network conditions (i.e., as an example, with the increase in the return temperature at the centralized plant, the feed temperature can be maintained constant or decreased, depending on the chosen strategy). Obviously, if the temperature is kept constant, the users located downstream with respect to the prosumer are fed by a fluid with a higher temperature: this situation may be undesired, since the downstream users may require a constant temperature (e.g., for specific internal processes) or—if equipped them too with a distributed generation system—they may be excluded from further heat introduction into the network. Furthermore, it has to be highlighted that both schemes 1 and 2 need a DG system able to produce heat at the opportune temperature level (i.e., higher than the network feed line level).
On the other hand, as aforementioned for Scheme 1, even for Scheme 3, a temperature increase in the return line occurs, making this configuration not appreciated from the network management viewpoint. Moreover, in this configuration the management of the mass flow rate taken from the return line to the generation systems is more difficult.
Finally, Scheme 4 represents the most complex among the proposed configurations, making the mass flow rate management a key issue. However, the temperature levels of both the feed and the return lines can be kept constant with this configuration, by heating the mass flow rate taken from the return line up to (and not beyond) the feed line temperature level. For this reason, this scheme is the most appreciated by the network management.
Case Study
With the main purpose of evaluating how the prosumers affect the performance of a district heating network, a small/medium size network has been analyzed. In particular, a portion of an existing DHN consisting of twelve users and located within a university campus in the North of Italy has been considered. To this respect, it has to be underlined that the district heating network provides to the fulfillment of the users’ thermal demand for the only space heating. The layout of the analyzed district heating network is shown in Figure 2, highlighting the typology of users and the corresponding ID.
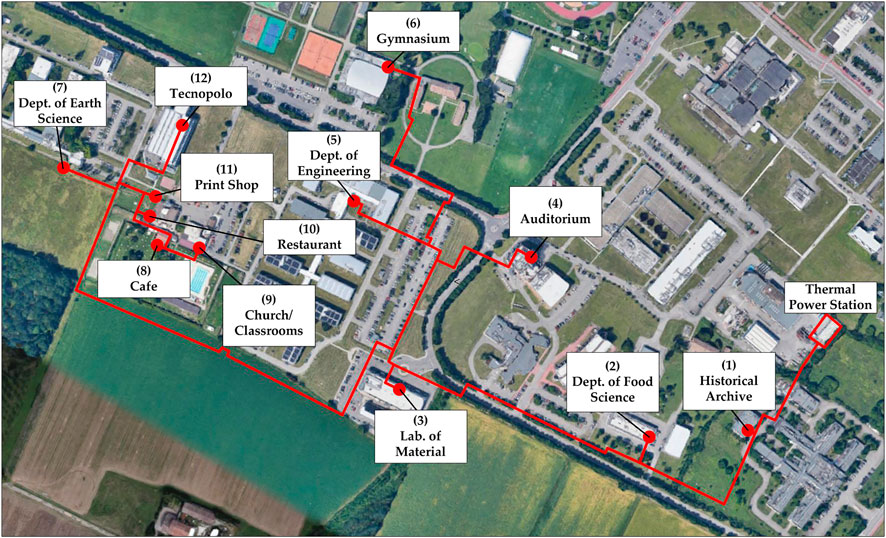
FIGURE 2. Scheme of the DHN within the university campus.
The thermal energy needs of each user in design conditions, assumed for the district heating network evaluation, are presented in Figure 3. As can be observed from the figure, the design thermal power ranges from a minimum value equal to about 25 kW (in correspondence of the users indicated with ID8) to a maximum value slightly higher than 4,500 kW (corresponding to the user identified with ID5).
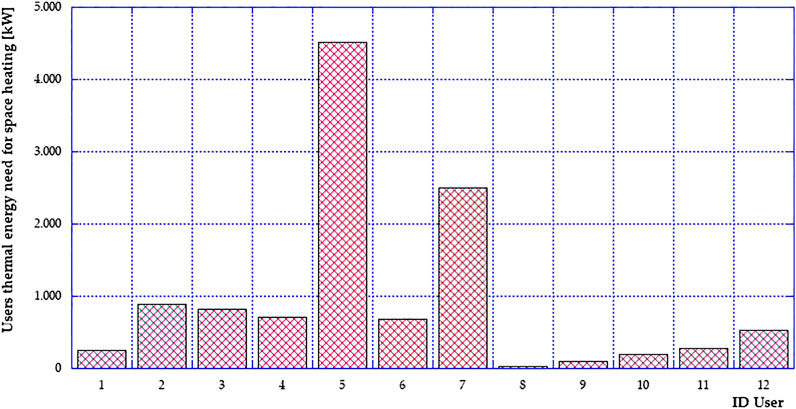
FIGURE 3. Design of thermal energy needs of the DHN users.
The thermal power station consists of five boilers and one pumping station. In more detail, the total installed thermal power is equal to 17,500 kW almost equally divided between the five boilers. Therefore, each boiler is characterized by a design thermal power equal to about 3,500 kW with a design thermal efficiency ranging between a minimum value equal to 90.4% and a maximum value equal to 95.4%. Finally, the pumping station of the thermal power plant is composed of three identical pumps, operating in parallel.
District Heating Network Analysis
The considered DHN has been implemented with IHENA (Intelligent Heat Energy Network Analysis), an in-house–developed software that allows the simulation of the district heating network behavior and provide a network resolution from both a hydraulic and a thermal viewpoint. Briefly, as it regards the hydraulic resolution of the district heating network, it is based on the Todini–Pilati algorithm generalized on the Darcy–Weisbach equation. On the other hand, the thermal evaluation is carried out by considering the forced convection heat exchange. A more detailed description of the software calculation core can be found in Ancona et al. (2014).
The results of the DHN implementation within the software IHENA is shown in Figure 4 in terms of geometric representation of the network, highlighting also the identification numbers of each node and each pipe. As can be noted from the figure, the model is composed by a total of 69 nodes—a source (i.e., the thermal power station), 12 users and 56 mixers respectively represented in yellow, red, and white—and of 68 pipes. Furthermore, the correspondence between the identification number of the users (ID User) and of the node (IDN) of each user has been also shown in Figure 4.
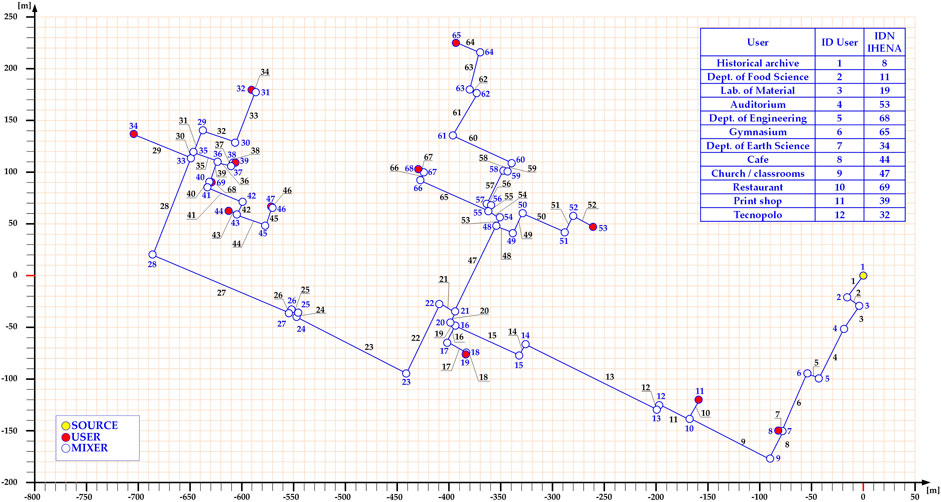
FIGURE 4. University campus DHN implementation with software IHENA.
District Heating Network Design Performance
As a starting point, the district heating network behavior in design operation has been evaluated. To this respect, the main results of the design evaluation of the network have been listed in Table 1. In particular, as can be noted from the table, the total thermal power produced by the thermal power station, equal to 11,657 kW, is due to the users’ thermal needs (equal to 11,511 kW) plus the heat dissipations along the pipeline of the networks (146 kW).
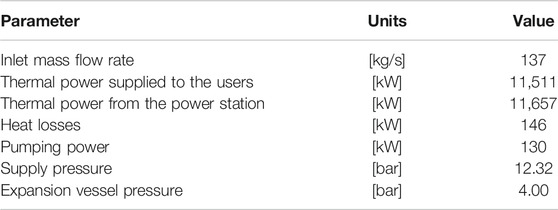
TABLE 1. Design performance results.
Furthermore, it can be observed that the total mass flow rate circulating within the DHN is equal to about 137 kg/s. This quantity is distributed between the users as shown in Figure 5A. As can be noted from the figure, the minimum value is obtained in line with the user 44 (equal to 0.30 kg/s), while the maximum value is with the user IND68 (equal to about 54 kg/s). This result is in accordance with the thermal needs of each user assumed for the simulation (see Figure 3).
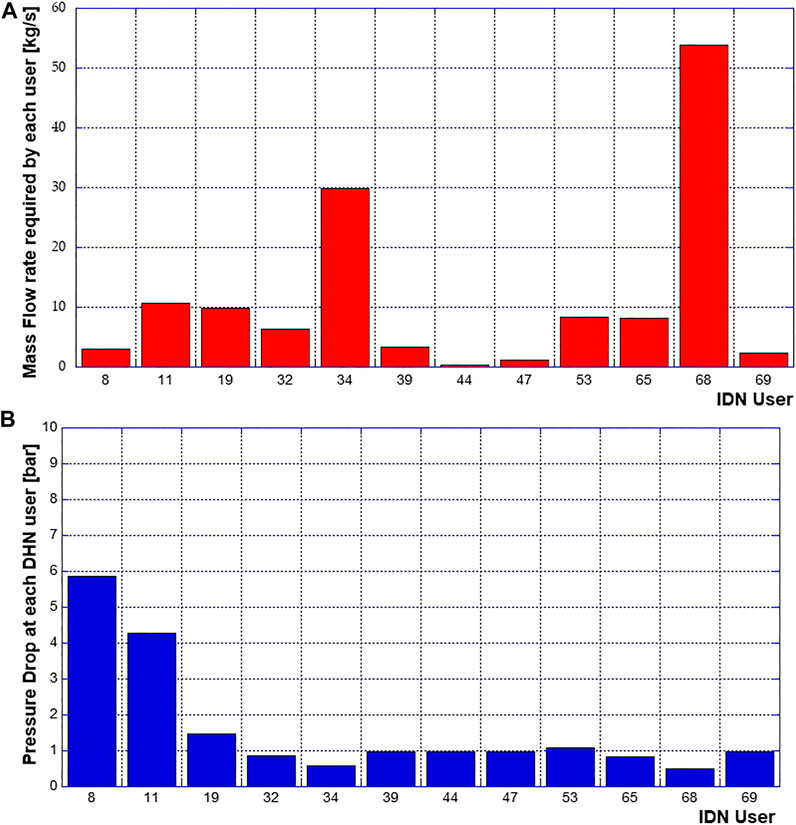
FIGURE 5. (A) Mass flow rates and (B) pressure drops among the DHN users resulting from the design evaluation.
In Figure 5B, instead, the pressure drops of each user resulting from the design analysis are presented. It can be noted that the user IDN68 is characterized by the lower value of pressure drop (equal to 0.50 bar) and therefore it is denoted as the critical users of the network. In this respect, Figure 6 shows the identification of the critical path (i.e., the path from the thermal power station to the critical user) and the flow direction of the water within the supply (feed) line of the whole network.
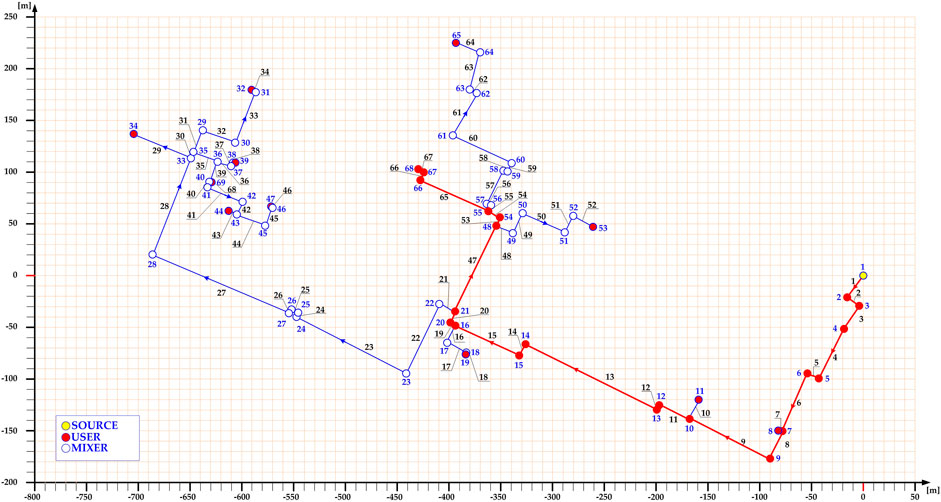
FIGURE 6. Critical path and flow direction of the water within the supply line of the network.
Prosumers Evaluation
With the aim of identifying the appropriate user that can be converted into a prosumer and to understand the effect of this conversion on the performances of the whole grid, a series of simulations have been carried out with the software IHENA. In particular, in each simulation one of the twelve users of the network has been set as prosumer (according to the scheme in Figure 1D) and thereby contributing to the thermal energy fulfillment of all the users. In fact, as already said, Scheme 4 allows the introduction of the thermal power into the network without affecting the feed and return temperatures. Obviously, since it involves a variation in the mass flow rates circulating within the pipelines, it implies some intervention on the user substation. In any case, Scheme 4 is the most appreciated solution on the management point of view.
The main hypotheses of the developed simulations are as follows:
• In each simulation, only one prosumer has been considered. This assumption has been made in order to better understand the thermohydraulic effects of the smart conversion and to define optimal criteria for the choice of the prosumer.
• With the exception of the additional pumping system at each of the considered prosumers substation, no additional pumps and/or valves have been added along the network.
• The feeding pressure has been set at the same value for both the thermal power station and the selected prosumer. The value of this parameter—which has been set in order to keep constant at 0.5 bar the minimum allowed pressure drop across the heat exchanger of the critical user—is a result of the software IHENA.
• The pressure of the expansion vessel has been kept at the design value (4 bar).This means that, according to the resolution performed by the Todini–Pilati algorithm, all the results relating to the optimal hydraulic balance of the network and, therefore, to the mass flow rates and pressures distributions depend only on the network geometry.
A first result, shown in Figure 7A, concerns the change in pumping power consumption with reference to the design case. As can be noted from the figure, the pumping power is reduced in each of the considered cases, showing a minimum value (corresponding to a reduction close to the 85% with respect of the design case) if the user IDN68 (which is the critical user in the design simulation) is chosen as prosumer.
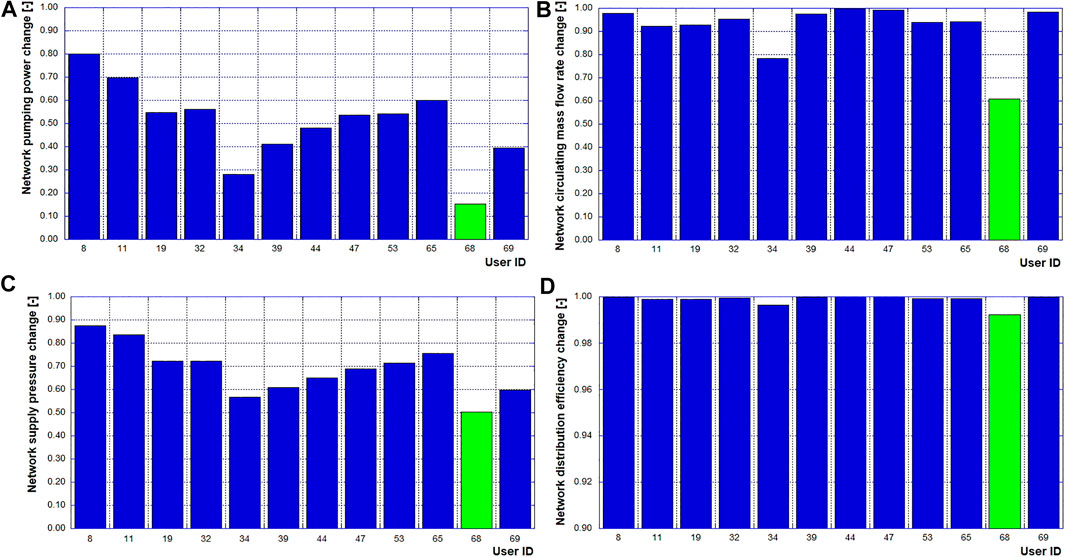
FIGURE 7. Effect on the network of prosumer allocation: (A) pumping power change, (B) circulating mass flow rate, (C) supply pressure, and (D) distribution efficiency.
As expected, the introduction of a prosumer implies a change in the circulating mass flow rate and consequently a change in the direction of the water flow along certain pipes of the network, depending on the selected user to be converted. The change in the circulating mass flow rate (Figure 7B)—evaluated as the ratio between the mass flow rates circulating in each prosumer case and in the design case, respectively—shows a minimum value corresponding to user IDN68 which allows a reduction close to 40%. On the basis of the assumed hypotheses, the supply pressure always reduces with respect to the design value (Figure 7C) and reaches its minimum value—as expected—in case of IDN68 selected as prosumer showing a value slightly higher than 6 bar.
Regarding the distribution efficiency (Figure 7D)—defined as the ratio between the thermal power provided to the users and the thermal power introduced into the network—there is no noticeable change with the introduction of a prosumer. Nevertheless, the figure confirms the opportunity of converting user IDN68.
Based on the results obtained from the simulations, the most suitable user to be converted into a prosumer is the one identified with IDN68. This choice is the most suitable from different points of views, which can be summarized as follows:
• From the design performance evaluation (Figure 5A), the user IDN68 results as the critical user, being the one at the end of the path (Figure 6) with the highest pressure losses.
• The conversion of the user IDN68 into a prosumer allows to reach the highest reduction in both the pumping consumption (Figure 7A) and the circulating mass flow rate of water (Figure 7B).
• In case of IDN68 as prosumer, the supply pressure can drop to a minimum value which also implies a reduction in the maintenance costs.
Smart District Heating Network Management
Once the appropriate user to be converted into prosumer has been identified, the key point is the understanding of the network behavior and its consequent management. These aspects depend on the size of the heat production system installed at the prosumer and on the energy system typology. In this analysis, for the sake of generality, the peculiarities of the user IDN68 (for instance, the surface available on the rooftop for the installation of the solar thermal panels and the free surface in the substation for the installation of a CHP unit) will be not considered. The aim of this study was to understand the behavior of the network as a function of the amount of thermal power introduced into the network by a prosumer.
On this basis, Figure 8 shows the required pumping power (Figure 8A), circulating mass flow rate (Figure 8B), and supply pressure (Figure 8C) changes, as a function of the thermal power produced by the IDN68 distributed generation system. As it will be better explained in the following paragraphs, different scenarios are highlighted in the figure in order to point out a series of network configurations which represent different management and setting approaches.
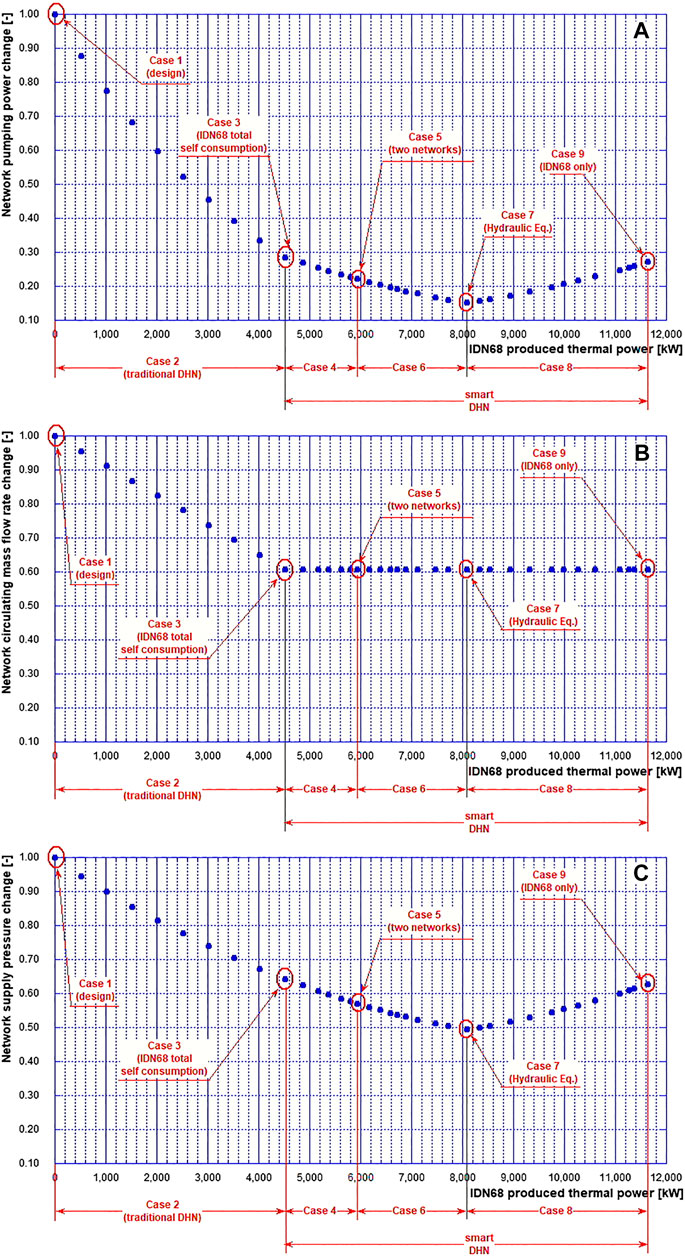
FIGURE 8. Effect of the prosumer-produced thermal power on the network: (A) pumping power, (B) circulating mass flow rate, and (C) supply pressure variation.
Furthermore, in Figure 9, the variation in the thermal power produced by the IDN1 (i.e., the thermal power station) with the increase in the production of the distributed generation system at the user IDN68 (this power output will be indicated with
• Case 1 (
• Case 2 (
• Case 3 (
• Case 4 (
• Case 5 (
• Case 6 (
• Case 7 (
• Case 8 (
• Case 9 (
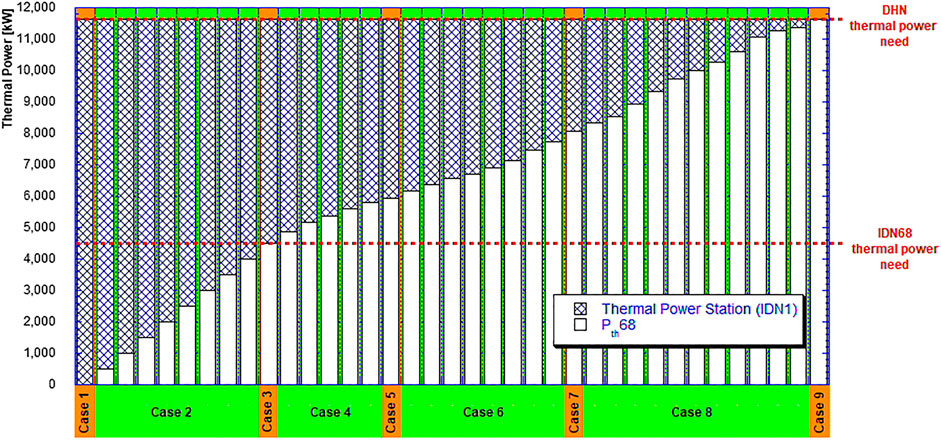
FIGURE 9. Thermal production, divided between prosumer and thermal power station, for the considered cases.
The results of the simulations clearly indicate that the behavior of the network, in terms of circulating mass flow rate, flow direction, and pressure distribution, is heavily influenced by the thermal power introduced into the network by the prosumer. Depending on this amount, the reverse flow and/or the opportunity to close a certain portion of the network were observed. It follows that the introduction into the DHN of the thermal power produced by the prosumer cannot be left free, but must be controlled by the network operator. Moreover, the case of distributed generation from renewable nonprogrammable sources at the prosumer, due to their inevitable fluctuations, could empathize the management problems of the network, causing fast setting changes. In this case, an energy storage system at the prosumer is mandatory to gain flexibility in the network operation.
On the other hand, the introduction of prosumers into a district heating network allows the reduction of the expenditure on electricity for the required pumping power and for the thermal power introduced by the centralized power station. This approach is coherent with the penetration of distributed generation, the increase in renewable sources exploitation, and the development of energy districts. It follows that, due to these positive effects, the transformation of one or more users of a traditional district heating network into prosumers should be encouraged, but the concepts at the basis of the network operation and management must be completely revised.
Concluding Remarks
This article deals with the optimal allocation of a prosumer in an existing district heating network and on the influence of its produced thermal power on the network behavior.
To this respect, an existing small/medium district heating network located in the north of Italy has been considered and analyzed by its implementation within the software IHENA.
The results of the prosumers evaluation show that the optimal allocation of a prosumer corresponds to the network critical user. This choice, indeed, allows achieving the maximum reduction in the required pumping power by realizing the optimal hydraulic balance of the network.
Once the optimal prosumer allocation has been identified, nine scenarios, representing different configurations of the district heating network by varying the ratio between the thermal power from the prosumer and the one from the thermal power station, have been simulated and analyzed.
The results confirm the benefits of the conversion of traditional district heating networks into smart networks, but—contemporarily—strongly underline that the thermal power from the prosumer must be managed by the network operator to avoid critical issues due to flow reversions and/or to pressures and mass flow rates distributions.
Data Availability Statement
The raw data supporting the conclusion of this article will be made available by the authors, without undue reservation.
Author Contributions
MA did the methodology, writing (review and editing), and conceptualization; MB participated in the supervision; LB contributed with visualization; AP participated in the supervision; FM conceived the methodology and conceptualization; AP participated in the supervision; JR did simulations and wrote the paper (original draft).
Conflict of Interest
The authors declare that the research was conducted in the absence of any commercial or financial relationships that could be construed as a potential conflict of interest.
Acknowledgments
This research was developed within the context of the Energynius (Energy Networks Integration for Urban Systems) project and funded by the Emilia Romagna Region, under the POR-FESR 2014–2020 financing. The authors gratefully acknowledge the financial support of the EU.
Supplementary Material
The Supplementary Material for this article can be found online at: https://www.frontiersin.org/articles/10.3389/fmech.2021.623932/full#supplementary-material.
References
Ancona, M. A., Bianchi, M., Branchini, L., and Melino, F. (2014). District heating network design and analysis. Energy Proc. 45, 1225–1234. doi:10.1016/j.egypro.2014.01.128
Ancona, M. A., Branchini, L., Di Pietra, B., Melino, F., Puglisi, G., and Zanghirella, F. (2015). Utilities substations in smart district heating networks. Energy. Proc. 81, 597–605. doi:10.1016/j.egypro.2015.12.044
Buffa, S., Cozzini, M., D’Antoni, M., Baratieri, M., and Fedrizzi, R. (2019). 5th generation district heating and cooling systems: a review of existing cases in Europe. Renew. Sustain. Energ. Rev. 104, 504–522. doi:10.1016/j.rser.2018.12.059
Bünning, F., Wetter, M., Fuchs, M., and Müller, D. (2018). Bidirectional low temperature district energy systems with agent-based control: performance comparison and operation optimization. Appl. Energy 209, 502–515. doi:10.1016/j.apenergy.2017.10.072
European Climate Change Programme. (2020). https://ec.europa.eu/clima/policies/eccp_en (Accessed October 15, 2020).
Kozarcanin, S., Andresen, G. B., and Staffell, I. (2019). Estimating country-specific space heating threshold temperatures from national gas and electricity consumption data. Energy Build. 199, 368–380. doi:10.1016/j.enbuild.2019.07.013
Lehmann, P., Gawel, E., and Strunz, S. (2019). “EU climate and energy policy beyond 2020: are additional targets and instruments for renewables economically reasonable?,” in The European dimension of Germany’s energy transition. (Cham, CH: Springer), 11–26.
Lund, H., Möller, B., Mathiesen, B. V., and Dyrelund, A. (2010). The role of district heating in future renewable energy systems. Energy 35 (3), 1381–1390. doi:10.1016/j.energy.2009.11.023
Lund, H., Werner, S., Wiltshire, R., Svendsen, S., Thorsen, J. E., Hvelplund, F., et al. (2014). 4th Generation District Heating (4GDH): integrating smart thermal grids into future sustainable energy systems. Energy 68, 1–11. doi:10.1016/j.energy.2014.02.089
Mathiesen, B. V., Bertelsen, N., Schneider, N. C. A., García, L. S., Paardekooper, S., Thellufsen, J. Z., et al. (2019). Towards a decarbonised heating and cooling sector in Europe. Aalborg: Aalborg Universitet.
Paardekooper, S., Lund, R. S., Mathiesen, B. V., Chang, M., Petersen, U. R., Grundahl, L., et al. (2018). Heat roadmap Europe 4: quantifying the impact of low-carbon heating and cooling roadmaps. Aalborg Universitetsforlag.
Pass, R. Z., Wetter, M., and Piette, M. A. (2018). A thermodynamic analysis of a novel bidirectional district heating and cooling network. Energy 144, 20–30. doi:10.1016/j.energy.2017.11.122
Schmidt, D., Kallert, A., Blesl, M., Svendsen, S., Li, H., Nord, N., et al. (2017). Low temperature district heating for future energy systems. Energy Proc. 116, 26–38. doi:10.1016/j.egypro.2017.05.052
Statistical Office of the European Communities. (1990). EUROSTAT: Regional statistics: reference guide. Luxembourg, LU: Eurostat.
The European Comission. (2015). Fifth generation, low temperature, high exergy district heating and cooling networks. http://cordis.europa.eu/project/rcn/194622en.html (Accessed on September 26, 2017).
Keywords: smart district heating, thermohydraulic optimization analysis, distributed generation, thermal prosumer, management optimization
Citation: Ancona MA, Bianchi M, Branchini L, De Pascale A, Melino F, Peretto A and Rosati J (2021) Influence of the Prosumer Allocation and Heat Production on a District Heating Network. Front. Mech. Eng 7:623932. doi: 10.3389/fmech.2021.623932
Received: 30 October 2020; Accepted: 08 February 2021;
Published: 12 April 2021.
Edited by:
Konstantinos Kyprianidis, Mälardalen University College, SwedenReviewed by:
Georgios Mavropoulos, National Technical University of Athens, GreeceLianshan Lin, Oak Ridge National Laboratory (DOE), United States
Copyright © 2021 Ancona, Bianchi, Branchini, De Pascale, Melino, Peretto and Rosati. This is an open-access article distributed under the terms of the Creative Commons Attribution License (CC BY). The use, distribution or reproduction in other forums is permitted, provided the original author(s) and the copyright owner(s) are credited and that the original publication in this journal is cited, in accordance with accepted academic practice. No use, distribution or reproduction is permitted which does not comply with these terms.
*Correspondence: Maria Alessandra Ancona, bWFyaWEuYW5jb25hMkB1bmliby5pdA==