 Praveen Kumar
 Yu Zhang1
 Michael Traver
 John Watson
95% of researchers rate our articles as excellent or good
Learn more about the work of our research integrity team to safeguard the quality of each article we publish.
Find out more
ORIGINAL RESEARCH article
Front. Mech. Eng. , 11 March 2021
Sec. Engine and Automotive Engineering
Volume 7 - 2021 | https://doi.org/10.3389/fmech.2021.611916
This article is part of the Research Topic Boosting and Air Handling Technologies for Advanced Power Systems View all 8 articles
The simultaneous application of new low-NOx emissions standards and greenhouse gas (GHG) rules has placed great pressure on the commercial vehicle industry and has driven demand for innovative solutions. One potential solution, gasoline compression ignition (GCI), utilizes gasoline’s lower reactivity to promote partially premixed combustion and extract efficiency while reducing the PM-NOx trade-off curve. Gasoline’s volatility allows for the use of higher levels of exhaust gas recirculation (EGR), a key enabler of GCI combustion. In order to deliver higher levels of EGR while maintaining sufficient boost pressure, a tailored and efficient air-handling system is critical. This work presents the analysis-led development of a low-NOx GCI air-handling system including both turbocharger matching and EGR configuration for a prototype heavy-duty GCI engine based on a model year 2013 Cummins ISX diesel engine using low octane gasoline (RON80). In the analysis-driven development process, a 1D engine system-level analysis was closely coupled with closed-cycle 3D CFD GCI combustion development. Three different boost systems were investigated using a validated 1D engine model: 1) the production turbocharger; 2) an off-the-shelf single-stage waste-gate turbocharger; 3) a prototype single-stage variable geometry turbocharger. For each boost system, three EGR configurations were evaluated: 1) a high-pressure EGR route; 2) a low-pressure EGR route; 3) a dual-loop EGR route. The air-handling system performance was first investigated over five steady-state engine operating conditions extracted from the ramped modal cycle supplemental emissions test. Then, through cosimulation using a Simulink-based engine controls model, the best performing candidates under transient operation through the Heavy-Duty Federal Test Procedure certification cycle were identified. The production turbocharger, designed for 4–6 g/kWh engine-out NOx, suffered from low combined turbocharger efficiency under the low-NOx GCI thermal boundary conditions. The prototype 1-Stage variable geometry turbocharger, when used with a high-pressure EGR configuration, demonstrated higher combined efficiencies, while the waste-gate turbocharger showed the best results when used with a dual-loop EGR system. All low-pressure only EGR configurations were found to incur additional pumping penalties due to the need for a back pressure valve to drive sufficient EGR levels. In the transient test cycle analysis, the single-stage high-pressure EGR system was capable of delivering the target boost and EGR, while the off-the-shelf waste-gate turbocharger, with its higher mass inertia, showed slower turbine response and a resulting lag in boost response. Unsurprisingly, the dual-loop EGR system also suffered from delays in EGR delivery during engine acceleration. In summary, the prototype single-stage variable geometry turbocharger with a high-pressure EGR system produced the best performance over both the steady-state and transient engine cycles and was identified as the best candidate for the prototype low-NOx heavy-duty GCI engine.
Modern diesel engines have relied on a combination of combustion and exhaust after-treatment advancements to comply with the US 2010 oxides of nitrogen (NOx) and particulate matter (PM) standards (0.27 g/kWh and 0.013 g/kWh, respectively). However, the latest regulation from the California Air Resources Board (CARB) reduces allowable NOx emissions to an ultralow level of 0.027 g/kWh by 2027 for on-road heavy-duty engines (Robertson, 2017; California Air Resources Board (CARB), 2020).
This new rule poses a significant challenge for manufacturers using existing engines and NOx after-treatment systems. In order to comply with this new rule, both the combustion and the after-treatment system need to be substantially improved while also increasing fuel efficiency since greenhouse gas (GHG) emissions regulations must also be met. Relying solely on after-treatment to meet the requirements is likely to drive more complex and costly systems, and so alternative combustion concepts that can deliver high fuel efficiency at a reduced engine-out NOx level will become attractive.
Gasoline compression ignition (GCI) has shown the potential to provide such high efficiency and low NOx and PM emissions (Kalghatgi et al., 2007; Kalghatgi et al., 2010; Manente et al., 2010b; Ra et al., 2011; Chang et al., 2013; Sellnau et al., 2015; Zhang et al., 2016; Zhang et al., 2017). The concept leverages gasoline’s low reactivity and high volatility to enhance air utilization and promote partially premixed combustion, thereby producing low particulate emissions and exhibiting high fuel efficiency potential. To date, most GCI research reported in the literature has been performed using a low-temperature combustion (LTC) strategy. These LTC strategies demand high boost pressure and exhaust gas recirculation (EGR) rates. Developing an adequate and practical air-handling system that can deliver high rates of both is key to bringing this technology into practical application.
Chadwell et al. (2011) numerically studied the efficiency potential of several LTC concepts under high dilution levels in a multicylinder Caterpillar C15 heavy-duty engine. The authors noted that increasing EGR rate beyond 40% incurred high pumping losses. Constrained by the turbocharger efficiency, the advanced LTC concepts failed to exceed the brake thermal efficiency (BTE) levels of conventional diesel combustion. In the absence of an efficient variable geometry turbocharger to drive the necessary levels of EGR, a dual-loop configuration was examined by Joo et al. (2012) in an effort to produce engine-out NOx at levels below 0.27 g/kWh in a modified stock MY2009 Maxxforce13 heavy-duty diesel engine. Beyond mid-load conditions, the engine system incurred excessively high pumping losses due to the high boost pressure requirements.
Manente et al. (2010a, 2010b) studied low-temperature GCI combustion extensively in a single-cylinder engine. By maintaining intake temperatures near 30 °C and using a highly lean air-fuel mixture (lambda > 1.3), the authors reported a peak gross, indicating efficiency over 54%. Also, over 50% EGR rates were employed to meet the 0.27 g/kWh NOx limit in conjunction with high boost pressure.
Tuner et al. (2013) numerically investigated the potential of GCI combustion using an off-the-shelf 2-Stage boosting system with a low-pressure EGR loop in a multicylinder Scania D13 heavy-duty engine. Pumping losses three times higher than conventional diesel combustion were noted due to high airflow and EGR rates.
The challenges of using high levels of EGR and boost pressure to enable low-temperature GCI combustion led Aramco to explore a different low-NOx GCI combustion strategy that required moderate levels of EGR levels and boost pressure. Zhang et al. (2016); Zhang et al. (2017); Zhang et al. (2018) studied GCI combustion using a wide range of low octane gasolines (research octane number, RON-58 to RON-93) in a 15 L heavy-duty diesel engine. High indicated efficiency and reduced NOx and particulate emissions were demonstrated. Through split fuel injection strategies, excessive maximum pressure rise rates were effectively controlled when using market-representative gasoline.
Furthermore, by conducting 3D CFD analysis (Zhang et al., 2018), a tailored GCI combustion system involving a customized piston bowl geometry, injector spray pattern, and intake thermal boundary conditions were developed for an engine with a compression ratio (CR) of 16.5. The engine-out NOx targets were established in the 1–1.5 g/kWh range, a level aimed at developing GCI as a cost-effective means to meet the future ultralow NOx standard.
The thermal boundary conditions in the combustion chamber (i.e., pressure, temperature, and O2 and CO2 concentration at intake valve closing (IVC)), derived from the -D CFD analysis, were then evaluated through 1D engine cycle simulations. The evaluation was focused on 1-stage turbocharging, including both variable and fixed geometry turbochargers, in order to minimize the exhaust system mass needing to be heated during cold start. In addition, both high-pressure and dual-loop EGR layouts were investigated (Kumar et al., 2017; Kumar et al., 2019). In total, five air-handling system (AHS) configurations were analyzed under steady-state operation to identify the best combination of efficiency and performance.
As part of the on-going effort to develop a tailored, high-efficiency, low-NOx GCI AHS, the work presented here expanded on these past development activities. It incorporated an extensive investigation of EGR layouts across three turbochargers, covering nine AHS configurations. In addition to steady-state analysis, the AHS performance was evaluated under transient operation using a predictive combustion model in GT-Power and performing cosimulation between GT-Power and Matlab Simulink.
A model year (MY) 2013 Cummins ISX15 heavy-duty (HD) diesel engine, used in previous experimental GCI investigations (Zhang et al., 2016; Zhang et al., 2017; Zhang et al., 2018), served as the basis for the simulation work in this article. Table 1 shows the engine specifications. The base engine was modified to a lower CR of 16.5 and the fuel used was gasoline with a RON of 80. The A, B, and C speeds used in the Supplemental Emission Test (SET) cycle were calculated to be 1,150, 1,375, and 1,600 rpm. Figure 1 shows the 12-mode nonidle SET cycle with the five key operating conditions analyzed in the study highlighted.
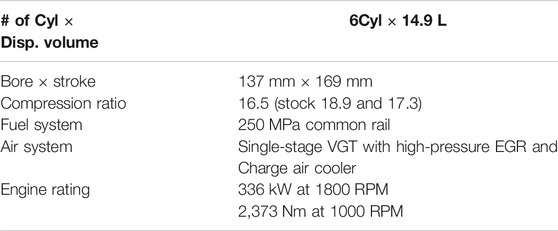
TABLE 1. Base engine specifications.
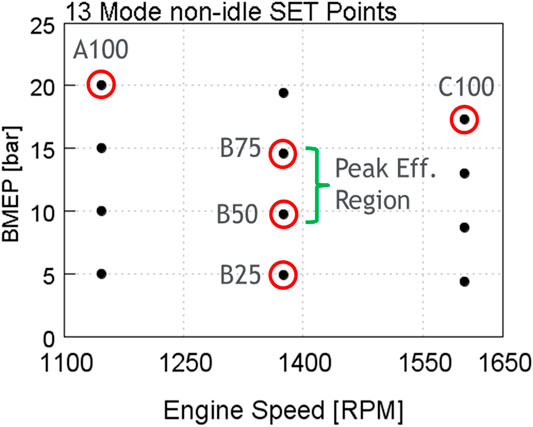
FIGURE 1. Five key operating points from the 13 mode non-idle SET cycle.
For the low-NOx GCI AHS analysis, a GT-Power 1D engine cycle analysis was closely coupled with a 3D CFD-guided combustion strategy development. As expected, the existing limitations of the 1D combustion model compromised GCI combustion accuracy, particularly the premixed portion of the combustion. A 1D and 3D CFD close-coupled methodology was adopted to ensure higher fidelity GCI combustion prediction. Figure 2 shows the flowchart for the 1D and 3D CFD close-coupled modeling methodology. The details of the 3D CFD model calibration and 1D engine model calibration are discussed in the following sections.
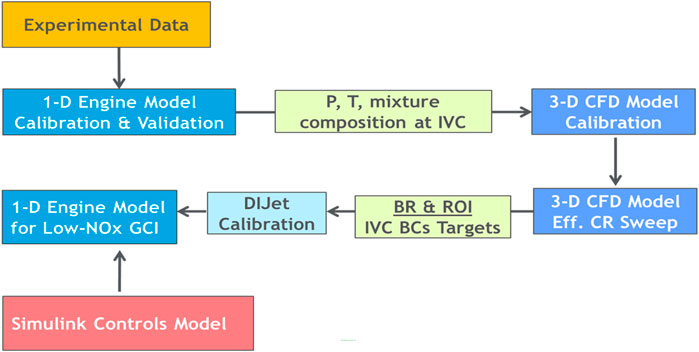
FIGURE 2. 1-D and 3-D model coupling methodology.
The commercial CFD software, CONVERGE, was used to perform closed-cycle, 3D CFD-guided combustion strategy development (Convergent Science Inc. (CSI), 2018). The CFD model setup has been described in detail previously (Zhang, et al., 2017; Zhang, et al., 2018) and Table 2 provides a brief summary of the key submodels used in the combustion CFD analysis.
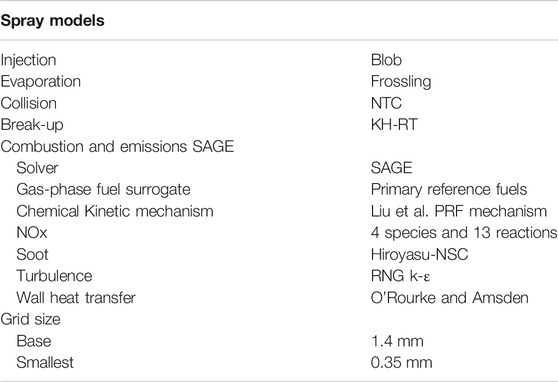
TABLE 2. Primary CONVERGE submodels.
A primary reference fuel (PRF) blend was selected as the gas-phase surrogate for the RON80 gasoline. The reduced PRF mechanism from Liu et al. (2012), consisting of 44 species and 139 reactions, was used to simulate the gas-phase reaction chemistry. NOx emissions were predicted using a reduced mechanism that includes four species and 13 reactions (Golovitchev et al., 2000). The rate of injection profiles for the RON80 gasoline was calculated based on those of diesel and the density difference between diesel and the RON80 gasoline. The spray model inputs were estimated from a previous gasoline spray characterization experimental work conducted by Meng et al. (2018).
As described in Zhang et al. (2018), the CFD model was validated against RON80 GCI experimental test results at B25, B50, and B75, covering a wide spectrum of both partially premixed and diffusion combustion processes. As reported, the CFD model showed reasonably good fidelity when capturing the global combustion behavior and the NOx and soot emissions.
Following the CFD model validation, combustion strategy development was performed across all the 13 SET modes using a split fuel injection strategy. The new combustion system had a geometric CR of 16.5 that consisted of a custom-designed piston bowl geometry and fuel injection spray pattern. Figure 3 provides a summary of the fuel injection strategy and the modeled performance results over the nonidle SET 12 modes. Thermal boundary conditions were carefully developed to enable efficient and clean GCI combustion at 1–1.5 g/kWh engine-out NOx. These boundary conditions served as targets to evaluate different AHS concepts in the 1D engine cycle analysis. The global combustion behavior (cylinder pressure and burn rate) can be found in Figures 4, 5.
FIGURE 3. (A) Low NOx GCI fuel injection strategy and (B) predicted low NOx GCI combustion performance.
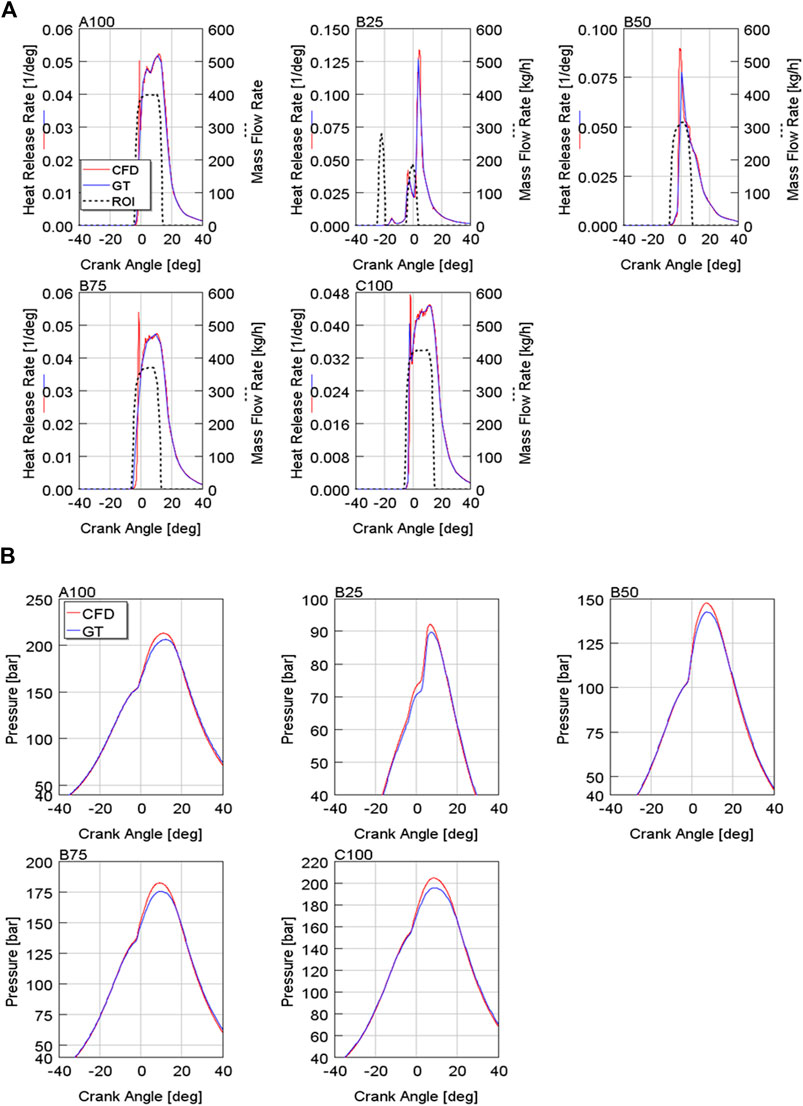
FIGURE 4. (A) CFD generated burn rate and normalized rate of injection profiles and (B) In-cylinder pressure traces match between 3-D CFD and 1-D for RON80 at CR16.5. (NOx ∼ 1–1.5 g/kWh).
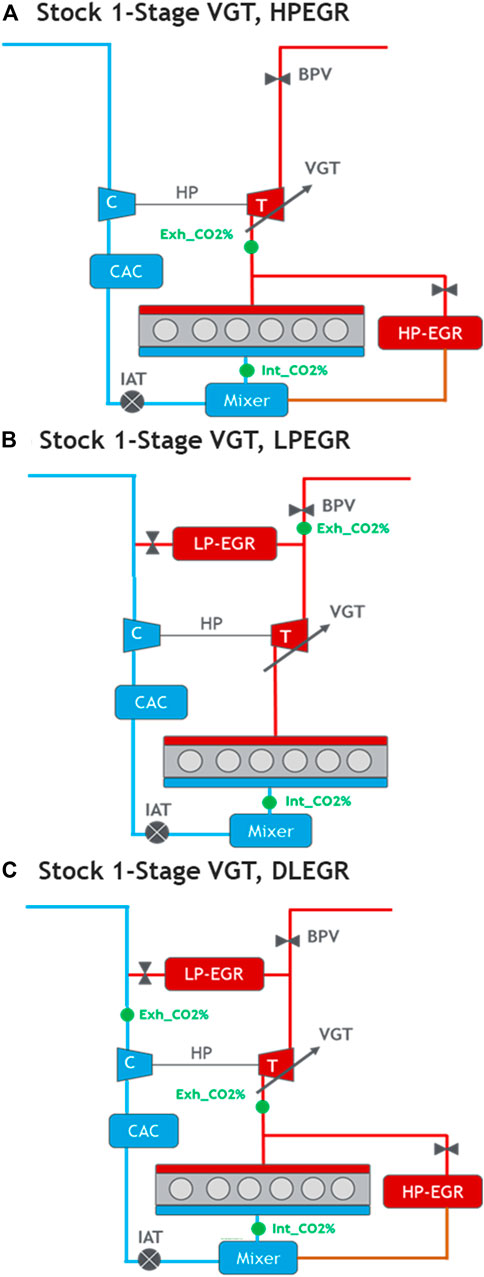
FIGURE 5. The engine setup schematic using Stock 1-Stage VG Turbocharger with (A) HPEGR, (B) LPEGR and (C) DLEGR.
A GT-Power 1D engine model that was originally calibrated for ultralow sulfur diesel (ULSD) at 18.9 CR was modified to capture GCI combustion performance using RON80 gasoline. The details of the 1D engine model calibration and validation have been previously published (Kumar et al., 2017; Kumar et al., 2019) and are summarized here briefly.
In the 1D engine model, the capacity of the charge air cooler (CAC) was increased to maintain the CAC outlet temperature in the range of 44–47°C. The effectiveness of the high-pressure (HP) EGR cooler was adjusted to attain a practical EGR cooler-out temperature range of 120–130°C. This resulted in an intake temperature range of ∼65–70°C. For low-pressure (LP) EGR configurations, an EGR cooler-out temperature of 70–80°C was kept to avoid water condensation. The engine exhaust backpressure was carefully adjusted by assuming no change in the after-treatment sizing. We took care when adjusting the global heat transfer multiplier under LTC operation to avoid inflated brake efficiency predictions. During calibration, the “Woschni-GT” heat transfer model was found to be strongly dependent on the combustion mode and CR. In this work, a 0.65 heat transfer model multiplier was used.
As shown in the flowchart (Figure 2), the 3D combustion CFD analysis first generated the burn rate profiles and the normalized rate of injection shapes (Figure 4A). They were then imposed in the 1D engine model setup. As seen in Figure 4B, the validated 1D model exhibited reasonable accuracy in capturing the in-cylinder pressure traces (peak-to-peak error within 5%) that represented the global combustion behavior from the low-NOx GCI combustion. Table 3 shows the 3D CFD generated air-thermal boundary condition targets, including boost pressure, EGR rate, temperature, and gross indicated efficiency, at five key operating conditions in the SET test cycle.
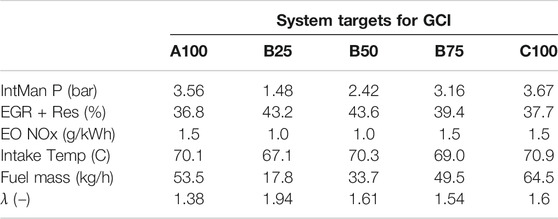
TABLE 3. 3D CFD generated system targets for RON80 at CR16.5.
To deliver the boost pressure and EGR rate targets for GCI combustion (Table 3), the following three turbocharger systems were investigated:
I) Stock Single-Stage Variable Geometry (1-Stage VG) Turbocharger.
II) Advanced Single-Stage Waste-Gate (1-Stage WG) Turbocharger.
III) Advanced Prototype Single-Stage VG Turbocharger.
The stock 1-Stage VG Turbocharger evaluation was performed to understand the limitations on the turbocharger efficiency and serve as the baseline.
In terms of EGR delivery, three layouts were considered: a) high-pressure EGR (HPEGR); b) low-pressure EGR (LPEGR); c) dual-loop EGR (DLEGR). Since the turbocharger performance and the EGR layout were closely coupled, each boost system was investigated with each of the three EGR layouts to explore the maximum efficiency potential for each individual turbocharger system.
To quantify the efficiency of each boost system, a combined turbocharger efficiency was calculated as
where
To quantify each AHS configuration’s impact on engine performance, pumping losses were estimated as a percentage of the total fuel energy:
For EGR configurations, the EGR rate was estimated as follows:
where
For EGR rate estimation in a LPEGR configuration, the exhaust CO2 concentration was measured downstream of the LP route.
In a dual-loop EGR configuration, EGR rate was estimated using the ratio of CO2 concentrations in the intake and exhaust manifolds (see Eq. 1). To quantify the EGR rate split between the HP and low-pressure routes, CO2 concentration downstream of the LPEGR cooler was identified and the following correlation was used to estimate the LP portion as follows:
Using the EGR rate and LPEGR portion correlations, the HPEGR proportion (HP-Prop%) was estimated as follows:
In this investigation, no two-stage turbocharger system was considered due to the associated cost, complexity, and packaging challenges.
The steady-state performance of the various AHS configurations is discussed in the following sections, accompanied by a detailed energy balance analysis. A transient analysis was also conducted in order to evaluate the response of the most attractive boost system candidates.
First, the stock single-stage variable geometry turbocharger was evaluated under the following three AHS configurations:
• AHS (Ia): Stock 1-Stage VG Turbocharger, HPEGR (Figure 5A).
• AHS (Ib) Stock 1-Stage VG Turbocharger, LPEGR (Figure 5B).
• AHS (Ic) Stock 1-Stage VG Turbocharger, DLEGR (Figure 5C).
The stock turbocharger system was originally developed for engine-out NOx levels of 4–6 g/kWh to comply with EPA2010 regulations. When employed to meet the low-NOx GCI targets using HP EGR layout as shown in Figure 5A, it was shown to deliver excessively high-flow ranges. This deteriorated the compressor efficiency by shifting operation towards the compressor surge line. At the same time, the turbine struggled to build up sufficient expansion ratios as the exhaust gases were routed away from the turbine inlet. This led to more closed turbine rack positions, shifting the turbine operation away from its high-efficiency range. The dual impact of the reduced compressor and turbine efficiencies led to a large decline in the combined turbocharger efficiencies (Figure 6A) and high pumping losses (Figure 6B). As a result, the AHS (Ia) could not meet the boost pressure and EGR flow targets for GCI over most of its operating range.
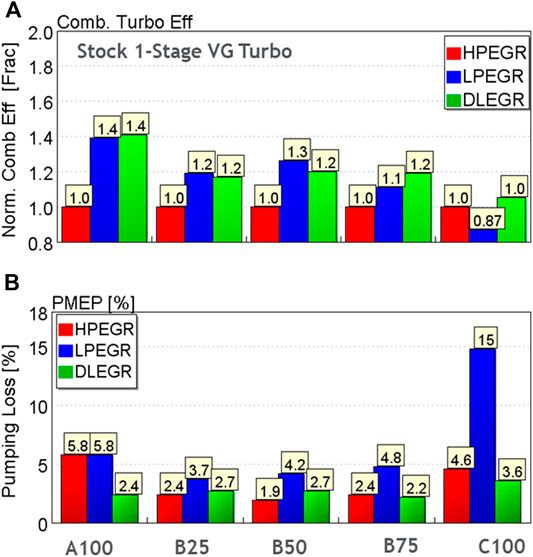
FIGURE 6. (A) Normalized combined turbo efficiencies and (B) PMEP % comparisons for Stock 1-Stage VG Turbocharger using various EGR configurations.
Using LPEGR, the performance of the stock turbocharger was expected to improve since the increased flow would better match the large compressor wheel trim that was designed for higher engine-out NOx levels. Figure 5B shows the schematic of AHS (Ib). For the compressor, the charge mixture (fresh air and EGR) through the compressor moved the A100, B25, and B50 conditions closer to the peak efficiency region. However, for B75 and C100, the compressor operation shifted closer to the choke regions. At C100, due to high choke conditions, the compressor efficiency dropped dramatically. For turbine operation, the LP loop allowed for more relaxed turbine rack positions and higher efficiency for A100, B25, and B50. However, at B75 and C100, to compensate for the deteriorated compressor efficiency, the turbine rack had to be closed more and this led to reduced turbine efficiency. As a result, except at C100, the combined turbocharger efficiency was improved by 10–40% (Figure 6B) over the baseline AHS (Ia) configuration. At C100, due to the near choked operation, the combined turbocharger efficiency was ∼13% worse than AHS (Ia). Interestingly, despite decent combined turbocharger efficiencies, AHS (Ib) incurred higher pumping losses (shown in Figure 6B) due to higher exhaust pressures induced by the backpressure valve (BPV) throttling that was required to drive LPEGR flow.
A dual-loop EGR configuration offered the potential to optimize turbocharger performance using the HP and LP loops simultaneously. Figure 5C shows the schematic of the 1D setup with a DLEGR configuration. The presence of both HP and LP loops provided flexibility in exhaust flow distribution across the turbine. For each operating point, a sweep of HP-Prop% with a range of 0-100% was conducted, where 0 means LP only and 100% means HP only. An optimum HP-Prop% was selected based on the best system efficiency. For low-flow conditions (A100, B25, and B50), up to 40–50% of the total EGR flow was routed through the LP loop and this ensured efficient turbine and compressor operation. For high-flow conditions such as B75 and C100, a dominant HP portion was preferred for more balanced turbocharger efficiency. This approach improved the combined turbocharger efficiencies by 10–40% relative to the HPEGR-only route. As a result, the pumping losses were kept within the range of 2.2–3.6% of the total fuel energy while still meeting the boost pressure and EGR targets.
Due to the observed limitations of the stock turbocharger, a high-efficiency 1-Stage waste-gate (WG) turbocharger was evaluated as the next step. The flow ranges for the compressor and the turbine were slightly smaller than that of the stock turbocharger. The advanced WG turbocharger was evaluated with the following AHS configurations:
• AHS (IIa): Advanced 1-Stage WG, HPEGR (Figure 7A).
• AHS (IIb): Advanced 1-Stage WG, LPEGR (Figure 7B).
• AHS (IIc): Advanced 1-Stage WG, DLEGR (Figure 7C).
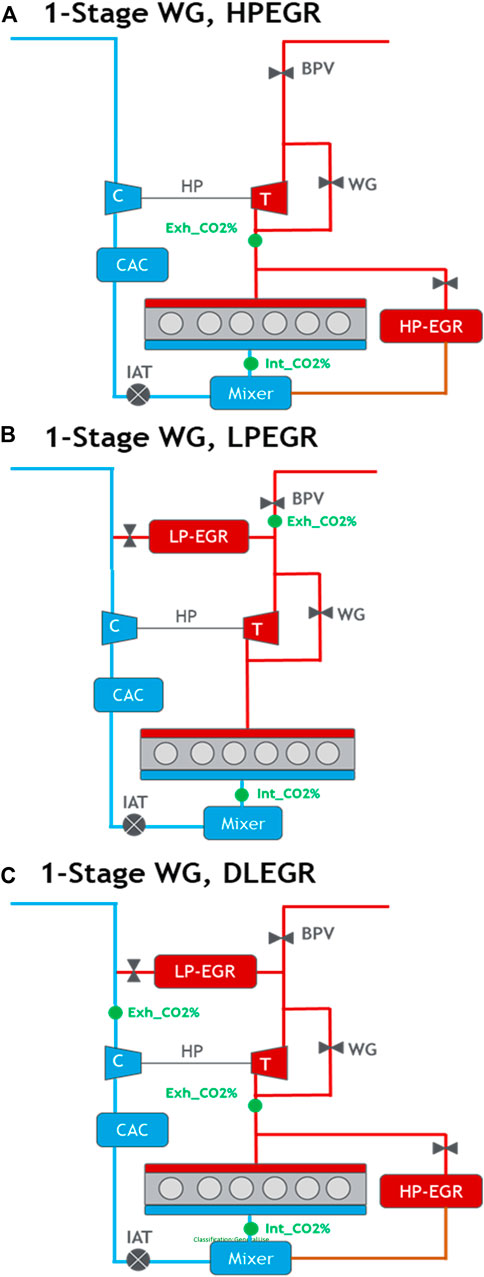
FIGURE 7. The engine setup schematics using advanced 1-Stage WG Turbocharger with (A) HPEGR, (B) LPEGR and (C) DLEGR.
Figure 7A shows the schematic for the advanced 1-Stage WG turbocharger and a HPEGR-only layout. At each operating point, the turbine waste-gate and the HPEGR valve were closed-loop controlled for the targeted boost pressure and EGR rate, respectively. The compressor matching performance is shown in Figure 8A. For A and B speeds, the compressor flow range was reasonably matched and resulted in acceptable compressor efficiency. For high-flow conditions, such as C100, the compressor operated in a slightly reduced efficiency region. Due to the high compressor and turbine efficiencies, AHS (IIa) demonstrated 10%–50% better combined efficiencies over the stock air system (Figure 9A). At B50, due to a relatively large turbine wheel trim (76 mm) and housing A/R, the turbine inlet pressure could not be raised high enough to drive sufficient HPEGR flow. By applying BPV throttling, the EGR target could be met, but the turbine expansion ratio deteriorated, resulting in inadequate boost pressure. Overall, the AHS (IIa) failed to meet the boost pressure and EGR flow targets at all operating points for GCI.
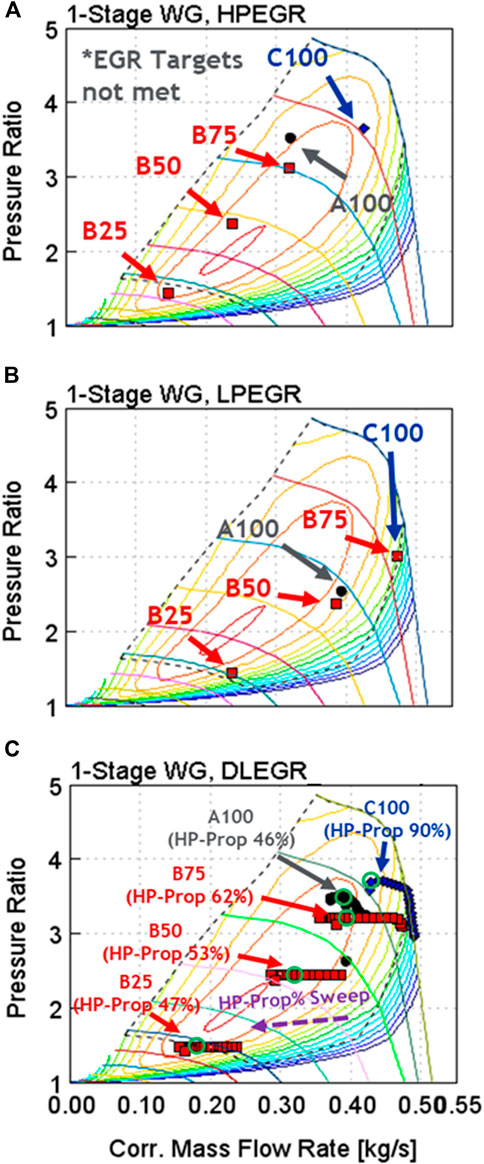
FIGURE 8. Turbocharger-Engine matching for the advanced 1-Stage WG Turbocharger using (A) HPEGR, (B) LPEGR and (C) DLEGR configurations.
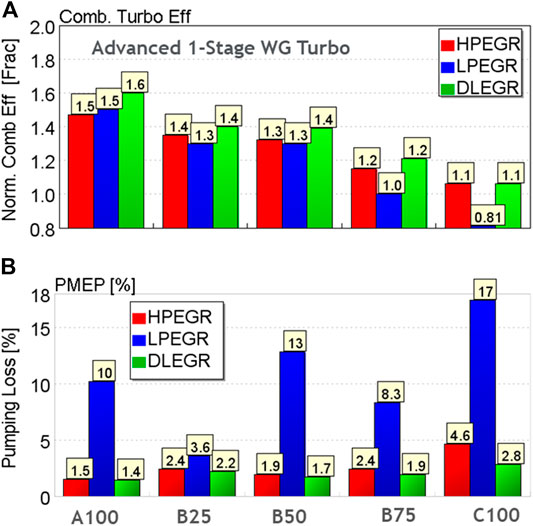
FIGURE 9. (A) Normalized combined turbo efficiencies and (B) PMEP % comparisons for advanced 1-Stage WG Turbocharger using various EGR configurations.
Next, the 1-Stage WG turbocharger was evaluated with a LPEGR configuration, as shown in Figure 7B. In this engine setup, the EGR rate was regulated by actuating both the LPEGR valve and the BPV in closed-loop control. To minimize restrictions, the LPEGR valve was maintained at a nearly fully open position and the BPV was throttled to drive EGR through the LP route. Similar to AHS (II.a), the boost pressure was regulated by controlling the turbine waste gate. Figure 8B shows the compressor matching surface plot for the five key engine conditions. With the LPEGR-only setup, all the operating points shifted towards the right side of the compressor map. This caused a significant decline in compressor efficiency (Figure 9A) and induced compressor choking at B75 and C100. On the exhaust side, the BPV throttling required to drive LPEGR resulted in PMEP consuming 10–17% of the total fuel energy at the A100, B75, and C100 operating conditions (Figure 9B). Overall, AHS (IIb) configuration did not perform well for the GCI flow targets.
Figure 7C shows the schematic for a dual-loop EGR layout using the advanced 1-Stage WG turbocharger. For this configuration, a sweep of HP-Prop% from 0 to 100% was conducted at each operating condition. Figure 8C shows compressor matching performance with respect to the high-pressure HP-Prop% sweep across the five operating points. Increasing HP-Prop% facilitated a compressor operation shift towards the central high-efficiency region of the compressor map. For A100, B25, and B50, 40–50% HP-Prop% was most impactful on compressor operation. For high-flow conditions such as B75 and C100, higher proportions of HPEGR enabled higher compressor efficiency and the risk of compressor choking was eliminated. With the ability to shift the compressor operation into the high-efficiency island, the dual-loop configuration resulted in the best combined turbocharger efficiencies for the advanced 1-Stage WG turbocharger (Figure 9A). The flexibility in EGR flow distribution between HP and LP loop allowed the EGR flow targets to be readily met without aggressive BPV throttling. The AHS (IIc) resulted in PMEP in the range of 1.4%–2.8% (Figure 9B) while successfully meeting the GCI flow targets.
An advanced high-efficiency 1-Stage VG turbocharger prototype was developed by the BorgWarner Advanced Technology Division to seek an even better performance. Compared to a fixed geometry WG turbine, the VG turbine design offered improved controllability of the EGR flow and boost pressure across a wider range of engine operating conditions. The compressor and turbine performance maps used in this work were generated from flow-bench measurements. The flow ranges for the compressor and turbine were kept smaller than that of the stock turbocharger while providing competitive compressor and turbine efficiencies. The same three EGR layouts were investigated using the prototype 1-Stage VG turbocharger:
• AHS (IIIa): Advanced 1-Stage VGT, HPEGR.
• AHS (IIIb): Advanced 1-Stage VGT, LPEGR.
• AHS (IIIc): Advanced 1-Stage VGT, DLEGR.
Figure 10A shows the prototype turbocharger matching results under the HPEGR-only layout. The compressor matching surface plot shows a well-matched flow range and efficiency for the low to mid-speed conditions, with the peak compressor efficiency well aligned with the B50 and B75 conditions. The turbine wheel and housing appeared to be well sized to match the HPEGR configuration and the turbine rack positions were found to operate in the best efficiency range. At C100, the compressor operated at a near choking condition, leading to deteriorated compressor efficiency. To recuperate the turbocharger’s performance, the turbine rack position was closed further in an attempt to raise the expansion ratio across the turbine, thus causing inefficient turbine operation. As shown in Figure 11A, at A speed and B speed conditions, the combined turbocharger efficiency was improved by 20–60% over the stock turbocharger. At C100, due to lower turbine and compressor efficiencies, the combined turbocharger efficiency was at a level equivalent to the stock turbocharger. Figure 11B shows the PMEP consumption pertaining to the prototype 1-Stage VG turbocharger. Using the HPEGR configuration, the pumping losses were held within the 0.9–2.2% range at A and B speeds but suffered a notable increase to 4.5% at C100 due to deteriorated turbocharger efficiency.
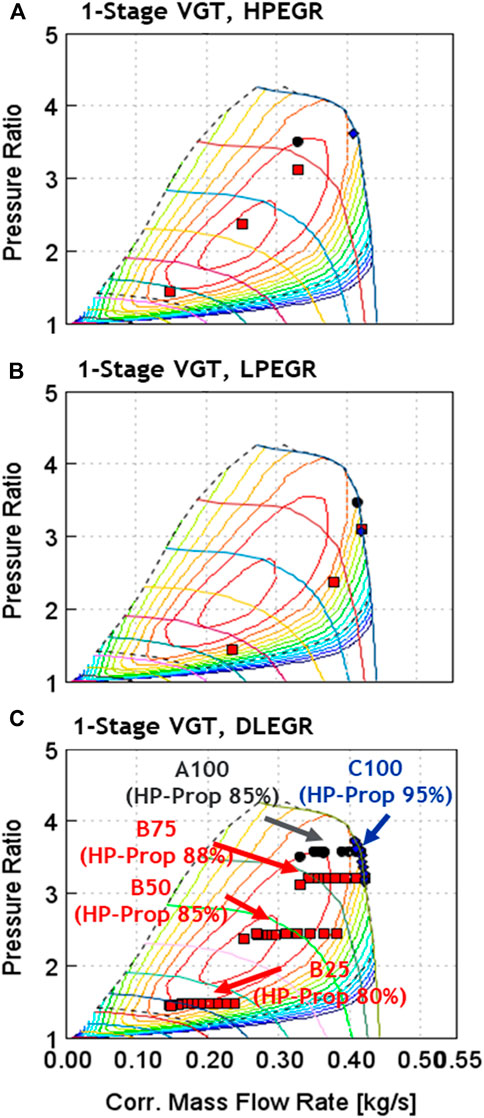
FIGURE 10. Turbocharger-Engine matching for the advanced 1-Stage VG Turbocharger using (A) HPEGR, (B) LPEGR and (C) DLEGR configurations.
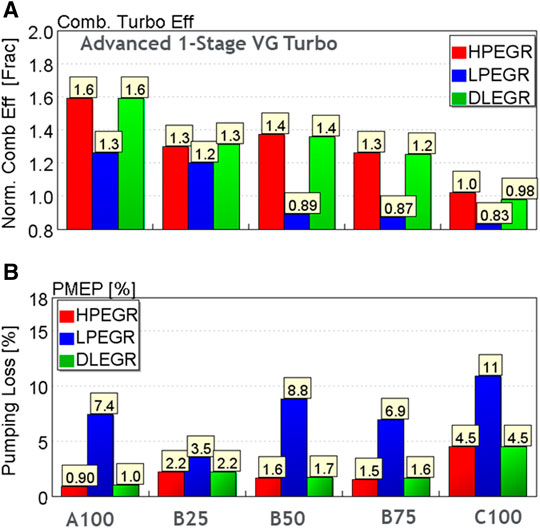
FIGURE 11. (A) Normalized combined turbo efficiencies and (B) PMEP % comparisons for advanced 1-Stage VG Turbocharger using various EGR configurations.
In the LPEGR configuration, the compressor and turbine flow range appeared to be too small to accommodate the targeted flow conditions. Figure 10B shows the prototype turbocharger matching for the five engine conditions under a LPEGR-only layout. For high-flow conditions at A100, B75, and C100, the compressor operated near choking limits and created high risk for turbocharger overspeeding. Inefficient compressor operation also pushed the turbine rack position into the low-efficiency region. As a result, the combined turbocharger efficiency deteriorated (Figure 11B) and led to pumping losses in the 7–11% range at above 50% load conditions, as shown in Figure 11B.
Finally, a DLEGR configuration was evaluated. Similar to the 1D engine analysis setup for AHS (Ic), a sweep of HP-Prop% from 0 to 100% was conducted at each operating condition. Figure 10C shows the effects on compressor matching performance. The relatively smaller compressor and turbine wheel trims allowed very little margin to allow any significant LPEGR flow. As a result, less than 20% of LPEGR was used in an effort to fine-tune the compressor matching to the peak efficiency region. At C100, with almost choked compressor operation, the LP loop was nearly fully deactivated (HP-Prop% > 95%). A dual-loop EGR configuration did not show any tangible pumping improvements over the HPEGR, mainly due to low combined turbocharger efficiencies (Figure 11A).
The combined efficiencies and pumping losses were compared across different hardware configurations to identify the best AHS candidates, as shown in Figure 12. The AHS candidates best able to maintain high efficiency while still delivering the necessary boost pressure and EGR over the steady-state engine operating points were selected. All AHSs using LPEGR-only configuration suffered excessive pumping losses from the aggressive BPV throttling necessary to drive the required level of EGR. From Figure 12, the air-handling system configurations AHS IIc and AHS IIIa demonstrated the highest combined turbocharger efficiencies and the lowest pumping losses.
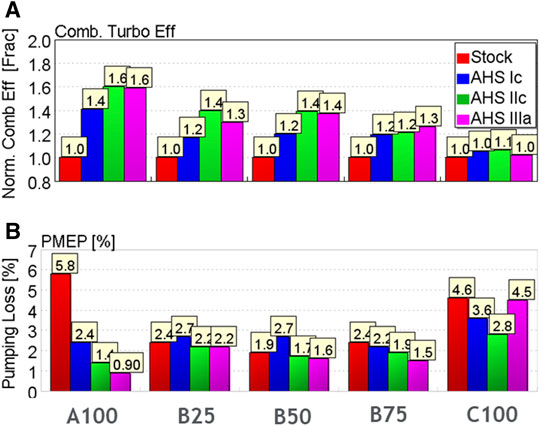
FIGURE 12. Estimated combined turbocharger efficiency and PMEP% for potential air-handling system configurations relative to the stock air system.
A detailed energy distribution analysis was performed and compared against the stock diesel engine operation using a 17.3 CR o evaluate the low-NOx GCI efficiency on an engine system level. Figures 13A,B show the estimated energy loss terms for the stock diesel performance at CR17.3 and the low-NOx GCI operation at CR16.5, respectively. Because it achieved the best performance among all of the AHS hardware configurations, the advanced 1-stage VG turbocharger with HPEGR (AHS IIIa) was selected as the representative system for the energy distribution analysis for low-NOx GCI.
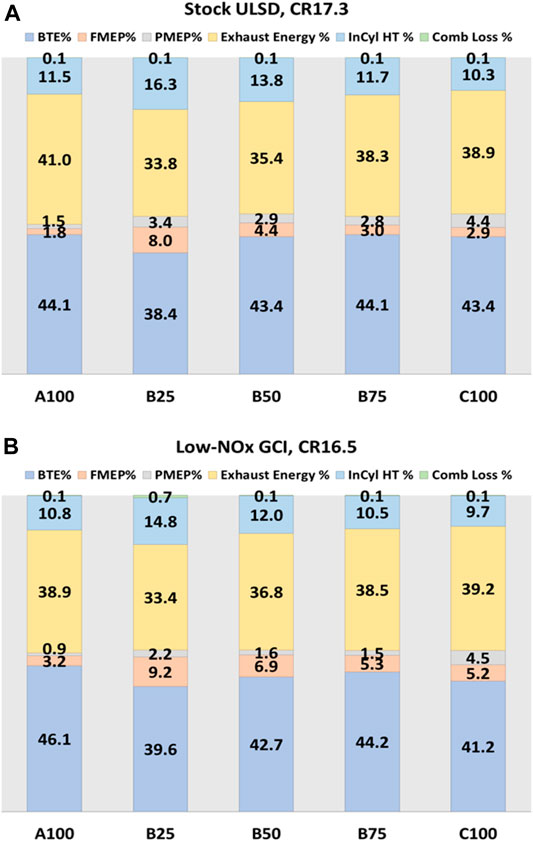
FIGURE 13. Estimated energy distribution for (A) stock ULSD CR17.3 and (B) low-NOx GCI at CR16.5, at the five key engine conditions.
The definition of each loss term in the energy distribution analysis was defined as follows:
In Figure 13B, low-NOx GCI combustion displayed up to 2.8 percentage points improvement in the gross indicated thermal efficiency (ITEg%). The higher ITEg% originated primarily from the reduced in-cylinder heat losses for the customized GCI combustion chamber compared to the stock diesel operation at CR 17.3 (Figure 13A). Due to the high-efficiency turbocharger, the pumping losses for the low-NOx GCI combustion were significantly reduced. For B50 and B75, PMEP% was reduced down to almost half of the diesel counterpart. However, the GCI combustion efficiency dropped by 0.7%, due to the low reactivity of gasoline, at low loads (B25). In addition, the friction losses for GCI combustion increased as a result of higher peak cylinder pressures and parasitic losses associated with the fuel system. Nevertheless, the combined benefits of the reduced in-cylinder heat losses and pumping losses dominated over the friction and combustion losses and delivered a net gain in brake efficiencies for the low-NOx GCI approach, reaching nearly 46.1% BTE at A100. This compares to the best BTE for diesel operation of 44.1%. However, this trend did not carry over to C100, where turbocharger flow limits induced high pumping losses and a peak BTE for low-NOx GCI that is two percentage points lower than the baseline case.
To develop an AHS that is viable for practical applications, it is essential that it delivers acceptable transient performance. The two best performance candidates from the steady-state analysis, AHS IIIa and AHS IIIa, were both evaluated over modeled transient engine operation.
A cosimulation methodology was employed where the 1D engine model was integrated with a Simulink-embedded controls algorithm to model the configurations effectively. The following steps were taken to perform the transient simulations:
• A Simulink harness was added to the 1D model in order to control fueling (# of pulses, quantity, and timings), actuator positions for the EGR valves (both HP and LP for a DLEGR configuration), turbine rack position, and BPV.
• For fast combustion process estimation during transient simulation, a predictive combustion model “DIJet” was developed. The “DIJet” model, calibrated over the 13 mode SET points, agreed with CFD-derived GCI combustion in-cylinder pressure profiles within 5% (shown in Figure 14).
• For transient analysis, a transient temperature solver was incorporated, a critical step for accurate exhaust gas temperature predictions. Without the transient solver, the gas temperatures were found excessively high during transients, thus affecting the turbocharger performance.
• Measured turbocharger mass inertia data was imposed on the 1D model to account for the turbocharger lag during transient operation.
• The 1D solver time step was controlled by the Simulink model.
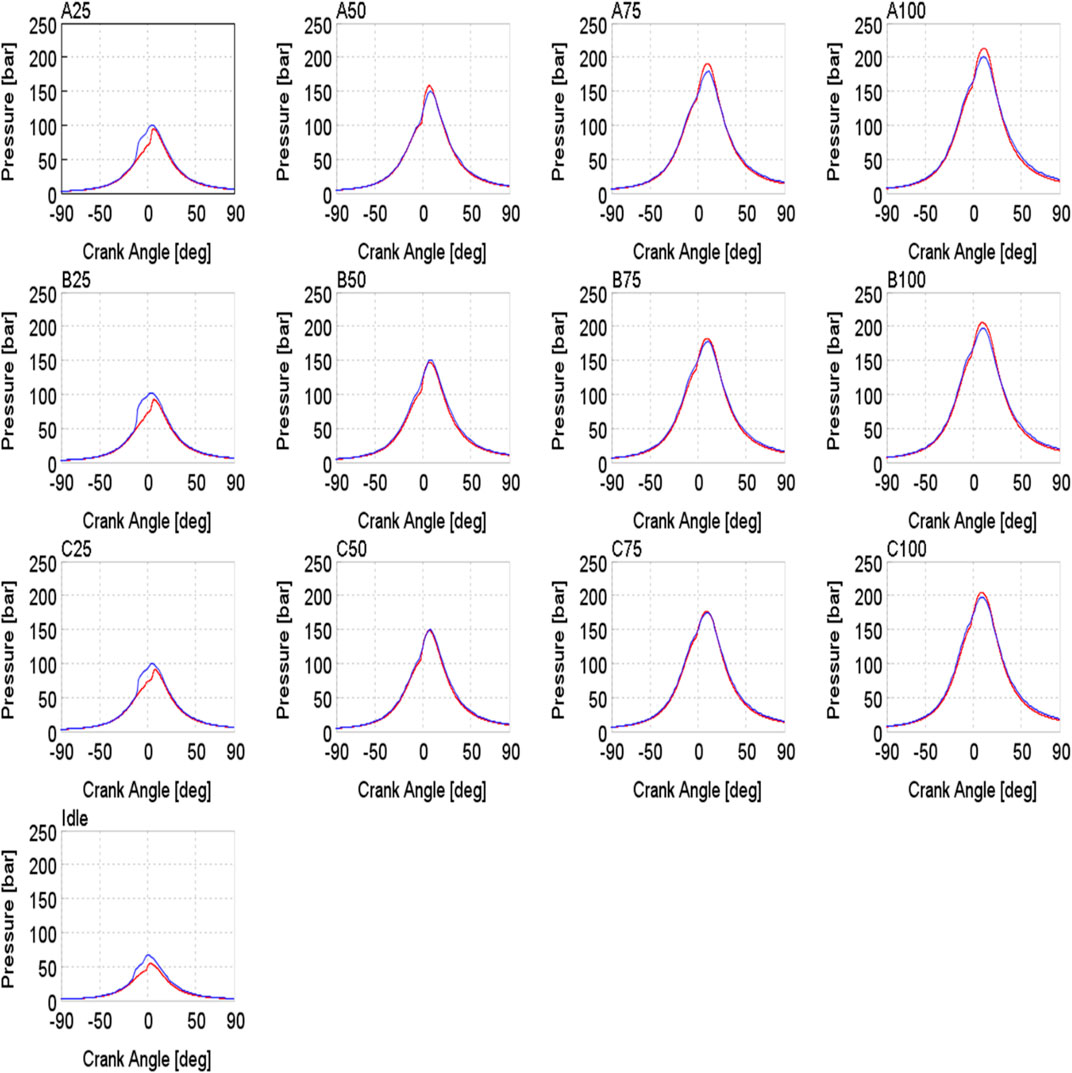
FIGURE 14. Predictive ‘DIJet’ combustion model performance against GCI in-cylinder pressure traces over the 13-mode SET cycle.
As shown in the methodology flowchart (Figure 2), the solver time step and control inputs for the actuators and fuel injection events were imposed on the 1D engine model by the Simulink controls model. The engine RPM and brake torque were provided as feedback signals to the Simulink model. During transient operation, boost control was prioritized and EGR rate was sacrificed by closing the EGR valve when a boost deficiency occurred. It should be noted that the accuracy of the closed-coupled methodology was directly tied to the fidelity of the 1D combustion model. For 1D transient simulations, a high-fidelity “DIJet” combustion model was desired that can predict GCI combustion behavior across a wide range of operating conditions. Near the low load conditions (A25, B25, C25, and idle), where the gasoline’s reactivity shows dominant effect, the “DIJet” model showed a slight discrepancy in capturing gasoline’s ignition delay and demonstrated an early start of combustion (Figure 14). The error of the 1D combustion model was consistent for both the performances of the AHS. Thus, the deductions from the transient simulation results were deemed conclusive.
The transient evaluations of the AHS configurations were performed over the Environmental Protection Agency regulated HD Federal Test Procedure (FTP) transient cycle. Figure 15 shows the predicted engine speed and brake torque traces using the co-simulation setup. Due to the excessive simulation time needed for the entire 1200 s of the FTP, only the first 0–60 s of the transient cycle was considered in the air-handling analysis. The first 60 s included engine idle conditions, heavy engine acceleration, and load change events sufficient to effectively evaluate the AHS performance. The evaluation was primarily focused on EGR delivery and compressor pressure ratio associated with the turbocharger response. Generated from the 3D CFD GCI combustion analysis, the boost pressure and EGR targets for the idle, A60, B50, and C60 load conditions were also marked (in blue) to quantify the differences between the two AHS configurations.
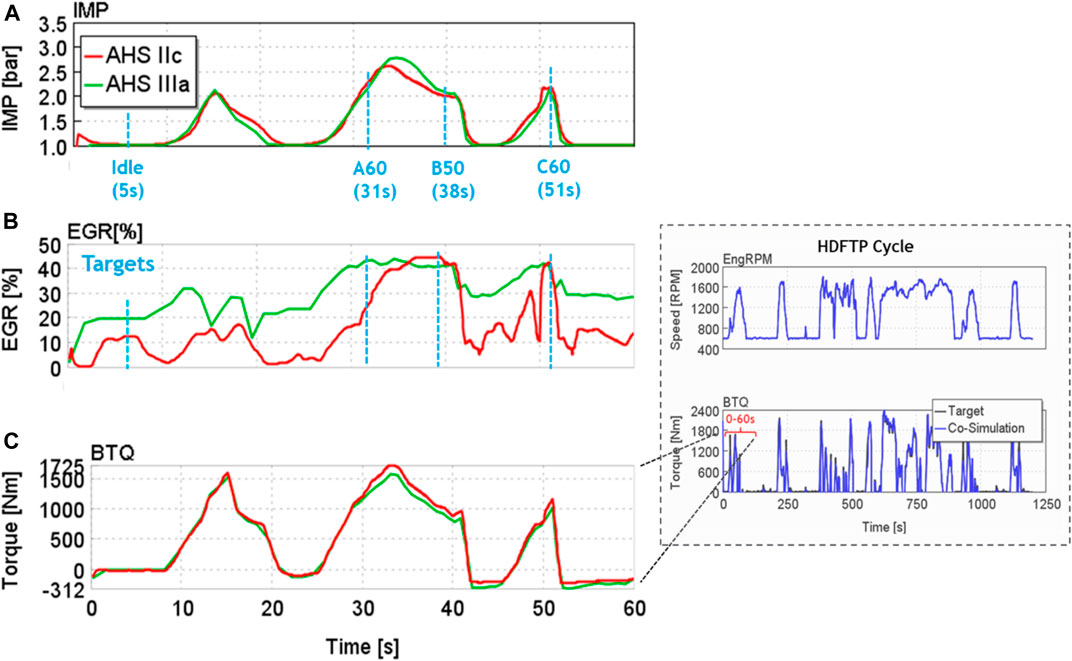
FIGURE 15. Simulated HDFTP cycle using 1D engine model and Simulink controls model-based cosimulation scheme.
The advanced 1-Stage VG Turbocharger using a HPEGR loop (AHS IIIa) provided sufficient boost pressure response due to the fast actuation of the turbine rack. High compressor and turbine efficiencies facilitated both boost and EGR flow requirements when using the HPEGR configuration. The advanced 1-Stage WG Turbocharger, although containing higher mass inertia due to a larger turbine wheel trim, demonstrated similar compressor pressure ratio buildup. Using a higher proportion of LPEGR flow enabled higher exhaust enthalpies at the turbine inlet, producing a more competitive boost response relative to the prototype VG turbocharger. However, the active LP route significantly delayed the EGR delivery during transient operation.
Figure 16 quantifies the response of each AHS configuration against the intake manifold pressure and EGR rate targets at the idle, A60, B50, and C60 engine conditions. The advanced 1-Stage VG turbocharger with HPEGR demonstrated superior performance in delivering more than 90% of the targeted boost pressure and EGR rates during engine transient conditions. Based on the steady-state and transient evaluations, the advanced 1-Stage VG turbocharger with HPEGR configuration being considered the best AHS design option. From a cost, controls complexity, and packaging viewpoint, the AHS IIIa configuration was also preferred over a WG AHS.
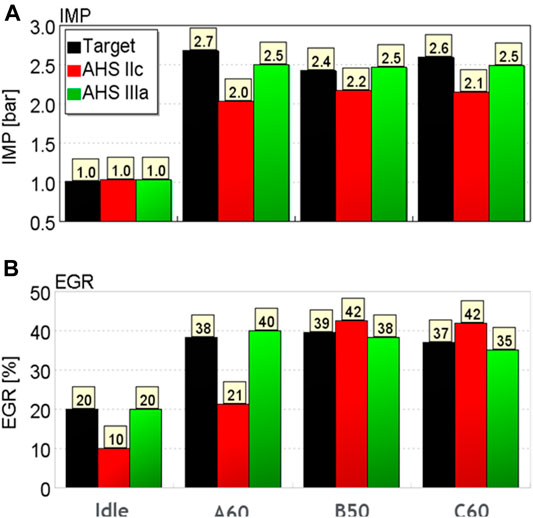
FIGURE 16. Comparison of AHS IIc and IIIa performances against boost pressure and EGR rate targets.
A detailed study was conducted to identify a practical and high-efficiency AHS that delivers high levels of boost pressure and EGR rates that enable efficient and clean low-NOx GCI combustion.
Key conclusions from the study were as follows:
1) Due to the excessively large compressor and turbine wheel trims, the stock 1-Stage VG turbocharger suffered excessive pumping losses and had to be combined with a DLEGR configuration to mitigate them.
2) With its high compressor and turbine efficiencies, the advanced 1-Stage WG Turbocharger demonstrated lower pumping losses than the stock configuration when combined with a DLEGR configuration.
3) The prototype 1-Stage VG turbocharger showed the lowest pumping losses of any of the configurations when combined with the relatively simple HPEGR system. The predicted peak BTE was over 46% at A100.
4) The prototype 1-Stage VG turbocharger, when combined with HPEGR system, performed satisfactorily in delivering boost pressure and EGR across the operating map. The high combined efficiency of the small compressor and turbine wheel trims also delivered reduced turbocharger lag compared to a WG AHS. The ability to use a HPEGR system eliminated delays inherent to the LP systems needed to boost efficiencies in alternative configurations.
5) Both SS and transient analysis results showed the prototype 1-Stage VG turbocharge with a HPEGR configuration as the most suitable and practical AHS configuration for a prototype low-NOx GCI engine.
The original contributions presented in the study are included in the article/Supplementary Material; further inquiries can be directed to the corresponding author.
PK, YZ, and MT contributed to conception and design of the study. YZ contributed to the 3D CFD methodology and the presented close-coupling methodology. PK performed the 1D system analysis and authored the first draft of the manuscript. JW contributed to turbocharger performance maps and inertia data. All authors contributed to manuscript revision and read and approved the submitted version.
This work was funded by Aramco Americas, under the program budget for low-NOx HDGCI.
The authors declare that the research was conducted in the absence of any commercial or financial relationships that could be construed as a potential conflict of interest.
The authors would like to thank Andrew Baur, Vehicle Integration Team, Aramco Americas, for his support in developing the Simulink controls model-based simulations.
ATDC, after top dead center; BR, burn rate; Eff CR, effective compression ratio; EGR, exhaust gas recirculation; HPEGR, high-pressure EGR; ITE, indicated thermal efficiency; VGT, variable geometry turbocharger; ISC, interstage cooler; GCI, gasoline compression ignition; PRF, primary reference fuel; ROI, rate of injection; RON, research octane number; Q1 [-], pilot injection quantity fraction.
California Air Resources Board (CARB) (2020). Heavy-duty low-NOx program. Available at: https://www.arb.ca.gov/msprog/hdlownox/hdlownox.htm (Accessed April 12, 2020).
Chadwell, C., Alger, T., Roberts, C., and Arnold, S. (2011). Boosting simulation of high efficiency alternative combustion mode engines. SAE Int. J. Engines. 4 (1), 375–393. doi:10.4271/2011-01-0358
Chang, J., Kalghatgi, G., Amer, A., Adomeit, P., Rohs, H., and Heuser, B. (2013). Vehicle demonstration of naphtha fuel achieving both high efficiency and drivability with EURO6 engine-out NOx emission. SAE Int. J. Engines. 6 (1), 101–119. doi:10.4271/2013-01-0267
Convergent Science Inc. (CSI) (2018). CONVERGE theory manual v2.3. Madison, MI: CONVERGE CFD software, Convergent Science Inc. (CSI).
Golovitchev, V. I., Nordin, N., Jarnicki, R., and Chomiak, J. (2000). 3-D diesel spray simulations using a new detailed chemistry turbulent combustion model. SAE Tech. 109, 1391–1405. doi:10.4271/2000-01-1891
Joo, S. M., Alger, T., Chadwell, C., De Ojeda, W., Zuehl, J., and Gukelberger, R. (2012). A high efficiency, dilute gasoline engine for the heavy-duty market. SAE Int. J. Engines. 5 (4), 1768–1789. doi:10.4271/2012-01-1979
Kalghatgi, G., Hildingsson, L., and Johansson, B. (2010). Low NOx and low smoke operation of a diesel engine using gasolinelike fuels. J. Eng. Gas Turbines Power. 132 (9), 2010. doi:10.1115/1.4000602
Kalghatgi, G. T., Risberg, P., and Ångström, H.-E. (2007). Partially pre-mixed auto-ignition of gasoline to attain low smoke and low NOx at high load in a compression ignition engine and Comparison with a diesel fuel. SAE International, Technical Paper 2007-01-0006. doi:10.4271/2007-01-0006
Kumar, P., Pei, Y., Traver, M., and Watson, J. (2019). System level 1-D analysis of an air-system for a heavy-duty gasoline compression ignition engine. SAE International, Technical Paper 2019-01-0240. doi:10.4271/2019-01-0240
Kumar, P., Zhang, Y., Traver, M., and Cleary, D. (2017). Simulation-guided air system design for a low reactivity gasoline-like fuel under partially-premixed combustion in a heavy-duty diesel engine. SAE International, Technical Paper 2017-01-0751. doi:10.4271/2017-01-0751
Liu, Y.-D., Jia, M., Xie, M.-Z., and Pang, B. (2012). Enhancement on a skeletal kinetic model for primary reference fuel oxidation by using a semidecoupling methodology. Energy Fuels. 26, 7069–7083. doi:10.1021/ef301242b
Manente, V., Johansson, B., Tunestal, P., and Cannella, W. (2010a). Effects of different type of gasoline fuels on heavy duty partially premixed combustion. SAE Int. J. Engines. 2 (2), 71–88. doi:10.4271/2009-01-2668
Manente, V., Zander, C.-G., Johansson, B., Tunestal, P., and Cannella, W. (2010b). An advanced internal combustion engine concept for low emissions and high efficiency from idle to max load using gasoline partially premixed combustion. SAE International, Technical Paper 2010-01-2198. doi:10.4271/2010-01-2198
Meng, T., Pei, Y., Zhang, Y., Tzanetakis, T., Traver, M., Cleary, D., et al. (2018). Development of a transient spray cone angle correlation for CFD simulations at diesel engine conditions. SAE International, Technical Paper 2018-01-0304. doi:10.4271/2018-01-0304
Ra, Y., Loeper, P., Reitz, R. D., Andrie, M., Krieger, R., Foster, D. E., et al. (2011). Study of high speed gasoline direct injection compression ignition (GDICI) engine operation in the LTC regime. SAE Int. J. Engines. 4 (1), 1412–1430. doi:10.4271/2011-01-1182
Robertson, W. (2017). “California air Resources board heavy-duty truck and engine plans,” in SAE 2017 commercial vehicle congress. (Warrendale, PA: SAE InternationaL), 18–20.
Sellnau, M., Moore, W., Sinnamon, J., Hoyer, K., Foster, M., and Husted, H. (2015). GDCI multi-cylinder engine for high fuel efficiency and low emissions. SAE Int. J. Engines. 8 (2), 775–790. doi:10.4271/2015-01-0834
Tuner, M., Johansson, B., Keller, P., and Becker, M. (2013). Loss analysis of a HD-PPC engine with two-stage turbocharging operating in the European stationary cycle. SAE International, Technical Paper 2013-01-2700. doi:10.4271/2013-01-2700
Zhang, Y., Kumar, P., Pei, Y., Traver, M., et al. (2018). An experimental and computational investigation of gasoline compression ignition using conventional and higher reactivity gasolines in a multi-cylinder heavy-duty diesel engine. SAE International, Technical Paper 2018-01-0226. doi:10.4271/2018-01-0226
Zhang, Y., Kumar, P., Traver, M., and Cleary, D. (2016). Conventional and low temperature combustion using naphtha fuels in a multi-cylinder heavy-duty diesel engine. SAE Int. J. Engines. 9 (2), 1021. doi:10.4271/2016-01-0764
Keywords: GCI, 1D analysis, 3D analysis, turbocharger, heavy-duty, transient
Citation: Kumar P, Zhang Y, Traver M and Watson J (2021) Tailored Air-Handling System Development for Gasoline Compression Ignition in a Heavy-Duty Diesel Engine. Front. Mech. Eng 7:611916. doi: 10.3389/fmech.2021.611916
Received: 29 September 2020; Accepted: 15 January 2021;
Published: 11 March 2021.
Edited by:
Anand Nageswaran Bharath, Cummins, United StatesReviewed by:
Maciej Mikulski, University of Vaasa, FinlandCopyright © 2021 Kumar, Zhang, Traver and Watson. This is an open-access article distributed under the terms of the Creative Commons Attribution License (CC BY). The use, distribution or reproduction in other forums is permitted, provided the original author(s) and the copyright owner(s) are credited and that the original publication in this journal is cited, in accordance with accepted academic practice. No use, distribution or reproduction is permitted which does not comply with these terms.
*Correspondence: Praveen Kumar, cHJhdmVlbi5rdW1hckBhcmFtY29hbWVyaWNhcy5jb20=
Disclaimer: All claims expressed in this article are solely those of the authors and do not necessarily represent those of their affiliated organizations, or those of the publisher, the editors and the reviewers. Any product that may be evaluated in this article or claim that may be made by its manufacturer is not guaranteed or endorsed by the publisher.
Research integrity at Frontiers
Learn more about the work of our research integrity team to safeguard the quality of each article we publish.