- 1National Research Institute of Fire and Disaster, Tokyo, Japan
- 2National Institute of Standards and Technology (NIST), Gaithersburg, MD, United States
Wind plays an important role in the built environment. Large outdoor fires in the built environment are no exception. Under strong wind, firebrands fly far, which leads to quick fire spread. In this study, the effect of structure to structure separation distance on firebrand accumulation was investigated by using a custom designed firebrand generator installed in a real scale wind tunnel. Firebrands accumulated at 4 and 6 m s−1, but no firebrand accumulation zone was observed at 8 and 10 m s−1, regardless of separation distance (SD). Experimental results were compared with a simple CFD flow simulation (no firebrands included). The size of firebrand accumulation zone as well as distance from the structure front was compared with SD in the cases of 4 and 6 m s−1 wind speeds. It was found that firebrands behave differently from SD = 1 to 2 m, to that of SD = 2 to 3 m. The results of this study are the first to explore these important interactions between firebrands and structure separation distances. The results of this work will help develop and design sustainable communities that may better resist the destruction of increasing large outdoor fire outbreaks worldwide, as well as help develop the next generation of CFD models needed to grasp the important large outdoor fire problem and associated firebrand processes.
Introduction
Wind plays an important role in the built environment, from ventilation within buildings, wind force on buildings, effects on rain, to pollution dispersion (Shah and Ferziger, 1997; Blocken and Carmeliet, 2004; Quyang et al., 2006; Chaves et al., 2011; Yuan and Ng, 2012; Razak et al., 2013). The importance of wind applies to fire safety, where an increasing number of large outdoor fires, such as urban fires, informal settlement fires, wildland-urban interface (WUI) fires and wildland fires, are a major concern (Manzello et al., 2018).
Outdoor fires spread via three paths; direct flame contact, radiative heat, and firebrands. Wind largely influences outdoor fire spread behavior. Especially in the presence of strong wind, fires spread quickly, endangering people in vast areas. Stronger wind enhances flame spread processes; heat transfer processes are augmented (Albini 1985; Weber 1989; Pitts, 1991; Weber 1991; Potter, 1996; Morandini et al., 2001; Hu et al., 2009; Morandini and Silvani, 2010; Sharples et al., 2012).
Firebrand processes are also affected by winds (Tarifa et al., 1965; Lee and Hellman 1969; Albini 1983; Ellis 2000; Albini et al., 2012; Koo et al., 2012; Suzuki et al., 2013; Tohidi et al., 2015; Suzuki and Manzello, 2017a; Tohidi and Kaye, 2017a; Tohidi and Kaye, 2017b; Fernandez-Pello, 2017; Song et al., 2017; Suzuki and Manzello, 2019; Suzuki and Manzello 2020a; Manzello et al., 2020; Manzello and Suzuki, 2020; Suzuki and Manzello 2021). Wind influences all aspects of firebrand behavior; firebrand generation from fuels (Suzuki et al., 2013; Tohidi et al., 2015; Suzuki and Manzello, 2019; Manzello and Suzuki, 2020; Suzuki and Manzello 2020; Suzuki and Manzello 2021), transport distance (Tarifa et al., 1965; Lee and Hellman 1969; Albini 1983; Ellis 2000; Albini et al., 2012; Koo et al., 2012; Tohidi and Kaye, 2017a; Tohidi and Kaye, 2017b; Song et al., 2017), firebrand deposition patterns (Suzuki and Manzello, 2017a), and ignition behavior induced by firebrands (Ganteaume 2009; Manzello et al., 2012; Manzello and Suzuki 2012; Manzello, 2014; Suzuki et al., 2015; Suzuki and Manzello, 2017b; Manzello et al., 2017; Wang et al., 2017; Suzuki and Manzello, 2020b). Out of four firebrand behaviors, the firebrand deposition is the least studied to the authors’ knowledge. While many research studies that model the wildland fire behavior have been undertaken (Rothermel, 1972; Koo et al., 2005; Alexander and Cruz, 2006; Cheney and Sullivan, 2008; Sullivan, 2009; Martin and Hillen, 2016; Trucchia et al., 2019), including firebrands in these models is a great challenge. Modeling firebrands is complex in nature, such as change in mass, size, and combustion state during transport. More experimental studies are needed to understand the flow dynamics of firebrands near and around structures. In a past, first attempt (Suzuki and Manzello, 2017a), firebrand accumulation behavior in front of a simple wall under different wind speeds was investigated and compared with simple wind flow modeling.
One of important measures in areas prone to large outdoor fires are home ignition zones (HIZ) (Cohen, 2000; Syphard et al., 2012; Biswas et al., 2013). It is important to remove all the combustibles including sheds or mulches, in case of any combustibles being ignited by firebrands, which will lead to ignition of homes. Unfortunately, it is difficult to implement in practice (Mell and Maranghides, 2009). More understanding on firebrand behavior around structures is needed. To this end, experiments were performed to investigate the firebrand behavior around structures, with a special emphasis on the separation distance between structures.
Experiments
Experimental Description
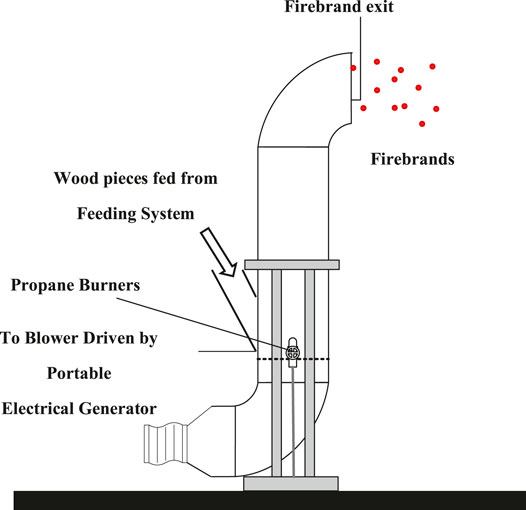
The continuous-feed firebrand generator (NIST Dragon) was used for all the experiments. The details of this apparatus are described in (Manzello and Suzuki, 2014), so a brief overview is provided here. The continuous-feed NIST Dragon was made of a continuous-feed part connected to the firebrand generator (Figure 1). The continuous-feed part has the storage of wood pieces (for firebrands) connected with a pipe to the NIST Dragon, with two gates to mitigate fire spread from the apparatus to the feeding system. The firebrand generator has a blower that was set to 3 m s−1 at the exit of firebrand generator in order to loft the generated firebrands. This blower velocity is selected to be able to produce smoldering firebrands. The feeding rate was 800 g/min, or approximately 16,000/min of wood pieces (1 piece of wood piece weighs approximately 0.5 g before the combustion). With this feeding rate, the firebrand flux at the exit of the NIST Dragon is 17 g/m2 s (mass flux) or approximately 342/m2 s (number flux). Experiments were performed in the Fire Research Wind Tunnel Facility (FRWTF) in Building Research Institute (BRI), Tsukuba, Japan as the wind is an important parameter in large outdoor fires. FRWTF has a 4 m fan and provides a wind profile up to 10 m s−1 (±10%) in a measurement section of 5 m width × 15 m length × 20 m height with both sides being wall.
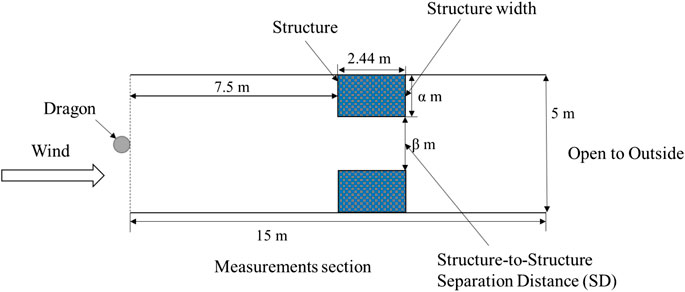
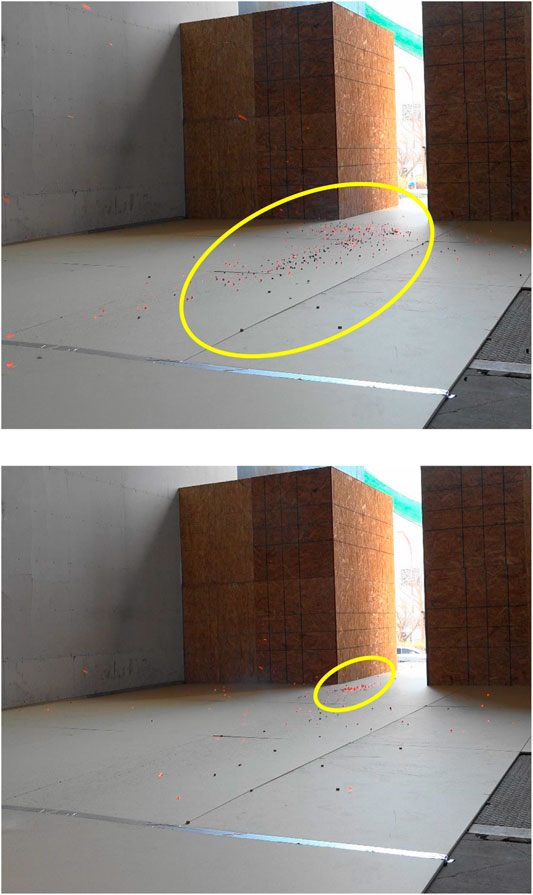
Structures were symmetrically placed at 7.5 m downwind (to the leading edge of structures) from the NIST Dragon (Suzuki and Manzello, 2017a). This distance was far enough to investigate the firebrand behavior around a wall (Suzuki and Manzello, 2017a). The dimensions of the structures were 1, 1.5 or 2 m wide (shown as α in Figure 2) × 2.44 m long × 2.44 m high depending on the selected separation distance (SD) = either 3, 2, and 1 m (shown as β in Figure 2). The SD considered in this study were 1, 2, and 3 m as the SD of approximately 2 m is allowed in USA (Maranghides and Johnsson, 2008). Schematics of experimental settings are provided in Figure 2A feeding time of 10 min was selected for most cases as it was reported that (Suzuki and Manzello, 2017a) the firebrand deposition reached a peak and remain the same after a certain time. For 10 m s−1 wind speed cases with SD = 1 and 2 m, 5 min feeding time was selected for safety, since it was possible to produce outside fires due to the large effluent of firebrands outside the wind facility. Figure 3 shows the images of firebrand deposition process in the experiments under 4 m s−1 and SD = 1 m. The firebrand accumulation zone was not completely symmetric.
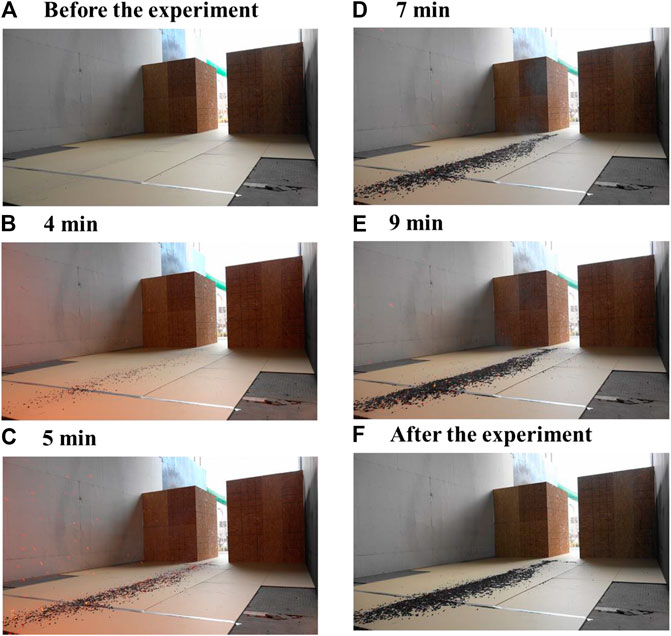
FIGURE 3. Firebrand Accumulation Pattern via Time under SD = 1 m and 4 m s−1 wind (A) before the experiment, (B) 4 min, (C) 5 min, (D) 7 min, (E) 9 min and (F) after the experiment.
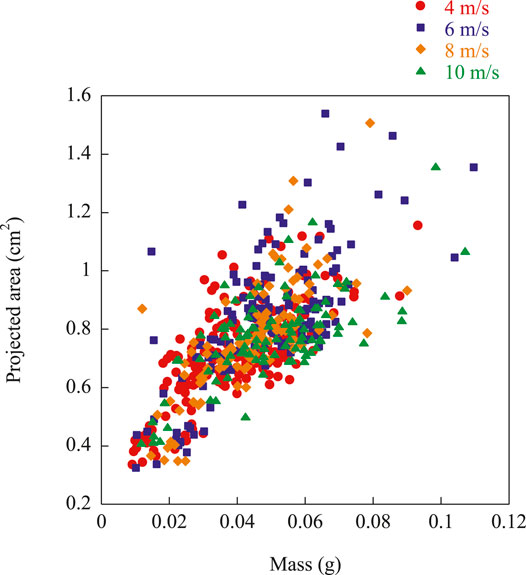
Separate experiments were performed to verify the characteristics of firebrands produced under different wind speeds, specifically, 4, 6, 8 and 10 m s−1. Firebrands were produced under a desired wind and collected in water pans. After the collection, firebrands were dried at 104 °C in the oven. The mass of each firebrand was measured with a scale, and a picture of each firebrand was taken. The image analysis was performed to measure the projected area. Characteristics of firebrands produced under different wind speeds is shown in Figure 4.
Experimental Results and Discussion
Experiments showed a clear firebrand accumulation zone in front of the separation zone (upwind side) at lower wind speeds, 4 and 6 m s−1 while no accumulation zones were observed at higher wind speeds, 8 and 10 m s−1 (Figure 5). In Figure 5, no images are provided for experiments with 8 or 10 m s−1, due to the absence of accumulation zones. Figure 5 shows that the firebrand accumulation zone was not completely symmetric. In the case of SD = 3 m under 4 m s−1, the firebrand accumulation was observed between structures, also on the downwind side (Figure 5E). Under 6 m s−1 wind with SD = 1 m, firebrands accumulated into two zones (Figure 5D). Under 8 m s−1 wind with SD = 1 m, a small number of firebrands showed a tendency to accumulate, rolling on the floor together, however those accumulations were not sustained at the end. This behavior is shown in Figure 6.
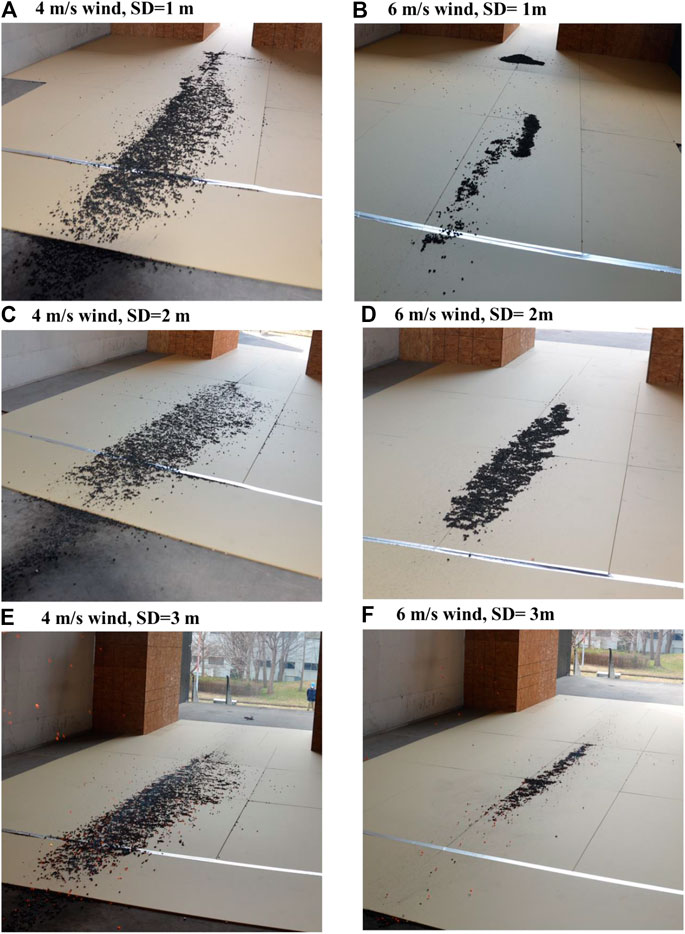
FIGURE 5. Firebrand Accumulation pattern under different wind speeds and SD (A) 4 m s−1 and SD = 1 m (B) 6 m s−1 and SD = 1 m, (C) 4 m s−1 and SD = 2 m, (D) 6 m s−1 and SD = 2 m, (E) 4 m s−1 and SD = 3 m and (F) 6 m s−1 and SD = 3 m. Images under 8 and 10 m s−1 are not provided as accumulation was not observed.
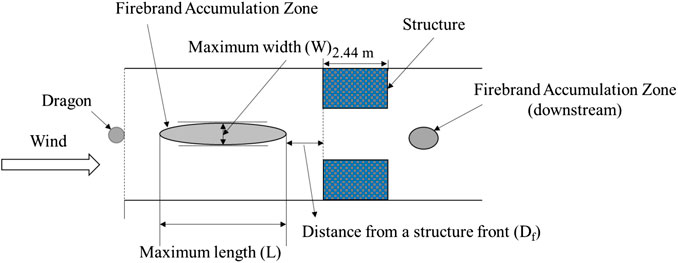
The distance from the front of the structure (Df), the maximum length (L), width (W) of firebrand accumulated area, and the total area of firebrand accumulation were measured after each experiment (Figure 7). The accumulation distance in front of a structure is plotted against SD in Figure 8A, as well as the maximum length and width of firebrand accumulation zone in Figures 8B and 8C, respectively. Figure 8A showed that the Df had a peak at SD = 2 m for experiments at 4 m s−1, while the effect of SD is less clear in experiments at 6 m s−1, due to two firebrand accumulation zones observed at SD = 1 m. In Figure 8B, the length of firebrand accumulation zone was longer at 4 than 6 m s−1.
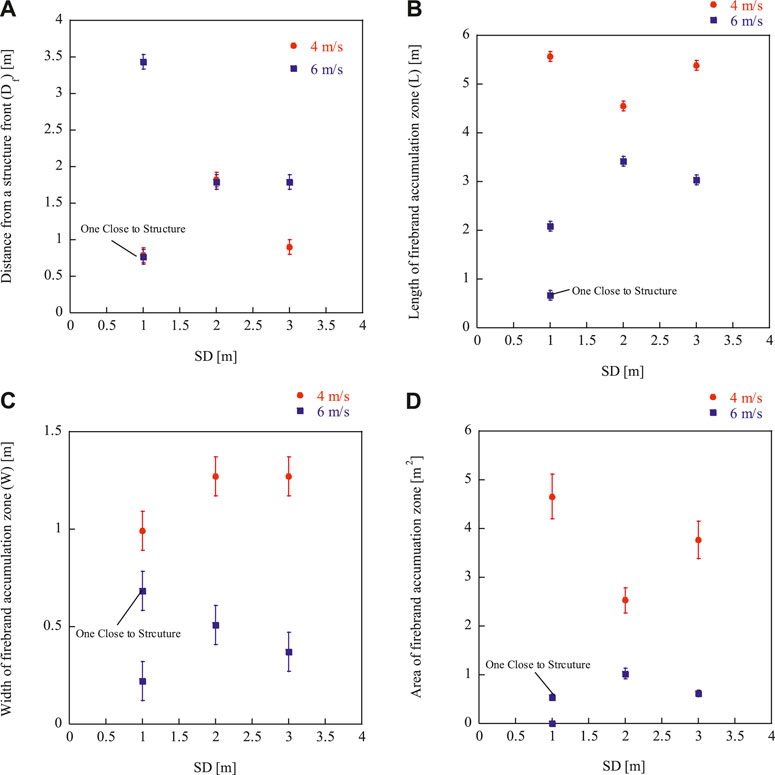
FIGURE 8. Measurements of firebrand accumulation zone under 4 and 6 m s−1 wind experiments (A) Distance from a structure front Df and SD (B) Length of firebrand accumulation zone (L) and SD (C) Width of firebrand accumulation zone (W) and SD (D) Area of firebrand accumulation zone and SD.
The length of the accumulation zone varies depending on SD, and that behavior for experiments at 4 m s−1 was the opposite to those at 6 m s−1 wind speed. The similarity between the two was a peak at 2 m SD, which was the same as the case for Df under 4 m s−1 wind shown in Figure 8A.
Figure 8C shows that the width of firebrand accumulation zone was wider at 4 than 6 m s−1, which is the same for length shown in Figure 8B. The total area of the accumulation zone was plotted in Figure 8D. It was observed that the higher wind speed led to a smaller accumulation zone. This is similar behavior to very simple wall experiments (Suzuki and Manzello, 2017a). Under 4 m s−1 wind speed, the size of the firebrand accumulation zone was similar, regardless of SD, yet it changed significantly under a 6 m s−1 wind. This, in some sense, is similar to the accumulation distance, as it indicated that wind profile changes more significantly between SD 1 and 2 m than between 2 and 3 m. This effect needs to be more carefully investigated as the minimum SD between buildings is 2 m. The firebrand accumulation behind the separation (downstream) under SD = 3 m and 4 m s−1 wind was located (Figure 7) between 1.4 and 2.1 m (L = 0.7 m) with the width 0.25 m and the area of 0.0829 m2.
Simulations
The Fire Dynamic Simulator (FDS) was used to simulate the wind field of these experiments (McGrattan et al., 2013). FDS does not contain firebrands; however, it was used to describe the firebrand accumulation behavior based on predicted wind profiles (Suzuki and Manzello, 2017a). Firebrands follow the wind as they are relatively light but not completely due to their mass. FRWTF was simulated with experimental structures and the NIST Dragon as an obstacle with the dimension of 5 m (W) × 16 m (L) × 20 m (H). The mesh size was 10 cm × 10 cm × 10 cm. The conditions of simulation are summarized in Table 1. After 10 s, modeling shows that the wind has stabilized. The simulation was performed up to 20 s for all cases in order to observe the repeated wind behavior.
In a simple calculation performed in (Suzuki and Manzello, 2017a), the wind speed of 2.3 m s−1 was the lowest wind speed for firebrands to move on the floor where the surface was relatively smooth considering the balance between friction force between a firebrand and the floor (gypsum board) and the wind force:
And
Therefore, μ is the friction coefficient between a gypsum board and smoldering firebrands, mfirebrand is the average mass of a firebrand, ρair is the density of the air, g is gravitation acceleration, v is wind speed on a firebrand and A is the average projected area of a firebrand. As seen in Figure 4, the mass and the size of firebrands under 4, 6, 8 and 10 m s−1 can be considered within the range of uncertainties (±10%), average of mass (0.05 g) and projected area (0.78 cm2) was used for calculation. The unknown parameter was μ, as there is no data available for a smoldering firebrand and a gypsum board. Therefore μ = 0.5 was used based on data for wood on wood (Japanese Society of Mechanical Engineers, 2004). Applying 2.3 m s−1 for the lowest wind speed for firebrands to move, we consider the stagnation zone (wind speed less than 2.3 m s−1) as the firebrand accumulation zone.
An FDS simulation was performed using the conditions shown in Table 1. The FWTRF was simulated. Figures 9 and 10 show the FDS simulation results under 4 and 8 m s−1 in the cases of SD = 1 m and 3 m. Figures 9 and 10 shows the wind speed 2.3 m s−1 being marked in black. As shown in Figure 9, as the wind speed increases, the distance to the stagnation zone from the front of structures, Df, decreases, and as SD become larger, wind between structures become less turbulent. Figure 11 shows the distance to the stagnation zone from the front of structures, Df, vs. time (10–20 s) in the case of 1 m SD for example. Overall, the Df increases as the wind speed increases. Data from 4 m s−1 is relatively stable, while those from 10 m s−1 is changing a lot. Those from 6 m s−1 are fluctuating. It is assumed the two firebrand accumulation zones observed in experiments are due to this behavior. Figure 12 shows the 10 s average, Df, against wind speeds along with experimental results. Results from FDS shows that Df increases as the wind speed increases. Df also increases as SD increases with the exception of SD = 1 and 2 m under 6 m s−1 wind. This is interesting as experiments showed the wind profile around the structures may change between SD from 1 to 2 m, and SD from 2 to 3 m. Experimental data with SD = 1 m has similar Df to FDS results while experimental results does not match well when SD = 2 or 3 m. For the same SD, as the wind speed increases the wind flow around structures becomes complicated, and it is expected firebrands may not follow the wind completely; the calculation deduced from simple analysis no longer works.
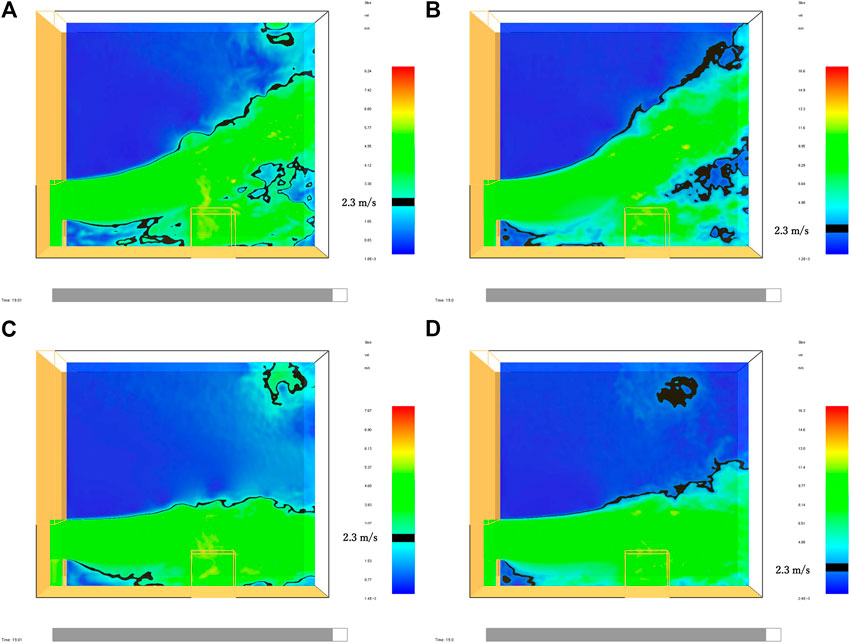
FIGURE 9. FDS simulation results with different SD and wind speeds. Wind profile at centerline. Black line in the images shows wind speed of around 2.3 m s−1(A) 4 m s−1 wind, SD = 1 m, (B) 8 m s−1 wind speed, SD = 1 m, (C) 4 m s−1 wind speed, SD = 3 m and (D) 8 m s−1 wind speed, SD = 3 m.
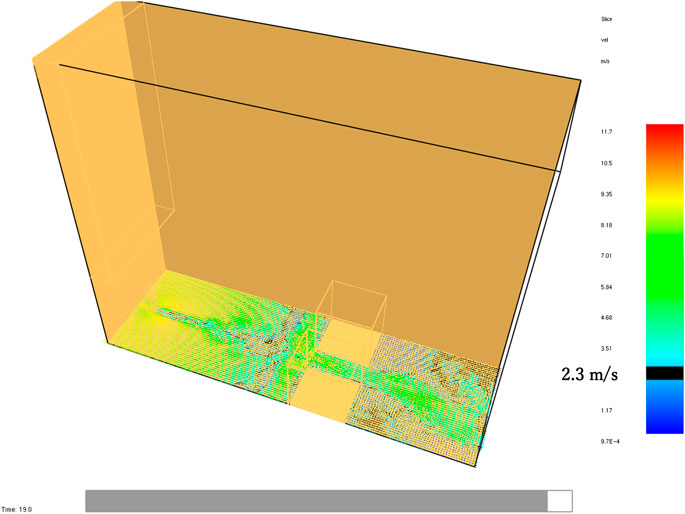
FIGURE 10. FDS simulation results with 8 m s−1 wind speed and SD = 1 m. Wind profile at ground level.
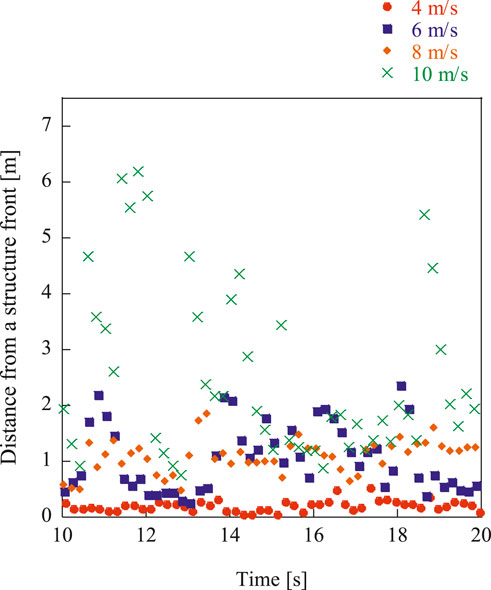
FIGURE 11. Time varying distance from a stagnation zone (wind speed 2.3 m s−1) from a structure front in FDS simulation under 1 m s−1 wind.
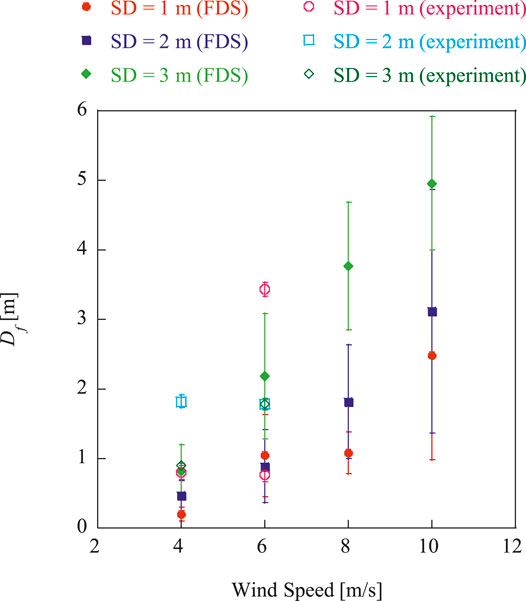
FIGURE 12. Comparison between average distance from a stagnation zone (wind speed 2.3 m s-1) from a structure front in FDS simulation and those in experiments.
Summary
Wind has an impact on the built environment. For large outdoor fire safety, wind plays a critical role, from enhancing flame spread processes to firebrand spotting. Firebrands fly far under high wind, which presents risks to many houses. This study focused on understanding firebrand behavior between two structures by varying the separation distances and wind speeds experimentally and by simulation. No significant accumulation was observed under 8 and 10 m s−1, regardless of structure separation distance. The size of firebrand accumulation as well as distance from structure front was compared with separation distance in the cases of 4 and 6 m s−1 wind speeds. It was found that firebrands behave differently from SD = 1–2 m, to that of SD = 2–3 m. The results of this study are the first to explore these important interactions between firebrands and structure separation distances.
Data Availability Statement
The raw data supporting the conclusions of this article will be made available by the authors, upon request.
Author Contributions
SS: Conceptualization, Investigation, Formal analysis, Writing - original draft. SM: Conceptualization, Investigation, Formal analysis, Writing - original draft.
Conflict of Interest
The authors declare that the research was conducted in the absence of any commercial or financial relationships that could be construed as a potential conflict of interest.
References
Albini, F. A. (1983). Transport of firebrands by line thermals. Combust. Sci. Technol. 32 (5–6), 277–288.
Albini, F. A. (1985). A model for fire spread in wildland fuels by-radiation†. Combust. Sci. Technol. 42, 229–258. doi:10.1080/00102208508960381
Albini, F. A., Alexander, M. E., and Cruz, M. G. (2012). A mathematical model for predicting the maximum potential spotting distance from a crown fire. Int. J. Wildland Fire 21, 609–627. doi:10.1071/wf11020
Alexander, M. E., and Cruz, M. G. (2006). Evaluating a model for predicting active crown fire rate of spread using wildfire observations. Can. J. For. Res. 36, 3015–3028. doi:10.1139/x06-174
Biswas, K., Werth, D., and Gupta, N. (2013). A home ignition assessment model applied to structures in the wildland-urban interface. Available at: https://web.ornl.gov/sci/buildings/conf-archive/2013%20B12%20papers/085_Biswas.pdf.
Blocken, B., and Carmeliet, J. (2004). A review of wind-driven rain research in building science. J. Wind Eng. Ind. Aerod. 92 (13), 1079–1130. doi:10.1016/j.jweia.2004.06.003
Chaves, M., Hajra, B., Stathopoulos, T., and Bahloul, A. (2011). Near-field pollutant dispersion in the built environment by CFD and wind tunnel simulations. J. Wind Eng. Ind. Aerod. 99 (4), 330–339. doi:10.1016/j.jweia.2011.01.003
Cheney, P., and Sullivan, A. (2008). Grassfires: fuel, weather and fire behaviour. 6th Edn. Melbourne, Australia: CSIRO Publishing.
Cohen, J. D. (2000). Preventing disaster: home ignitability in the wildland-urban Interface J. For. 98, 15–21.
Ellis, P. F. (2000). The aerodynamic and combustion characteristics of eucalypt bark – a firebrand study. Canberra, Australia: Australian National University.
Fernandez-Pello, A. C. (2017). Wildland fire spot ignition by sparks and firebrands. Fire Saf. J. 91, 2–10. doi:10.1016/j.firesaf.2017.04.040
Ganteaume, A., Hernando, C., Jappiot, M., and Fonturbel, T. (2009). Spot fires: fuel bed flammability and capability of firebrands to ignite fuel beds. Int. J. Wildland Fire 18 (8), 951–969. doi:10.1071/wf07111
Guijarro, L. H., Huo, R., and Yang, D. (2009). Large eddy simulation of fire-induced buoyancy driven plume dispersion in an urban street canyon under perpendicular wind flow. J. Hazard Mater. 166 (1), 394–406. doi:10.1016/j.jhazmat.2008.11.105
Japanese Society of Mechanical Engineers (2004). JSME mechanical Engineers’ handbook Alpha 2. Maruzen (in Japanese).
Koo, E., Linn, R. R., Pagni, P. J., and Edminster, C. B. (2012). Modelling firebrand transport in wildfires using HIGRAD/FIRETEC. Int. J. Wildland Fire 21, 396–417. doi:10.1071/wf09146
Koo, E., Pagni, P., Stephens, S., Huff, J., Woycheese, J., and Weise, D. (2005). A simple physical model for forest fire spread rate. Fire Saf. Sci. 8, 851–862. doi:10.3801/iafss.fss.8-851
Lee, S.-L., and Hellman, J. M. (1969). Study of firebrand trajectories in a turbulent swirling natural convection plume. Combust. Flame 13 (6), 645–655. doi:10.1016/0010-2180(69)90072-8
Manzello, S. L. (2014). Enabling the investigation of structure vulnerabilities to wind- driven firebrand showers in wildland-urban interface (WUI) fires. Fire Saf. Sci. 11, 83–96. doi:10.3801/iafss.fss.11-83
Manzello, S. L., Suzuki, S., and Nii, D., Full-scale experimental investigation to quantify building component ignition vulnerability from mulch beds attacked by firebrand showers. Fire Technol. 53, 535–551. doi:10.1007/s10694-015-0537-3
Manzello, S. L., Blanchi, R., Gollner, M. J., Gorham, D., McAllister, S., Pastor, E., et al. (2018). Summary of workshop large outdoor fires and the built environment. Fire Saf. J. 100, 76–92. doi:10.1016/j.firesaf.2018.07.002
Manzello, S. L., Suzuki, S., Gollner, M. J., and Fernandez-Pello, A. C. (2020). Role of firebrand combustion in large outdoor fire spread. Prog. Energy Combust. Sci. 76, 100801. doi:10.1016/j.pecs.2019.100801
Manzello, S. L., Suzuki, S., and Hayashi, Y. (2012). Enabling the study of structure vulnerabilities to ignition from wind driven firebrand showers: a summary of experimental results. Fire Saf. J. 54, 181–196. doi:10.1016/j.firesaf.2012.06.012
Manzello, S. L., and Suzuki, S. (2020). Influence of angle orientation on firebrand production from the combustion of surrogate photovoltaic (PV) panel assemblies exposed to applied wind fields. Fuel 279, 118507. doi:10.1016/j.fuel.2020.118507
Manzello, S. L., and Suzuki, S. (2012). ‘The new and improved NIST dragon’s LAIR (lofting and ignition research) facility: coupling the reduced scale continuous feed firebrand generator to bench scale wind tunnel’. Fire Mater. 36 (8), 623–635. doi:10.1002/fam.1123
Manzello, S., and Suzuki, S. (2014). Exposing decking assemblies to continuous wind-driven firebrand showers. Fire Saf. Sci. 11, 1339–1352. doi:10.3801/iafss.fss.11-1339
Maranghides, A., and Johnsson, E. (2008). Residential structure separation fire experiments. Gaithersburg, ML: NIST TN, TN1600.
Martin, J., and Hillen, T. (2016). The spotting distribution of wildfires. Appl. Sci. 6, 177. doi:10.3390/app6060177
McGrattan, K., Hostikka, S., Floyd, J., McDermott, R., and Vanella, M. (2013). in Fire dynamics simulator, User’s Guide. 6th Edn. Finland, United Kingdom: National Institute of Standards and Technology, and VTT Technical Research Centre of Finland.
Mell, W., and Maranghides, M. (2009). A case study of a community affected by the Witch and Guejito Fires. NIST Technical Note 1635.
Morandini, F., Santoni, P. A., and Balbi, J. H. (2001). The contribution of radiant heat transfer to laboratory-scale fire spread under the influences of wind and slope. Fire Saf. J. 36 (6), 519–543. doi:10.1016/s0379-7112(00)00064-3
Morandini, F., and Silvani, X. (2010). Experimental investigation of the physical mechanisms governing the spread of wildfires. Int. J. Wildland Fire 19, 570–582.
Pitts, W. M. (1991). Wind effects on fires. Prog. Energy Combust. Sci. 17 (2), 83–134. doi:10.1016/0360-1285(91)90017-h
Potter, B. (1996). Atmospheric properties associated with large wildfires. Int. J. Wildland Fire 6, 71–76. doi:10.1071/wf9960071
Quyang, Q., Dai, W., Li, H., and Zhu, Y. (2006). Study on dynamic characteristics of natural and mechanical wind in built environment using spectral analysis. Build. Environ. 41 (4), 418–426.
Razak, A., Hagishima, A., Ikegaya, N., and Tanimoto, J. (2013). Analysis of airflow over building arrays for assessment of urban wind environment. Build. Environ. 59, 56–65. doi:10.1016/j.buildenv.2012.08.007
Rothermel, R. (1972). A mathematical model for predicting fire spread in wildland fuels. Ogden, UT: U.S. Department of Agriculture, Intermountain Forest and Range Experiment Station.
Shah, K. B., and Ferziger, J. H. (1997). A fluid mechanicians view of wind engineering: large eddy simulation of flow past a cubic obstacle. J. Wind Eng. Ind. Aerod. 67-68, 211–224. doi:10.1016/s0167-6105(97)00074-3
Sharples, J., McRae, R. H. D., and Wilkes, S. R. (2012). Wind - terrain effects on the propagation of wildfires in rugged terrain: fire channelling. Int. J. Wildland Fire 21, 282–296. doi:10.1071/wf10055
Song, J., Huang, X., Liu, N., Li, H., and Zhang, L. (2017). The wind effect on the transport and burning of firebrands. Fire Technol. 53, 1555–1568. doi:10.1007/s10694-017-0647-1
Sullivan, A. L. (2009). Wildland surface fire spread modelling, 1990 - 2007. 1: physical and quasi-physical models. Int. J. Wildland Fire 18, 349–368. doi:10.1071/wf06143
Suzuki, S., and Manzello, S. L. (2017a). Experimental investigation of firebrand accumulation zones in front of obstacles. Fire Saf. J. 94, 1–7. doi:10.1016/j.firesaf.2017.08.007
Suzuki, S., and Manzello, S. L. (2017b). Experiments to provide the scientific-basis for laboratory standard test methods for firebrand exposure. Fire Saf. J. 91, 784–790. doi:10.1016/j.firesaf.2017.03.055
Suzuki, S., and Manzello, S. L. (2020a). Garnering understanding into complex firebrand generation processes from large outdoor fires using simplistic laboratory-scale experimental methodologies. Fuel 267, 117154. doi:10.1016/j.fuel.2020.117154
Suzuki, S., and Manzello, S. L. (2020b). Role of accumulation for ignition of fuel beds by firebrands. App. Energy Comb. Sci. 1-4, 100002. doi:10.1016/j.jaecs.2020.100002
Suzuki, S., Manzello, S. L., and Hayashi, Y. (2013). The size and mass distribution of firebrands collected from ignited building components exposed to wind. Proc. Combust. Inst. 34 (2), 2479–2485. doi:10.1016/j.proci.2012.06.061
Suzuki, S., and Manzello, S. L. (2019). Investigating effect of wind speeds on structural firebrand generation in laboratory scale experiments. Int. J. Heat Mass Tran. 130, 135–140. doi:10.1016/j.ijheatmasstransfer.2018.10.045
Suzuki, S., Manzello, S. L., Kagiya, K., Suzuki, J., and Hayashi, Y., (2015). Ignition of mulch beds exposed to continuous wind-driven firebrand showers, Fire Technol., 51:905–922. doi:10.1007/s10694-014-0425-2
Suzuki, S., and Manzello, S. L. (2021). Towards understanding the effect of cedar roof covering application on firebrand production in large outdoor fires. J. Clean. Prod. 278, 123243. doi:10.1016/j.jclepro.2020.123243
Syphard, A. D., Keeley, J. E., Massada, A. B., Brennan, T. J., and Radeloff, V. C. (2012). Housing arrangement and location determine the likelihood of housing loss due to wildfire. PLoS One 7 (3), e33954. doi:10.1371/journal.pone.0033954
Tarifa, C. S., Notario, P. P. d., and Moreno, F. G. (1965). On the flight paths and lifetimes of burning particles of wood. Symp. Int. Comb. 10, 1021–1037. doi:10.1016/s0082-0784(65)80244-2
Tohidi, A., and Kaye, N. B. (2017a). Comprehensive wind tunnel experiments of lofting and downwind transport of non-combusting rod-like model firebrands during firebrand shower scenarios. Fire Saf. J. 90, 95–111. doi:10.1016/j.firesaf.2017.04.032
Tohidi, A., and Kaye, N. B. (2017b). Stochastic modeling of firebrand shower scenarios. Fire Saf. J. 91, 91–102. doi:10.1016/j.firesaf.2017.04.039
Tohidi, A., Kaye, N., and Bridges, W. (2015). Statistical description of firebrand size and shape distribution from coniferous trees for use in Metropolis Monte Carlo simulations of firebrand flight distance. Fire Saf. J. 77, 21–35. doi:10.1016/j.firesaf.2015.07.008
Trucchia, A., Egorova, V., Butenko, A., Kaur, I., and Pagnini, G. (2019). RandomFront 2.3: a physical parameterisation of fire spotting for operational fire spread models - implementation in WRF-SFIRE and response analysis with LSFire+. Geosci. Model Dev. 12, 69–87. doi:10.5194/gmd-12-69-2019
Wang, S., Huang, X., Chen, H., and Liu, N. (2017). Interaction between flaming and smouldering in hot-particle ignition of forest fuels and effects of moisture and wind. Int. J. Wildland Fire 26 (1), 71–81. doi:10.1071/wf16096
Weber, R. O. (1989). Analytical models for fire spread due to radiation. Combust. Flame 78, 398–408. doi:10.1016/0010-2180(89)90027-8
Weber, R. O. (1991). Modelling fire spread through fuel beds. Prog. Energy Combust. Sci. 17 (1), 67–82. doi:10.1016/0360-1285(91)90003-6
Keywords: large outdoor fires and the built environment, firebrands, accumulation, separation distance, firebrand generator
Citation: Suzuki S and Manzello SL (2021) Investigating the Effect of Structure to Structure Separation Distance on Firebrand Accumulation. Front. Mech. Eng 6:628510. doi: 10.3389/fmech.2020.628510
Received: 12 November 2020; Accepted: 15 December 2020;
Published: 28 January 2021.
Edited by:
Myeongsub Kim, Florida Atlantic University, United StatesReviewed by:
Xinyan Huang, Hong Kong Polytechnic University, Hong KongGianni Pagnini, Basque Center for Applied Mathematics, Spain
Copyright © 2021 Suzuki and Manzello. This is an open-access article distributed under the terms of the Creative Commons Attribution License (CC BY). The use, distribution or reproduction in other forums is permitted, provided the original author(s) and the copyright owner(s) are credited and that the original publication in this journal is cited, in accordance with accepted academic practice. No use, distribution or reproduction is permitted which does not comply with these terms.
*Correspondence: Samuel L. Manzello, c2FtdWVsbUBuaXN0Lmdvdg==
 Sayaka Suzuki
 Samuel L. Manzello