- CU-ICAR, Automotive Engineering Department, Clemson University, Greenville, SC, United States
Strict CO2 emission and fuel economy regulations are motivating the developers of internal combustion engines to consider alternative fuels. Dual-fuel NG diesel engines are attractive due to minimal design changes, ability to maintain high compression ratio of the diesel baseline, and elimination of driver's range anxiety. A typical overarching goal is to maximize the substitution ratio, but the higher complexity of the dual-fuel engine comes with challenges, such as the knock limit at high load, combustion instability at low load and methane slip. Development of dual-fuel engine and its control strategies can benefit from predictive simulations, capable of providing deep insights into combustion and emission formation. They can dramatically lower the time and cost for explorations of design and optimizing engine control strategies. Even when experimental data is available, the simulation can provide useful additional insight by predicting value of parameters that are not easy to measure from experimental setup. This paper presents development of a Quasi-D multi-zone combustion model of a heavy-duty dual-fuel engine. The approach marries the best features of the multi-zonal diesel spray model with the turbulent flame entrainment model for the premixed charge of NG and air/EGR. The diesel combustion model developed in this study is based on the framework proposed by Hiroyasu (1985) with several improvements in its sub-models. Regarding the combustion of the premixed charge, a new way of modeling the flame front area during NG flame propagation is proposed. The NG flame is assumed to initiate from the outer boundary of diesel spray and propagates into the space in the direction perpendicular to the diesel spray envelope. The algorithm incorporates geometrical information of all spatial constraints and it can provide a universal solution for various piston or cylinder head designs. The diesel and NG combustion models run concurrently to arrive at a complete prediction of the heat release history of both fuels, based on detailed information about the evolution of diesel spray, ignition and flame propagation of NG-air mixture.
Introduction
Advancements in extraction technologies have greatly increased NG reserve in recent years and kept its price very low. In the transportation sector, there is a strong economic drive to utilize more of this low carbon gaseous fuel. In heavy-duty (HD) markets, diesel engines have been playing a dominating role due to their high thermal efficiency. According to 2020 Annual Energy Outlook published by EIA, in highway transportation sector, the annual amount of fuel consumed by HD trucks accounts for 26.3% of total fuel used in 2020. The prediction of this percentage for 2050 is 31.2%. The CO2 emission potential of NG is less than liquid hydrocarbon fuels; therefore, due to the high miles traveled by HD trucks, converting base diesel to NG only or dual-fuel mode would quickly increase the utilization of NG in transportation, as well as reduce the CO2 emission. NG is a relatively clean fuel due to its main constituent being Methane. Since Methane does not contain carbon-carbon bonds, its combustion is soot-free (Korakianitis and Namasivayam, 2011). All of these facts place NG as a top choice for alternative fuel.
Majority of HD NG engines today are spark ignited (SI) engines converted from diesel platforms. Those engines operate at near stoichiometric charge in order to use three-way catalysts for mitigating emissions. To avoid knock, compression ratio (CR) is generally lowered to typical level for an SI engine. The major drawbacks of this type of NG engine are: (i) SI NG engine operates solely on NG and relies heavily on NG re-fueling facilities, and (ii) efficiency is compromised due to reduced CR and stoichiometric mixture. Dual-fuel engine on the other hand, is converted from a diesel platform with minimal changes of hardware. In a typical dual-fuel engine setup, NG is injected into the intake runner through port fuel injection. This is often referred to as fumigation. The NG mixes with air and exhaust gas recirculation (EGR) as it is being inducted into the cylinder. A small amount of diesel spray is used as ignition source toward the end of compression. Multiple ignition sources generated from combustion of diesel fuel allow NG to burn in very lean conditions. Both the high compression ratio and lean-operation are retained, and its thermal efficiency is superior compared to its SI counterpart (Krishnan et al., 2002).
A dual fuel engine can run either diesel-only mode or diesel-NG dual fuel mode; therefore, the driver's range anxiety is eliminated in regions with sparse NG infrastructure. Of course, conversions to NG come with their own challenges. The storage of NG is one, since NG is a gaseous fuel, and even when compressed to high pressure NG has significantly lower energy density by volume compared to diesel fuel. In addition, fueling stations and infrastructure for natural gas are far from fully developed in US. The leakage of NG to atmosphere also poses significant environmental risk, since NG has much higher greenhouse effect than that of CO2.
Karim et al. pioneered early research studies of dual-fuel engines (Karim et al., 1966; Karim and Khan, 1968; Karim, 1987; Karim and Liu, 1992; Liu and Karim, 1997, 1998). Poor combustion stability at low loads and knocking at high loads were the two major issues identified. At lower loads, the lean NG-air mixture creates a challenge for the flame to propagate, while under high load, the high compression ratio of a diesel engine elevates the risk of end-gas knock. Methane slip is another common issue associated with dual fuel engines. Poor combustion stability at low loads leads to incomplete combustion and allows part of unburned NG to escape to environment. In more recent studies, Krishnan et al. proposed a new mode of dual-fuel combustion, where an early pilot injection of diesel fuel serve solely as ignition source, while vast majority of heat release comes from combustion of NG fuel (Krishnan et al., 2004, 2009; Srinivasan et al., 2006a,b; Krishnan and Srinivasan, 2010). In that case, the ignition timing is governed by chemical kinetics, and since the diesel is injected early the pre-ignition period is extended thus promoting better mixing. The presence of rich diesel pockets is significantly reduced and consequently soot emission is negligible. Better mixing between diesel and NG-air mixture also helps ignition of NG, and NOx emissions are generally lower too.
Though experimental study is the most trusted method for validating concepts and providing insight into the combustion process, it is also the most expensive and lengthy, particularly is multiple design variants have to be explored. Additionally, experimental data does not always reveal the underlying mechanisms of the observed phenomenon and information such as instant in-cylinder gas temperature or composition. Simulation studies on the other hand, generate insights into the combustion characteristics much faster and allow efficient screening of design options or investigations of control strategies. In particular, predictive simulation of the dual-fuel combustion process would be invaluable for detailed characterization of diesel-NG injection strategies.
Generally, 3-D simulations provide detailed spatial resolution of the combustion process, but come with the heavy computational cost. Previous work by Reitz and Krishnan's group (Zhang et al., 2003; Singh et al., 2004, 2006) focused on dual-fuel concepts and produced valuable insights of the in-cylinder process. However, compared to Quasi-D or 0-D modeling approaches, 3-D simulation requires one or more orders of magnitude higher computational effort. On the other end of the spectrum, a 0-D combustion model, such as a Wiebe function representation of the heat release, requires little computing effort, but provides no information about the details of spatially-resolved phenomena such as mixing or flame propagation. Previously published literature (Liu and Karim, 1997; Abd Alla et al., 2000; Karim, 2003; Xu et al., 2014, 2017a) have established 0-D models that separate the heat release contributions of each fuel, but in a prescriptive manner. In summary, the fidelity and predictiveness of a 0-D model is very limited. In comparison, Quasi-D modeling approaches provide a compromise between model fidelity and computing efficiency. Quasi-D multi-zone models of dual-fuel combustion have been studied in the literature (Papagiannakis et al., 2005, 2007; Johnson et al., 2012; Walther et al., 2012). In the previous research efforts to develop a Quasi-D model for a dual-fuel engine, Papagiannakis et al. (2005) proposed to incorporate turbulent flame propagation modeling approach to represent the combustion of NG. The NG flame was assumed to propagate from the outer boundary of a diesel spray, which was approximated as a conical shape. However, the discussion of the combustion of diesel fuel was limited. Krishnan and Srinivasan (2010) on the other hand, has incorporated detailed discussion of the diesel spray and combustion modeling, where a diesel spray was divided into multiple packets that were treated individually. However, the author assumed NG to propagate as individual spherical flames from each ignition site that do not interact with each other.
The modeling approach proposed in this paper marries the best features of the two approaches described above, i.e., the multi-zonal spray model of the diesel mixing and combustion and the turbulent flame entrainment model of the premixed NG combustion. In particular, the diesel spray and combustion behavior are modeled by dividing the injected diesel fuel into multiple packets, and tracking the break-up, evaporation, air entrainment and ignition in each packet. The combustion of NG is modeled as two simultaneous processes, i.e., the turbulent flame entrainment, which is highly dependent on spatial considerations and the turbulent flow field, and the burn up of NG-air charge in the finite reaction zone defined by the flame area and its thickness. The two combustion models run concurrently to arrive at a complete prediction of the dual-fuel combustion process, where heat release histories of both fuels are dependent on parameters such as the injection timing and rate, spray targeting, air motion, combustion chamber shape and NG-air ratio. The diesel combustion model developed in this work is based on the framework proposed by Hiroyasu and Kadota (1976) and Hiroyasu (1985) with several improvements done with sub-models (Xu et al., 2017b). The NG combustion predictions are based on a new way of modeling the flame front area and flame propagation. We assume that the flame is initiated from the outer boundary of diesel spray and propagates outward perpendicular to the spray boundary. As the flame evolves, it starts to interact with spatial constraints, e.g., combustion chamber walls or the adjacent flame. The algorithm incorporates geometrical information of all spatial constraints and it is capable of providing a universal solution for various piston or cylinder head designs. The paper includes experimental validation and ends with conclusions.
Materials and Methods
Approach to Dual-Fuel Combustion Modeling: Combining the Multi-Zonal Diesel Spray and Combustion Model With the NG-Air Mixture Ignition and Flame Propagation Scheme
The combustion mode in a typical modern diesel is a mixing-controlled process (Dec, 1997). After being injected with the high pressure and thus high velocity, the fuel evaporates while surrounding air entrains and mixes with it. Autoignition then occurs as soon as the induction period elapses at any location in the chamber, and the burning starts. In contrast, the conventional SI engine combustion is governed by the turbulent flame propagation, and the modelers typically divide the cylinder space into two zones: unburned and burned. This approach, combined with the flame entrainment model that takes into account the instantaneous flame area, can be categorized as the Quasi-Dimensional model, since it takes into consideration the interaction of the spherical flame with the walls. To achieve a similar level of prediction accuracy in case of the mixing-controlled combustion, the fuel injection and spray development processes have to be represented with multiple zones and sub-models of the key phenomena, such as break-up, evaporation, air entrainment, autoignition, and emission formation.
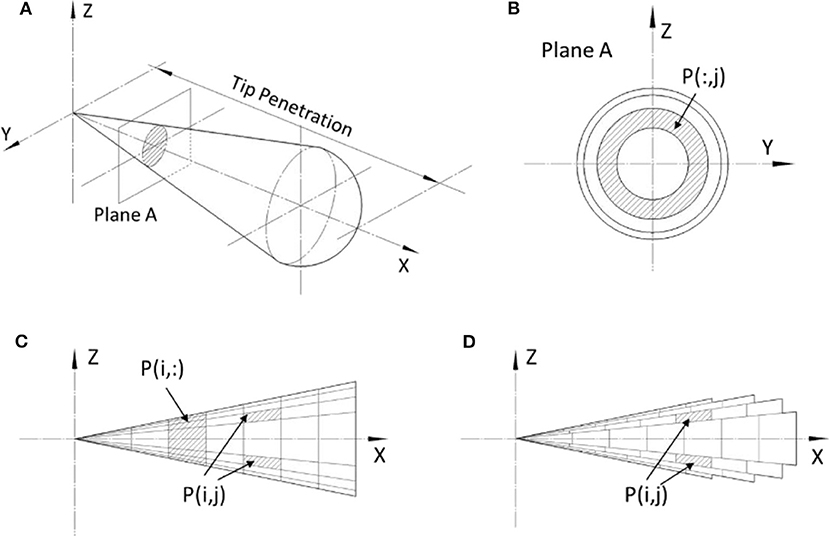
Hiroyasu et al. laid the foundation of such a multi-zone Quasi-D diesel combustion modeling approach, where a diesel spray is divided into individual packets as the fuel enters the chambers (Hiroyasu, 1985). A general description of this modeling methodology is given in Figure 1 (Xu et al., 2017b). In the direction perpendicular to the spray, the spray is defined as multiple slices, as shown in Figures 1A,B. Along YZ directions, the mass of the fuel is further allocated into each packet, where the distribution of mass is assumed to be uniform. Each packet in the spray is defined as P(i,j), as shown in Figure 1C. In this convention, i depicts packet index in X axis, while j depicts the index in Z axis. In real-world, the penetration depth at the center of the spray is longer than its periphery. This effect is considered as shown in Figure 1D. Transfer of mass or heat is not allowed in between packets.
Figure 2 gives an illustration of dual-fuel combustion process. Given the nature of the two fuels, e.g., diesel and Natural Gas, and the type of mixture preparation, it is clear that the two combustion modes progress in a sequence until the ignition of the premixed NG-air charge, followed by the simultaneous mixing controlled burning of diesel and flame propagation through the surrounding premixed charge. The conceptual representation of the diesel spray used here is adopted from the seminal work by Dec (1997). Figure 2(1–6) gives a time-lapse illustration of the combustion process from start of injection (SOI) of diesel to the end of combustion. Stage (1) shows the initial development of diesel spray right after the fuel is injected into the NG-air mixture. After a short ignition delay period, diesel fuel auto ignites and initiates the premixed combustion of diesel vapor that was able to mix with air up to that point. As soon as the local temperature increases significantly enough, the NG-air mixture surrounding the diesel spray is also ignited (Karim, 2003). As the combustion progresses to stage (3), the combustion mode of diesel transfers from premixed burning to mixing controlled burning, with evidence of a head vortex formation, surrounded by the diffusion flame. Meanwhile, a NG flame front forms around the diesel spray as multiple flame kernels merge together and propagate into the unburned NG-air mixture. At stage (4), diesel fuel continues to burn in the mixing-controlled mode and soot cloud forms in the center of the head vortex, while NG flame continues to propagate into the end gas zone. Due to the heat released from diesel and NG combustion, the NG-air mixture in the end gas zone is subject to high temperature and pressure, thus there is a chance for an auto-ignition in the late stages of the process (Liu and Karim, 1998), especially at higher loads. At stage (5), diesel combustion mode remains governed by the mixing-controlled burning until all diesel fuel is consumed. As NG flame continue to propagate, the flame fronts formed from each individual spray interact with neighboring ones and merge together. In the final stage (6), diesel fuel is already consumed and most of the soot is oxidized due to high temperatures and oxygen available in the lean products of NG combustion. Lastly, the flame propagation of NG terminates as the flame front reaches the wall. Due to the lower laminar flame speed of lean NG-air mixture, there is a chance that a small portion of NG in the end gas zone remains unburned at exhaust valve opening (EVO), especially at low load conditions. The ability of the model to predict that is critical for enabling studies aimed at prevention of the methane slip.
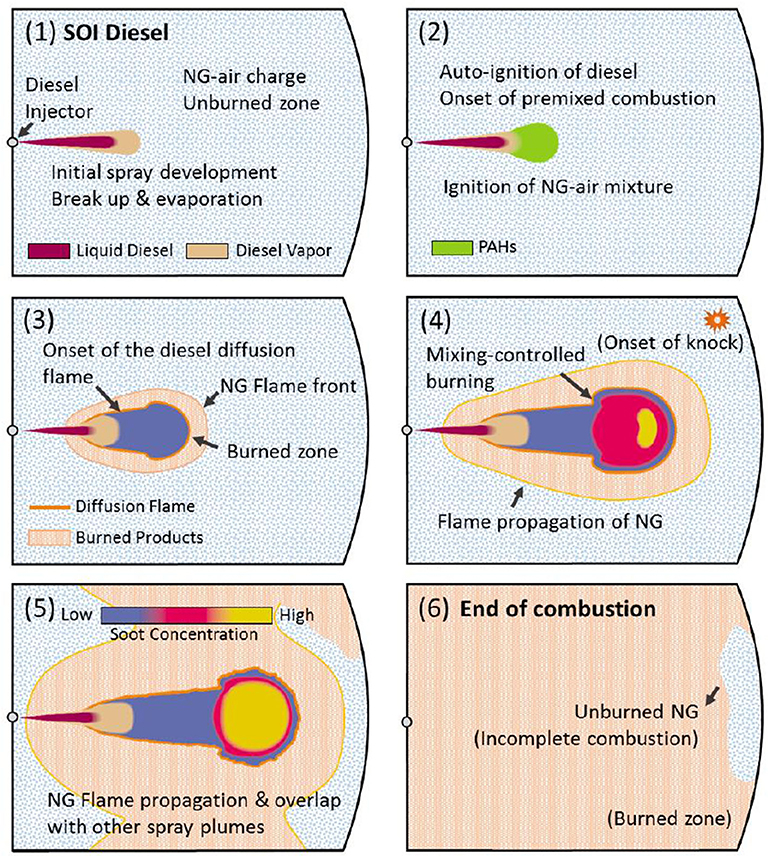
Figure 2. A time-lapse illustration of dual-fuel combustion process. Conceptual spray evolution images are from the seminal paper by Dec (1997), SAE 970873.
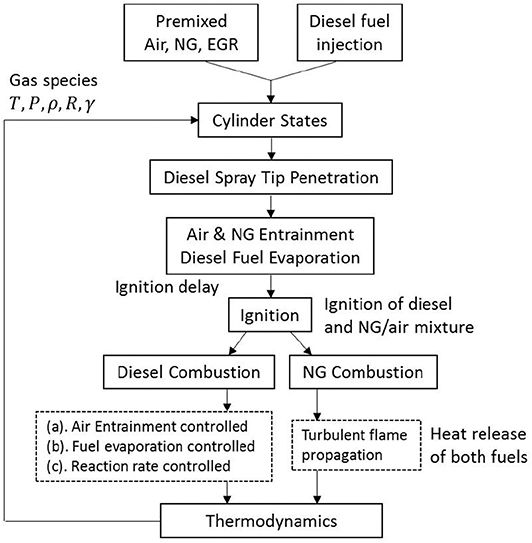
Figure 3 shows the simulation flow-chart. The process shown in this figure is executed at each crank-angle from the start of diesel fuel injection, until the completion of the combustion process, i.e., termination of all heat-release pathways. The output drives the thermodynamic simulation and produces crank-angle resolved heat release and pressure trace. The cycle simulation is initiated at intake valve closing (IVC) and is terminated at EVO. Since both intake and exhaust valves are shut, the in-cylinder mass stays unchanged, i.e., the work presented here was focused on the closed-cycle simulation. The gas composition in the cylinder at onset of simulation is either premixed NG-air or NG-air-EGR mixture. During compression, thermodynamics model updates in cylinder pressure and temperature by solving the first law equations and considering heat transfer. The temperature information is subsequently used for ignition delay prediction. Starting from SOI, the diesel spray tip penetration sub-model, air-NG entrainment sub-model, and diesel droplet evaporation sub-models are triggered to update spray variables. In this work, NG is allowed to entrain into the packets together with air before the start of combustion (SOC). The NG entrainment is terminated after SOC since the burning mode of NG is transformed into turbulent flame propagation. After the ignition is detected, it triggers the sub-models for calculating heat release from diesel and NG in each packet. The NG entrained into the packets during the ignition delay period is consumed quickly after SOC while the diesel continues to burn thanks to the remaining oxygen in the lean charge.
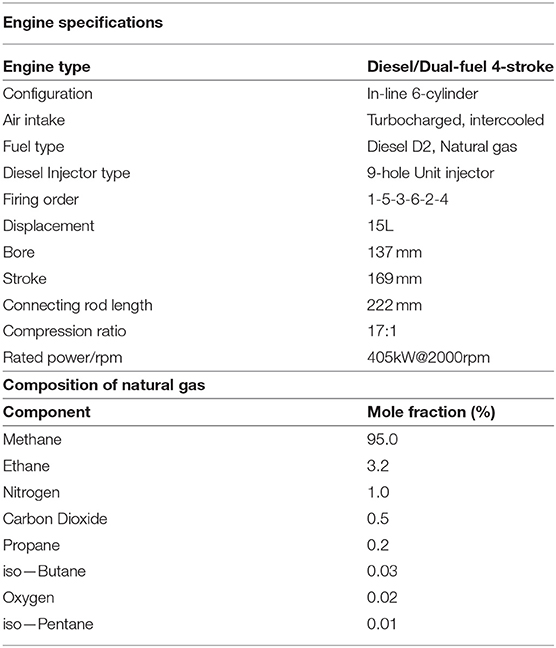
In each packet, three modes of diesel heat release are being considered simultaneously, namely the air entrainment controlled, fuel evaporation controlled and reaction rate controlled (Xu et al., 2017b). As the heat released from diesel fuel ignites its surrounding NG-air mixture, the combustion of NG becomes self-sustaining and the flame propagates into the end gas zone similar to that in a SI engine. The total heat release of dual-fuel combustion is the sum of heat released by both fuels. In this work, the NG fuel used in experiment is mostly methane (95%). A detailed list of constituents of the NG fuel is provided in Table 1. The above-mentioned sub-models will be discussed in detail in latter sections.
Modeling of Diesel Spray and Combustion
Spray Tip Penetration Model
The spray tip penetration correlation used in this work is developed based on widely adopted Hiroyasu's work (Hiroyasu and Kadota, 1976; Hiroyasu, 1980, 1985). However, the model was updated to capture the recent development of diesel injectors characterized by much higher injection pressure and smaller hole diameters compared to the original Hiroyasu's experiments. In other words, new correlation for spray break-up time was developed and validated with the experimental data from Xu et al. (2017b). Equation (1) shows the new correlation used to represent the time between SOI and breakup of the fuel jet:
where ρa is in-cylinder gas density, ρ0 is reference density of air at SATP, ρl is the density of liquid fuel, d0 is injector hole diameter and ΔP is the pressure difference between injection pressure and in-cylinder pressure. Before tb is reached, spray tip penetration S is a linear function of time after injection t, given in Equation (2). After breakup of the spray, the tip penetration is represented as a function of , given in Equation (3).
The centerline of a spray has highest penetration depth. The penetration depth gradually reduces as the locations move toward the periphery. Equations (4)–(5) represent penetration depth at the periphery. In the radial direction, Ex is defined as a weighting factor, where xs is a non-dimensional parameter representing the distance from centerline of the spray. Ex reaches its maximum at the centerline of the spray, where xs is zero. At the periphery of the spray, xs becomes 1 and Ex reaches its minimum of 0.5. The breakup time at periphery region tbx and penetration depth at periphery Sx are defined as a function of Ex.
Air-NG Entrainment Model
The air entrainment rate is estimated based on the findings of Hiroyasu (1980). As shown in Equation (6), the entrainment rate is calculated based on the injection velocity v0 defined in Equation (7), in-packet fuel mass mf0, density of fuel ρl, density of air ρa, weighting factor Ex, breakup time coefficient αb, air mass entrained ma and the diameter of nozzle hole d0. In each calculation step, the ordinary differential equation (ODE) is integrated to update information of air mass entrainment.
At diesel only conditions, only air and EGR are entrained into the spray, while at dual-fuel conditions, the entrained mass also includes NG. Entrained NG mass can be derived from the mass fraction of NG in the premixed NG-air mixture at IVC xNG, as given in Equation (8), where ṁNG is the NG entrainment rate into the packet. The mass entrainment rate into the diesel spray is zero after the SOC. In this work, it is assumed that once ignition starts, the NG in the unburned zone (outside the outer boundary of diesel spray) is only consumed by flame propagation. This assumption is based on the observation that flame propagation speed of natural gas is faster than the diesel spray tip penetration. Even in a situation when the diesel spray penetration speed is relatively high, the buildup of the multi-zonal spray in the direction perpendicular to the injector hole axis is relatively low, and definitely lower that the outward propagation of the flame through the NG-air mixture. This assumption is captured with the equation below:
Fuel Evaporation Model
After the breakup period, the spray consists of miniature droplets. The droplet diameter plays a significant role in the evaporation process. While the actual droplets may have somewhat irregular shape, the Sauter Mean Diameter (SMD) was introduced by Hiroyasu et al. to define the diesel droplet diameter in a consistent manner (Hiroyasu and Kadota, 1976). The representation of SMD is defined in Equations (9–11), where d0 represents diameter of nozzle hole, μl represents diesel fuel viscosity, μa represents air viscosity, We is Weber number and Re is Reynolds number. D32 is SMD, where LS and HS in the Equations (9) and (10) refer to low injection velocity (pressure) and high injection velocity (pressure), respectively (Hiroyasu et al., 1989).
The diameter of a fuel droplet can be updated through the ODE given in Equation (12), where Dl is droplet diameter, ρl is the density of liquid fuel and ml is the mass of liquid fuel droplet. The initial diameter of the fuel droplet Dl0 is obtained from the SMD given in Equation (11). The detailed calculation scheme to obtain evaporation rate of a droplet dml/dt can be found in the work by Kadota and Hiroyasu (1976).
the mass of fuel vapor in a packet mfg is represented in Equation (13), where N represents fuel droplets number, as defined in Equation (14), mf0 represents initial fuel mass in this packet, ρl0 is initial density and Dl0 is initial diameter of the droplet.
Ignition Delay Model
The ignition delay period in a dual-fuel engine is defined as the duration between SOI and SOC of the diesel fuel. Many correlations for predicting ignition delay in a diesel engine exist in the literature. Those include the Arrhenius-function based correlations (Wolfer, 1938; Kadota et al., 1976; Watson et al., 1980; Kobori et al., 2000; Assanis et al., 2003) and chemical kinetics based models (Halstead et al., 1977; Sazhina et al., 1999). In above mentioned methods, the Arrhenius-function based correlation proposed by Assanis et al., as given in Equation (15), has been proven to have good ignition delay prediction performance (Assanis et al., 2003).
where τID is ignition delay in ms, ϕ is the equivalence fuel-air ratio, P and T are the cylinder pressure and temperature at SOI in bar and K and Ea/Ru is constant 2100 for diesel fuel (Watson et al., 1980). The same correlation has been modified to predict the ignition delay of a dual-fuel engine and was validated to yield satisfying results (Xu et al., 2017b).
Here we apply two definitions of equivalence ratio. The total fuel-oxygen ratio relative to stoichiometric is defined in Equation (16), where fuel masses of both diesel and NG are considered.
In the equation above, ϕtotal represents total equivalence ratio, mfuel represents total fuel mass, mO2 represents mass of oxygen and (mfuel/mO2)st is represents stoich fuel-oxygen ratio:
where mD represents diesel fuel mass and mNG represents NG fuel mass. Constant 3.045 is stoich oxygen-diesel ratio and constant 3.612 is stoich oxygen-NG ratio. To represent specific equivalence ratio of diesel fuel, a pseudo diesel equivalence ratio is defined:
where 0.328 is stoich diesel-oxygen ratio. It is assumed that diesel fuel has access to all oxygen in the cylinder. To define ignition delay in dual-fuel combustion, the correlation defined in Equation (15) is applied. Pseudo diesel equivalence ratio ϕpD defined in Equation (18) is used in this correlation:
Heat Release Model
It is assumed that only diesel vapor and NG react with surrounding air, while liquid fuel is not involved in combustion. The mass of fuel burned, including both diesel and NG in the individual packets or zones is determined by the mass of diesel vapor, NG and air and chemical reaction rates of both fuels. Equations (20) and (21) represent determination of the mass of fuel burned in each calculation step, where ϕ is the total equivalence ratio in the packet where both fuels are included; AFRstoich is the stoichiometric air fuel ratio obtained from ma, mfg and mNG, which are the mass of air, diesel vapor and NG, respectively; ṁchemD and ṁchemNG are chemical reaction rates of diesel-air and NG-air mixtures, respectively; ΔmD and ΔmNG are the mass of diesel and NG burned in a packet in each calculation step.
When the fuel/air mixture is rich (ϕ > 1), the burned fuel mass ΔmD and ΔmNG are determined by the available air mass, AFRstoich and the weighting between the mass of diesel vapor and NG. On the other hand, when the fuel/air mixture is lean, ΔmD and ΔmNG is determined by the fuel vapor mass mfg and NG mass mNG, respectively. When the burned fuel mass at each step calculated from the first two criteria is smaller than the chemical reaction rate limit ṁchemD or ṁchemNG, the first two criteria determine the burn rate. On the contrary, when the mass fuel burned is greater than chemical reaction rate limit, the third criterion determines the burn rate. The chemical reaction rates of diesel-oxygen and NG-oxygen mixtures can be determined from the following formulas (Westbrook and Dryer, 1981):
where C12H26 is used to approximate the chemical composition of diesel (n-dodecane) and CH4 is used to approximate NG, ṁchemD and ṁchemNG are the chemical reaction rates of diesel and NG in g/s, respectively; Ad and ANG are adjustable constants for diesel and NG, which are assumed as 2.5 × 10¹⁰ and 8.3 × 10⁵, respectively; Ea is activation energy, being 30 kcal/mol, R is universal gas constant, T is gas temperature in the packet in K, Vpac is packet volume in cm3, MD and MNG are the molecular weights of diesel and NG in g/mol and [C12H26], [CH4], [O2] denote the concentration of diesel vapor, NG and oxygen in mol/cm3.
With the aforementioned method to determine mass of fuel burned in each calculation step, the total heat release rate from the combustion of fuel is given in Equation (23), where LHVD and LHVNG are the lower heating values of diesel and NG and npac is the total number of packets.
Modeling of the Premixed NG-Air Combustion
As have been shown in Figure 2, the combustion of NG is initiated from the burning of the diesel-air mixture described in section Modeling of Diesel Spray and Combustion. The rest of NG-air mixture is then consumed through turbulent flame propagation. In this work, the burning of NG is divided into two stages: (1) combustion of NG entrained into the diesel spray before SOC and (2) self-sustaining combustion of NG-air mixture in the form of flame propagation.
The flame propagation of NG-air mixture is assumed to initiate from the outer boundary of diesel sprays. As shown in Figure 4A, the flame front propagates into space in the direction perpendicular to the outer boundary of a diesel spray (Papagiannakis et al., 2005). For the simplicity of numerical calculation, the outer boundary of a diesel spray is approximated as a conical shape with a hemisphere attached to the bottom of the cone. Once flame propagation is initiated, the flame front is assumed to travel with the same velocity in all directions until reaching other constrains such as cylinder wall, piston or the flame fronts initiated from surrounding sprays.
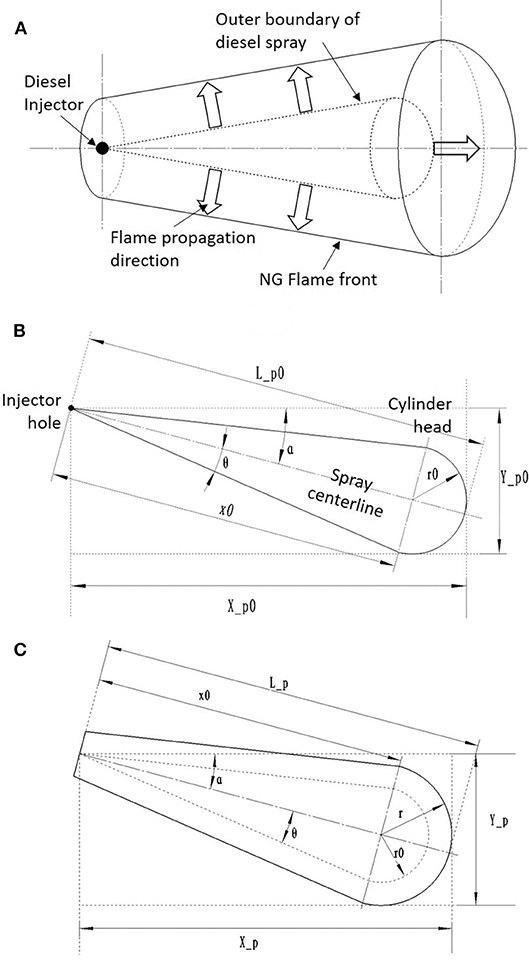
Figure 4. (A) Spatial illustration of NG flame initiation and propagation relative to a diesel spray. (B) Geometrical definitions of a diesel spray at SOC. (C) Geometrical definitions of a free-evolving NG flame front.
Turbulent Flame Propagation Model
In this work, the combustion of NG is modeled based on the turbulent flame propagation model widely used in 0-D, 1-D simulation of SI engines. In this modeling scheme, the in-cylinder space is divided into two zones: burned and unburned. However, in the context of a dual-fuel engine, a simple two-zone assumption is not sufficient since two fuels are burning in two different modes simultaneously. In this work, a multi-zone diesel spray-combustion model is running in parallel with the NG turbulent flame propagation model thus the definition of zones and boundaries had to be addressed carefully. This is presented in detail in section Flame Geometry Model.
Since the combustion of NG occurs after SOC of diesel, part of the in-cylinder charge has already entrained into the diesel spray and should not be included in the modeling of NG flame propagation. After the ignition of NG, it is assumed that only unburned NG-air mixture is entrained by the flame, while all the diesel vapor and burned products from the combustion of diesel are retained in the packets and are not participating the NG flame propagation.
According to the modeling approach proposed by Tabaczynski et al. (1977), the rate of mass entrained into the reaction zone is represented as:
where me is the mass entrained into the reaction zone, ρu is unburned gas density, Af is the surface area of flame front, SL is laminar flame speed and u′ is turbulent intensity. The calculation of Af, SL and u′ will be discussed in detail in latter sections. Once unburned gas is entrained into the reaction zone, the NG-air mixture burns with a rate proportional to the unburned mass in the entrainment front. The rate of mass burned can be obtained as:
where mb is the burned mass and τ is the characteristic burning time. The characteristic burning time is defined as the time it takes to traverse the length of the Taylor microscale λ with laminar flame speed SL (Tabaczynski et al., 1977):
The laminar flame speed of NG-air mixture SL can be obtained as (Heywood, 1988):
where SL0, α0, β0 are constants for a given fuel and equivalence ratio, T0 = 298K and p0 = 1atm are reference temperature and pressure, Tu is unburned gas temperature, p is cylinder pressure and is the mole fraction of burned gas diluent. In this work, represents the burned gas fraction in the NG-air mixture in the unburned zone. In the simulations performed in this study, this variable is set to zero, since the test points did not have external EGR, and the engine has negligible amount of internal residual at the operating conditions tested. In a situation where external EGR is used or a high cam overlap is present, the mole fraction of burned gas will need to be considered. The three constants SL0, α and β for NG are defined as given in Equations (28) and (29) (Hernandez et al., 2005), where Bm = 0.49m/s, Bϕ = −0.59m/s, ϕm = 1.39 and ϕ is equivalence ratio.
The Taylor Microscale λ used in Equation (26) is the spacing of turbulent Kolmogorov vortices in the reaction zone, as conceptualized by Poulos and Heywood (1983). It can be tracked as a function of integral length scale L and turbulence intensity u′:
where A = 1 for perfect isotropy and ν is kinematic viscosity. The kinematic viscosity of unburned gas can be obtained from the correlation given in Equation (31), where Tu and ρu are unburned gas temperature and density.
Before SOC, the integral length scale L used in Equation (30) can be represented as the instantaneous height of the combustion chamber, based on the assumption that a smallest dimension will constrain to the size of large eddies. Therefore, L can be expressed as a function of cylinder volume V and bore size B–see Equation (32). The calculation of integral length scale after combustion will be discussed in the latter section.
The turbulence intensity u′ before SOC is determined from the turbulent energy cascade model, also known as the k − ε model (Poulos and Heywood, 1983). In this model, mean kinetic energy K is converted to kinetic turbulent energy k, and kinetic turbulent energy is then converted to heat via viscous dissipation on the Kolmogorov scale. The mean kinetic energy and kinetic turbulent energy are defined as given in Equations (33) and (34), where m is the mass in the cylinder and U is mean flow velocity.
The change rate of mean kinetic energy and kinetic turbulent energy , are given as:
where ṁi and ṁe are the mass flow rate into and out of the cylinder, vi is velocity of flow into the cylinder, Pt and ε are the production and dissipation rate of turbulent kinetic energy, respectively. Since the cycle simulation starts at IVC and end at EVO, no mass transfer exists between cylinder and ambient during the simulation span, thus the terms with valve mass flow rates ṁi and ṁe are zero. The production and dissipation term for turbulent kinetic energy Pt, ε are defined as given in Equations (37) and (38), where cβ is an adjustable constant.
During the combustion, the turbulence intensity and integral length scale are governed by the conservation of angular momentum of large eddies (Poulos and Heywood, 1983):
where L0, and ρu0 are integral length scale, turbulence intensity and unburned gas density at SOC.
Flame Geometry Model
The flame front area Af appeared in Equation (24) is defined as the surface area of the leading edge of the flame. Flame front area governs the mass entrainment rate into the reaction zone. In conventional SI engines, it is generally accepted that the flame front initiates from the location of spark and propagates into the space with a spherical shape. In a dual-fuel engine, the ignition of diesel generates multiple ignition sites for the surrounding NG-air mixture. Those ignition sites then form a unit flame front which travels in a direction perpendicular to the outer boundary of diesel spray. Under this circumstance, the flame front can no longer be considered as spherical. Instead, a more sophisticated flame front model which has the fidelity to predict the evolution of the flame surface area as it propagates from the ignition sites in diesel-fuel packets is needed. The flame fronts formed around the glowing diesel sprays will eventually interact with each other, and the geometric constraints established by the combustion chamber boundaries.
In this work, a new flame geometry model is developed to predict the flame front area of NG-air flame. A detailed model is proposed to establish flame kernels and subsequently track the evolution of the flame front. The in-cylinder space is divided into a number of slices equal to the number of diesel injector holes. It is assumed that diesel sprays injected from each injector hole are identical and uniformity is assumed among all slices, thus the flame geometry model only needs to be applied to one slice.
Initial conditions for flame initiation
The NG flame front is assumed to originate from the outer boundary of a diesel spray, thus the geometry of diesel spray at SOC determines the initial conditions of NG combustion. It is assumed that combustion of NG in a dual-fuel engine initiates from multiple ignition sites surrounding the diesel spray, based on Karim and Liu (1992), and that initial flame kernels merge together to form a uniform front. Figure 4B gives geometrical definition of a diesel spray at SOC viewing from the side. The shape of the diesel spray is approximated by a combination of a cone and a hemisphere, which agrees well with optical studies of diesel sprays (Dec, 1997).
The spray tip penetration at SOC is represented as Lp0, which can be obtained from the spray penetration model given in Equations (2) and (3). The spray angle θ is obtained from the correlation developed by Hiroyasu (1980):
where ρa, μa are density and dynamic viscosity of in-cylinder gas at SOI, ΔP is the pressure difference between the injector and ambient and d0 is the injector hole diameter. The angle between the spray centerline and cylinder head is represented as α. The height of the cone x0 and the diameter of the hemisphere r0 can be obtained as:
Free evolving flame front
Once the flame front is formed, it propagates freely into the space in the direction perpendicular to the diesel spray outer boundary. In case that there are no constrains to the propagation, the geometry of flame front is represented in Figure 4C. For this free evolving flame front, it is assumed that the velocity of flame is identical at every location. At any moment of flame propagation, the distance between the injector hole and the furthest location of flame front relative to injector Lp is defined as:
where Lp0 is obtained from initial conditions and is the distance of flame front traveled after SOC. At any moment, this distance traveled is identical at every location of the flame front. With Lp known, the radius of the hemisphere flame front r is defined as the difference between Lp and initial height of the cone x0:
The furthest distance between flame front and the injector hole in the direction perpendicular and parallel to the cylinder head Xp and Yp are defined as:
Interaction with constrains
In real-world conditions, the NG-air flame initiated from the diesel spray will not always propagate freely into the space. Instead, the flame front constantly interacts with surrounding constrains, including cylinder head, wall, piston and other flame fronts from surrounding sprays. All these constrains need to be taken into consideration in the calculation of flame front surface area. To realize this, geometrical information about the combustion chamber is needed, including the piston bowl shape. Figure 5A shows the shape of the bowl-in-piston design used in the experiments. A detailed modeling of piston top geometry requires full definition of boundaries and significantly increases computational burden. Instead, its geometry can be approximated with the shape shown in Figure 5B, where the piston bowl is further bounded by the two surfaces parallel to cylinder head and wall, which are depicted as dashed lines. This approximation is for the convenience of solving the geometrical interactions between the flame front and piston bowl, and provides sufficient accuracy for the flame propagation simulation.
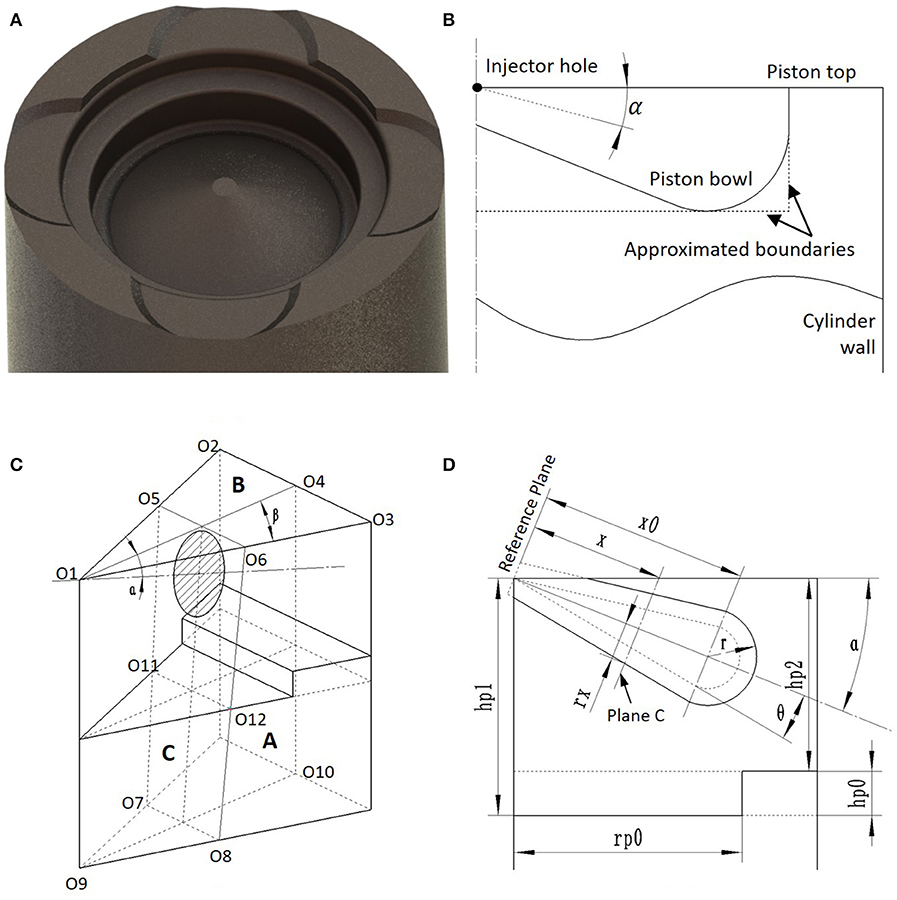
Figure 5. (A) Geometry of the piston from the engine used in this work. (B) Approximation of the piston geometry on a 2-D plane. (C) 3-D illustration of geometrical framework of the flame geometry model. (D) Further illustration of geometrical framework in a 2-D plane.
To solve the interaction between flame front and cylinder head, wall and piston top, the cylinder space is divided into 9 identical slices as shown in Figure 5C (for a 9-hole injector). The geometries defined in Figure 5C set the basic framework of the flame geometry model. Each slice is approximated as a triangular prism, where O1-O2-O3 defines plane B, representing the cylinder head; O1-O4-O10-O9 defines plane A, a vertical slice coplanar to the spray centerline; O5-O6-O8-O7 defines plane C, a slice perpendicular to spray centerline. The shaded area on plane C is the projection of the enflamed area, where the outer boundary of shaded area is the projection of flame front. The numerical scheme to arrive at the total flame front surface area is to calculate the projection of flame front on plane C and integrate them along the spray centerline. O5-O6-O8-O7 is the constraint for the flame front projection on plane C, where O5-O6 defines cylinder head, O11-O12 defines piston top, and O5-O7, O6-O8 defines the surrounding slices. When the projected flame front on plane C is within the constrains, the flame front is not touching any of the boundaries; however, when the projected flame front intersects with any of the constrains, the part outside of the boundaries is “cut-off” and is excluded from the calculation of the total flame front area. During the solving process, the position of the piston constantly changes as it moves toward or away from the TDC; thus, the plane C needs to be considered at every possible location. The geometrical definitions shown in this figure apply for all conditions and remain consistent in the latter sections of the paper.
The Plane A defined in Figure 5C can be further illustrated in Figure 5D. Here a reference plane is defined as a plane perpendicular to the spray centerline and is coplanar to the injector. The distance between the reference plane and Plane C is defined as x and the radius of projected free evolving flame front is defined as rx. The distance between the piston top and cylinder head is defined as hp2. The distance between piston top and the approximated plane of the piston bowl is defined as hp0, while the distance between cylinder head and piston bowl plane is hp1.
The radius of projected free evolving flame front rx can be obtained through Equation (45). Three scenarios are considered based on the distance x between reference plane and Plane C. When x is smaller than x0, it is assumed that the flame front travels in the direction parallel to the reference plane. Since the flame front has the same propagation speed at any location, the distance traveled by the flame front in this scenario is the same as the location where the flame evolves as a hemisphere, which is r − r0 at any instant. When x is greater than x0 and smaller than the furthest location of flame front relative to the reference plane, radius rx is obtained as the radius of the slice of the hemisphere. When x is greater than x0 + r, rx is zero.
The distance between piston top and cylinder head hp2 and the distance between the piston bowl plane and cylinder head hp1 can be obtained according to Equation (46), where Vcyl is the instantaneous volume of the cylinder, while Rcyl is the radius of the cylinder which equals to Bore/2. In this work, cylinder volume is calculated by assuming the piston top is flat, thus the piston bowl volume is neglected when obtaining hp2.
Figure 6A defines a two-dimensional coordinate system for plane A. The X-axis is coplanar to the cylinder head while Y axis is coaxial to the centerline of the cylinder. The point where X and Y axes cross is defined as the origin. The Plane C is extended in both directions to intersect with every possible plane. The intersection lines in the 3-D space are reduced to points A, B, C, D, E and O in this 2-D plane, where point A stays on line Y = −hp1, point B stays on line Y = −hp2, point C stays on line Y = 0, point D stays on line X = Rcyl and point O is the intersection point between line DE and spray centerline. The geometrical positions of these points enable a universal analytical solution of the flame front area. With the coordinate system defined, the functions of constraints and coordinates of intersection points can be easily obtained. The function representing the line on Plane C, which is line DE, can be defined as:
The coordinates of points A, B, C, D, E, and O can be obtained by solving the combined equations of line DE and other constraining lines:
The piston bowl is approximated as a flat surface with a function of Y = −hp1 for the convenience of numerical calculation. To obtain the solution of total flame front area, Plane C needs to be taken at every possible location. In the coordinate system defined above, Plane C is allowed to move between x = 0 and x = xt. The furthest location xt is defined as:
Figure 6B gives the geometrical definition of Plane C viewed from the origin of the spray and perpendicular to Plane C. As shown in Figure 5C, each slice of cylinder volume is assumed as a triangular prism, thus the intersection between the slice and the Plane C always results in a triangle, shown as the dashed outline in Figure 6B, where the lowest point corresponds to the point E shown in Figure 6A. The top line of the triangle corresponds to the cylinder head, the lower solid line corresponds to piston top, and the remaining two lines represent the boundary between the slice and the adjacent slices. The dashed circle defines the projection of the flame front on this plane, while the solid lines shown in this figure with a trapezoidal shape represent the constraints of the flame front. When the projection of the flame front is beyond the trapezoidal constraints, it is considered to be cut-off by the boundaries. In the Plane C, the projected flame front within the constraints is defined as the effective flame front, while the total length of the effective flame front is defined as the effective flame length.
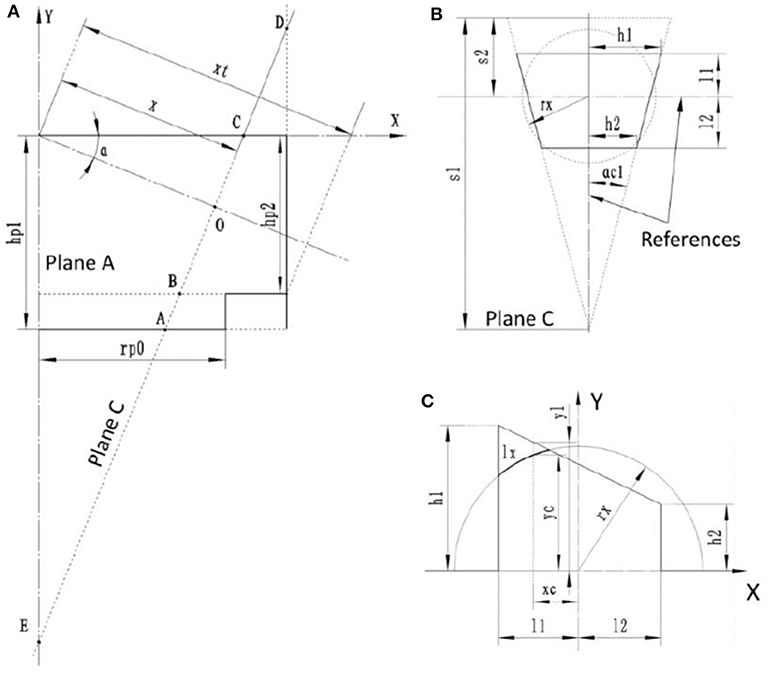
Figure 6. (A) Coordinate system developed for plane A. (B) Geometrical definition of Plane C. (C) Coordinate system developed for Plane C.
With the geometrical definition shown in Figure 6B, the geometrical information of the trapezoidal constraints can be easily obtained. Here the two reference lines are defined, both intersecting with the center of projected flame front, but one being parallel and another perpendicular to the cylinder head. The distances between the two horizontal lines and the horizontal reference are defined as l1 and l2. The two lengths which further defines the position of trapezoidal constraints in relative to the vertical references are h1 and h2, respectively. The numerical representation of l1 can be summarized as:
where |CO| and |DO| are the lengths of lines CO and DO defined in Plane A, which can be obtained from the coordinates of each points given above. YC, YD and YO are the Y coordinates of points C, D and O. Similarly, l2 can also be summarized as:
where Xi represents the X coordinates of each points defined in Plane A. In the above definition of l1 and l2, when the number becomes negative, the location of the constraints is on the opposite side of the reference line shown in Figure 6B. The height of the triangular boundary, defined as s1 in Figure 6B, can be obtained as:
Similarly, the distance between the cylinder head and the lateral reference line s2 can be represented as:
The angle which determines the shape of the triangular boundary, define as αc1 in Figure 6B, can be obtained as:
where β is the same as defined in Figure 5C, determined by the number of injector holes. The position of trapezoidal constraints relative to the vertical references are h1 and h2 can be obtained as:
Solving the flame front area
As mentioned in previous section, the total length of effective flame front in Plane C is defined as the effective flame length. This section presents the analytical method for determining this length. Once this length is found in each Plane C, it can be integrated along the spray centerline to arrive the total flame surface area. For ease of numerical calculation, the right half of Figure 6B is tilted counterclockwise for 90 and is represented as shown in Figure 6C, where the effective flame length is represented as lx. Since the geometry shown in Figure 6B is symmetrical with respect to the vertical reference line, the actual total effective flame length in this 2-D plane is twice of the effective flame length shown in Figure 6C, which is 2lx.
In the geometry defined in Figure 6C, when the projected flame front is beneath the constraints, the length of this flame front is considered as effective flame length and vice versa. To arrive a universal numerical solution, another coordinate system is defined. In this figure, a 2-D coordinate system is defined where X and Y axes are marked. The relative geometrical position of projected flame front and constraints are evaluated along the X axis from X = −rx to X = rx. At each point on both the projected flame front and constraints which satisfies X = xc, the Y coordinates are defined as Y = yc and Y = yl. By evaluating yc and yl at each xc, the total length of lx is obtained by discrete integration.
When X = xc is satisfied, yl can be determined by the geometry of the constraints. Here the Y coordinates of constraints when xc < −l1 or xc > l2 are set to zero to ensure the effective flame length is always zero at these conditions. The numerical solution of yl is given as:
Similarly, yc can be determined using the geometry of the projected flame front. The numerical solution of yc is given as:
With the information of yl and yc, the discrete segment of effective flame length dlx can be obtained by evaluating the geometrical relationship between projected flame front and constraints at each location. The dlx can be represented as a function of the coordinate of the X axis dlx = f (xc). By integrating dlx alone the X axis, the total effective flame length lx can be obtained as:
The discrete segment of effective flame length dlx = f (xc) can be determined from the geometrical information of the projected flame front and the relative relation between yl and yc. When yc is greater than yl, the projected flame surface is outside the constraints, indicating the flame is being “cut-off” by constraints, thus dlx is 0. On the contrary, when the projected flame front is within the constraints, the effective flame length is obtained by solving along the projected flame front. The numerical solution of f (xc) is summarized as:
Figure 7A gives an example of effective flame length calculation and its relation to the relative geometry between projected flame front and constraints. The constrains are illustrated with the thick black line, where the left vertical represents the cylinder head surface, the top line is the boundary of the slice and the right vertical line is the piston top. In this figure, the geometry of flame is fixed and x is the only varying parameter. Recall that x represents the distance between the injector tip and Plane C. The relative geometry between constraints and projected flame front is also shown. It can be observed that effective flame length increases with x due to the center of projected flame front moving away from the cylinder head and surrounding flame front, the two major constraints when Plane C is in the proximity of the injector. When x is small, flame front is significantly constrained by cylinder head, since the center point of diesel spray is close to the cylinder head. Same applies to constraint imposed by the adjacent flame fronts. As x increases, the effective flame length continues to increase, until it reaches its maximum value at x = 50 mm, where no constraint is applied to the flame front any more. The flame is at a free propagating state in this situation. As x continue to increase, the effective flame length then starts to decrease due to Plane C entering the hemisphere region of the flame and the radius of the projected flame surface rx starts to decrease.
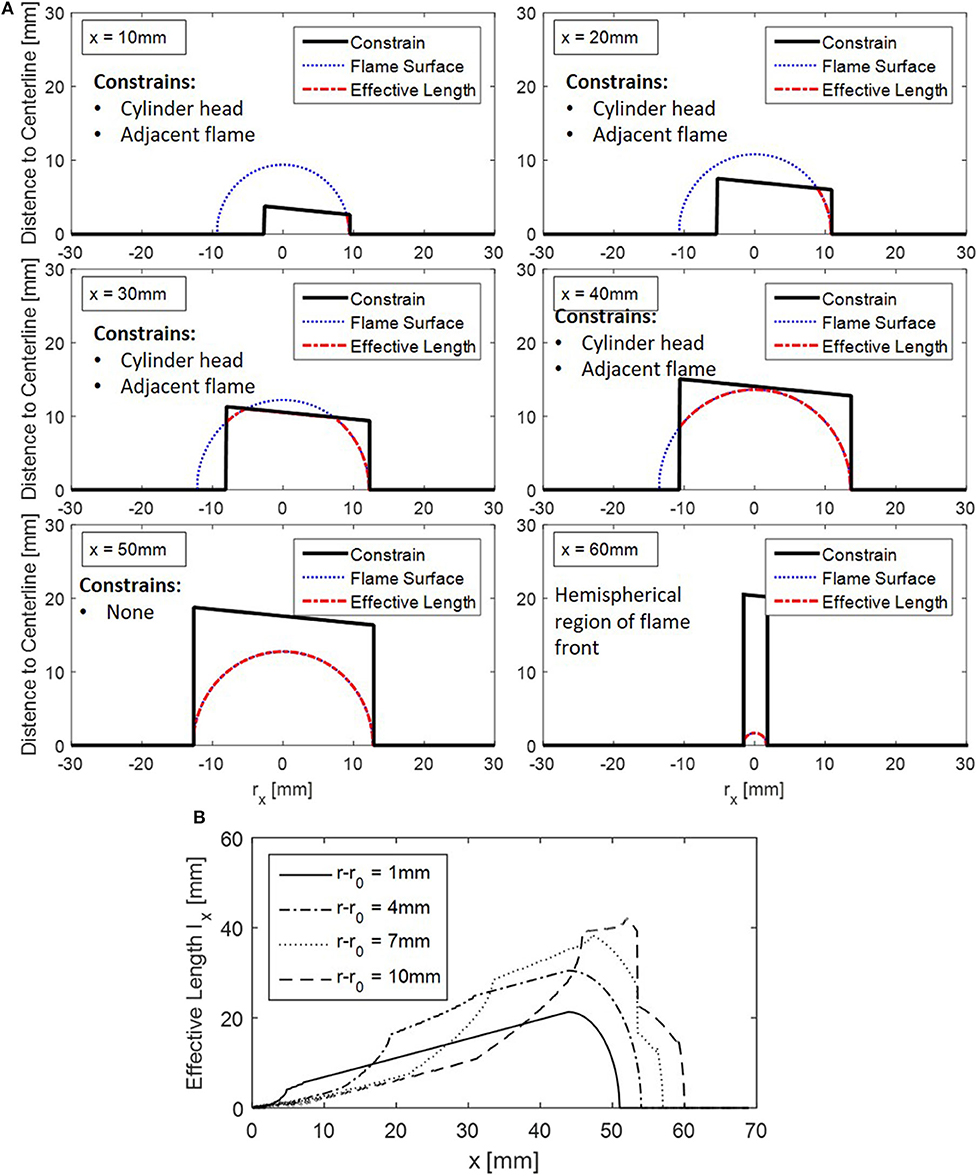
Figure 7. (A) An example of effective flame length calculation. (B) An example of computed effective flame length lx as a function of x and r-r0.
Figure 7B shows an example of computed effective flame length lx as a function of distance between Plane C and injector x and the evolving status of the flame front r − r0. In this condition the piston position is fixed and r − r0 is the only varying parameter. Figure 4C have shown the definition of r−r0. As the flame front evolves into space, the interaction between flame front and constraints including cylinder head, piston and surrounding flame fronts varies and the details are captured by the model.
Once the effective flame surface length lx is evaluated at each Plane C, the total flame surface area A can be obtained by integrating lx along the spray axis:
where xt represents the furthest location of Plane C relative to injector as defined in Equation (48). The ds is represented as a function of the Plane C location x. For conditions when Plane C is in the cone region (x ≤ x0) or hemisphere region (x > x0), ds is represented as:
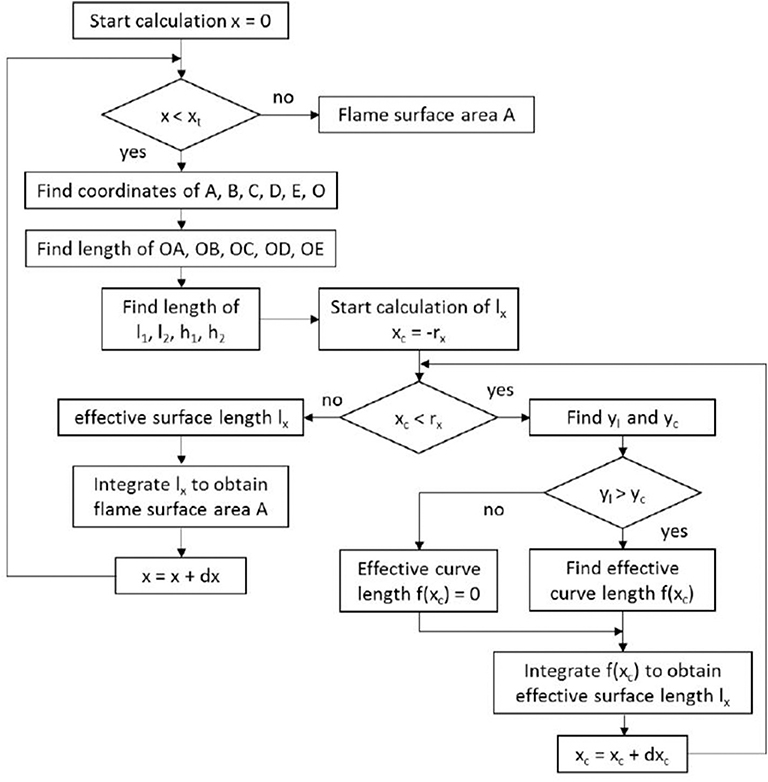
Figure 8 gives a flow chart of the iterative computing process for obtaining the flame front area. Two loops comprise this scheme: main loop and the sub-loop. The main loop updates the integrated flame area A while the sub loop updates the solution of the effective flame surface length lx at each main loop iteration. The main loop starts by assuming that the distance between Plane C and injector x is 0 and ends when Plane C reaches its maximum distance x = xt. Inside the main loop, coordinates of A, B, C, D, E, O defined in Figure 6A are calculated and are used to derive the length of OA, OB, OC, OD, OE. The l1 and l2 defined in Figure 6C are subsequently obtained using Equations (49) and (50). The sub loop starts here by assuming the xc defined in Figure 6C is at its boundary condition xc = −rx and ends when xc reaches another boundary xc = rx. Inside the sub loop, yl and yc defined in Figure 6C are calculated according to Equations (55) and (56). The quantitative relation between yl and yc is evaluated and the discrete segment of effective flame length dlx = f (xc) is determined by Equation (58). The f (xc) is integrated in each iteration of the sub loop and a solution of lx is reached when xc reaches boundary condition xc = rx. The calculation then exits the sub loop and returns to the main loop, where lx is integrated in each iteration of the main loop following Equation (59). The final value of flame surface area A is obtained when Plane C reaches its terminal position x = xt.
Initial formation of NG flame front
The flame front area calculation scheme assumes the flame initiates from the outer boundary of diesel spray, causing a step change of flame surface area at start of NG combustion. However, according to the work of Karim and Liu (1992), the combustion of NG in a dual-fuel engine initiates from multiple ignition sites surrounding the diesel spray. Instead of a step change from 0 to an initial value determined by surface area of spray, the evolving of flame front area at onset of NG combustion should be a continuous process. In this work, a method is proposed to approximate the multi-site ignition of NG-air mixture. The proposed approach assumes that ignition sites distribute evenly around the outer boundary of diesel spray and these sites ignite simultaneously at SOC. Upon ignition, individual flame fronts start to form at each site and propagate freely into the space. The flame is not allowed to travel into the diesel spray thus the flame fronts are approximated as hemispheres.
Figure 9A shows the geometrical assumption made at onset of NG combustion. The figure is showing a segment from the surface area of a diesel spray. The dots are representing the ignition sites, distributed evenly in the surface. The circle around each ignition site represents the flame front evolved from the original kernel. The radius of the hemispherical flame front is defined as r while the distance between adjacent ignition sites is defined as d. The spacing variable d is arbitrarily determined by the user. The scale of this parameter determines the slope of initial heat release after NG has been ignited. In this work, d of 5 mm yields a good agreement with the experimental heat release, and that is generally the simplest way to calibrate it. Insight from optical diagnostics work would be another possibility. The process of the flame growth during the initial stage of NG combustion is divided into three phases: free evolving, interacting and merging. The free evolving phase includes the flame propagation from the ignition site (r = 0) to the point where flame fronts start to interact with each other (r = d/2). The flame propagation then enters the interaction stage as flame fronts start interacting and partially merging with surrounding flames. When the individual flame propagates all the way to the ignition site of the adjacent flame (r = d), it is assumed that the elemental flame fronts have merged into a uniform flame front and the calculation switches according to the scheme discussed in previous sections.
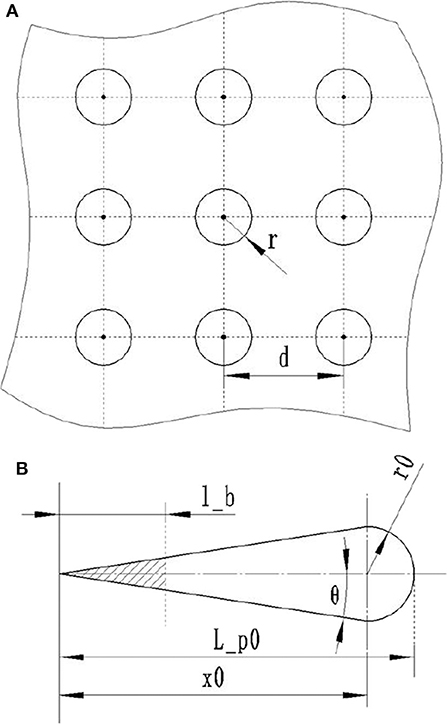
Figure 9. (A) Geometrical assumptions made at initial stage of NG combustion. (B) A 2-D illustration of the approximated diesel spray form at SOC.
To obtain a numerical solution of total flame front area, the surface area of igniting diesel spray needs to be known. Figure 9B gives a 2-D illustration of approximated diesel spray at SOC. Since diesel spray travels a certain distance before it breaks up into droplets, the entire surface area shown in this figure does not contribute to the ignition of the surrounding NG. Rather, it is assumed that the shaded area in this figure does not produce ignition sites.
In the geometry defined in Figure 9B, the diesel spray breakup length lb can be obtained from Equation (3) by setting t = tb. The definition of other parameters is the same as defined in Figure 4C. The igniting diesel spray surface area is arrived as:
Based on the assumption that the NG ignition sites distribute evenly along the diesel spray igniting surface, the number of ignition sites from a diesel spray is approximated as:
The surface area of each flame front initiated from individual ignition site A0 can be determined as a non-continuous functions of flame radius r:
The total flame surface area during the initial stage of NG combustion can be obtained as:
Once the flame radius of individual flame front r reaches the merging point r = d, it is assumed that all individual flames merge as a uniform flame front and the calculation of flame front area follows the iterative scheme given in Figure 8.
Thermodynamics Model
The thermodynamic model updates the temperature, pressure, composition and gas properties of in each packet. Mass is only allowed to transfer from ambient to packet zone and heat transfer is not allowed in both directions. The in-cylinder pressure is uniform across the combustion chamber space, but obviously varies with crank-angle.
Equation (65) gives the ODE for updating cylinder pressure. Instead of being a constant, the heat capacity ratio γ is constantly updated as a function of gas composition and temperature.
The is total heat input, calculated from the difference between the heat release from combustion and heat transfer loss :
The heat transfer to the wall is estimated using bulk in-cylinder temperature. Here convective heat transfer is the only form of heat transfer considered. Radiative heat transfer is excluded due to dual-fuel combustion's low production of soot. convective heat transfer rate is estimated based on Woschni correlation (Woschni, 1967), as represented in Equation (67). Awall represents the area of wall available for heat transfer, including cylinder head, piston top and cylinder liner surfaces in contact with the gas. Twall represents wall temperature, T represents bulk gas temperature and hc is Woschni convective transfer coefficient. The assumed wall temperatures for the cylinder liner, piston top and cylinder head are 400K, 550K, and 550k, respectively.
The Woschni convective heat transfer coefficient hc is given in Equation (68), where T represents bulk gas temperature, P represents cylinder pressure, and w is characteristic velocity. Equation (69) gives definition of characteristic velocity w, where C1, C2 are constants, Sp represents mean piston velocity Pr, Tr, Vr represents reference cylinder pressure, temperature and volume at IVC and Pm represents motored cylinder pressure. For compression stroke, C1 = 2.28 and C2 = 0, for combustion and expansion, C1 = 2.28 and .
Accuracy of gas temperature estimation is essential to the model. The temperature serves as input of various sub-models including ignition delay model, evaporation model, and temperature dependent emission models. The temperature estimation scheme used in this work is based on the formulation of the Conservation of Energy equation that relies on the energy derivatives expressed in terms of enthalpy and its partial derivatives proposed by Assanis and Heywood (1986). Therefore, the ordinary differential equation for temperature is:
where:
In the above two equations, m represents the mass in the control volume. When Equation (70) is solved to calculate bulk cylinder temperature during compression and combustion, m is a constant as no mass transfer occurs when intake and exhaust valves are shut. When using this equation to estimate the temperature in a packet, mass transfer will need to be taken in to account. In Equation (70), V represents control volume, h represents specific enthalpy of gas in the control volume, ϕ represents equivalence ratio, represents total enthalpy transfer rate and represents heat transfer rate into the control volume.
Gas Composition and Property
To achieve an accurate thermodynamics model, a sub-model for updating gas property is also included in this work. This model tracks and updates intake gas species, fuel composition and burned gas composition. The gas species being tracked are O2, N2, CO2, H2O and diesel fuel vapor. The initial gas composition and fuel-oxygen reactions are used to track the concentration of O2, CO2 and H2O. Equations (72) and (73) gives representation of gas property for O2, N2, CO2, H2O. The constants α1 to α6 are given in the NASA reference (Gordon and McBride, 1976).
For diesel vapor and NG, the gas properties are calculated based on Heywood (1988):
where to are coefficients for diesel vapor. Specific heat capacity cp is in unit of J · kg−1K−1; specific enthalpy h is in J/kg and specific gas constant R is in J · kg−1K−1. The specific gas constant R is derived from compositions in the control volume and heat capacity ratio γ is calculated as a function of R and cp:
Substituting the Equations (72–75) into Equation (71), Equation (71) leads to:
Finally, substituting Equation (77) into Equation (70) enables expressing the temperature of the control volume in the form given in Equation (78), where γ, h and hj are derived from the gas property model discussed above.
Experimental Setup
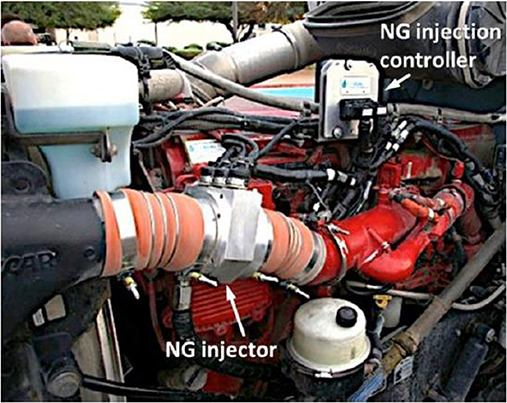
The inline-six dual-fuel engine was mounted in the class 8 HD truck and the experimental investigation has been conducted on a chassis dynamometer. The baseline was established with the standard Cummins ISX 550 diesel engine. The engine was subsequently equipped with a prototype NG port fuel injection system to achieve dual-fuel operation. The NG fumigator in located downstream the compressor and upstream of the manifold, as shown in Figure 10. To meet NG flow requirement, three Clean Air Power NGV solenoids with injection pressure rated at 125 psi were installed on a custom designed manifold. Engine specifications and composition of NG used in the experiment are given in Table 1.
Regarding the direct injection of diesel, an overhead camshaft actuates an injector rocker that pushes injector plunger to generate high pressure, and an Integrated Fuel System Module controls the process. The diesel injectors used in the experimental engine are 9-hole unit-injectors with 0.186 mm nozzle holes and maximum injection pressure of 2,200 bar. The injection pressure is a function of engine speed. In case of dual-fuel operation, the proprietary prototype system intercepts the signal from the control unit and alters the fuel metering according to the desired NG substitution rate.
Knock resistant GH15DK piezoelectric pressure transducers were installed in cylinders 5 and 6. MICROIFEM piezoelectric amplifiers was used within AVL IndiSmart data acquisition to amplify cylinder pressure signals. Additional signals were sampled by National Instruments CompactDAQ with 9205 and 9213 series modules. AVL KMA Mobile was used to measure diesel fuel flow, while FOX FT2 inline flowmeters were used to measure NG flow and air flow. A PicoTurn rotational speed sensor was used to measure turbo shaft speed. For comprehensive data acquisition, manifold pressure sensor, air temperature sensor and oxygen sensors, were also mounted on the engine. Fuel quantity in the timing chamber as well as in the injection chamber were quantified by voltages sent from Electronic Control Unit to injection solenoids.
Engine speed load sweeps for both diesel only (i.e., baseline) and duel fuel modes were conducted on a chassis dynamometer by controlling the road-load and keeping the transmission in pre-selected gear. The SOI information were difficult to obtain through otherwise commonly used hall-effect sensor, due to the peculiarities of the unit-injector design. Instead, a method based on heat release analysis was developed to extract SOI information. Smoothing of the rate of heat release profile is achieved using FFT method. The point where the downward slope originates is considered to be SOI (Xu et al., 2017b). Finally, measured cylinder pressure data was processed to derive apparent heat release rate (AHRR) using the expression given in Equation (79) (Heywood, 1988):
Derivation of Diesel Fuel Injection Profile
Due to limited access to measurement of injection pressure and injection rate, a simplified correlation is developed in this work to generate fuel injection rate information as model input. To describe the profile of fuel injection rate, an injection rate shaping array As is introduced as a governing parameter. The shaping array As defines the history of injection rate during the injection event. An assumption is made that As remains constant for all injection conditions. With inclusion of shaping array As, the injection rate can be expressed as:
where minj is total injected diesel mass and Δt is a time constant determined by the injection duration. A symmetric injection profile with gradual increase and decrease of injection rate at the beginning and ending stages of injection is used to approximate the injection characteristics of a unit injector. Figure 11A provides an example of approximated injection rate. As is fixed as constant for all cases while injected mass and injection duration is varying. For a given As, when injected mass and injection duration are known, a complete profile of fuel injection rate can be obtained.
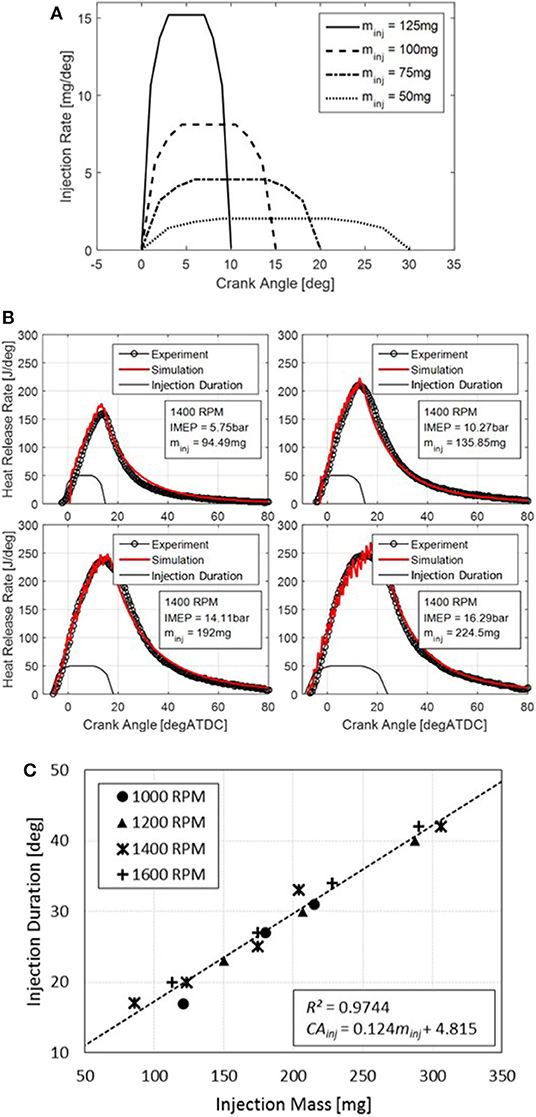
Figure 11. (A) An example of the approximated injection rate model with fixed shaping array and varying injection quantity and duration. (B) Derivation of EOI by matching the experimentally derived heat release profiles using the diesel only combustion model. (C) Linear regression between diesel injection duration and injected mass.
In the experiment setup used in this work, the total injected mass minj is known while injection duration is unknown. However, a correlation between injected mass and injection duration in crank angle can be obtained. The injection duration is derived from injected mass and a full profile of fuel injection rate by applying Equation (80). The experimental data of diesel only operations is used to develop this correlation. To obtain a consistent detection of end of injection (EOI), the Quasi-D combustion model for diesel only condition is used to infer the injection duration. The performance of the Quasi-D diesel combustion model has been validated in previous work (Xu et al., 2017b). For each operating condition, an initial guess of EOI corresponds to peak heat release rate derived from cylinder pressure data. The EOI is subsequently manually tuned to arrive a best fitting of the heat release profile.
Figure 11B gives an example for the derivation of EOI at 1,400 rpm. Four engine load conditions are used where injected fuel mass per cycle varied from 95 to 225 mg. Good agreements between model predictions and experimentally derived heat release rates are achieved.
The same method was applied to other engine speeds. A correlation between injection duration and injected mass is subsequently derived through linear regression. Figure 11C shows the correlation for injection duration as a function of injected mass. A clear linear relationship was observed with R2 = 0.974. Therefore, correlation between injection duration in crank angle degree CAinj and injected mass minj shown in Equation (85) can be used with confidence across a wide operating range:
where CAinj is in deg and minj is in mg. Once the injected mass per cycle is known, the injection duration can be obtained from this correlation, and a full profile of mass injection rate can be estimated as well. This approach also applies for dual-fuel operation conditions.
Results
Model Validation With Experimental Data
The dual-fuel simulation's initial parameters:
• Number of packets in X direction: 20
• Number of packets in Y direction: 5
• Mass fraction of residuals in the unburned zone: 0
• Distance between neighboring ignition sites: 5 mm
• Step size: 0.5 deg CA
The major calibration parameters of this Quasi-D combustion model are (1) Distance between neighboring ignition sites d, (2) Air entrainment rate, and (3) Turbulence intensity expressions.
The Quasi-D combustion model is validated with experimental data for both diesel-only and dual-fuel conditions. At diesel only condition, the model inputs associated with NG are set to zero and only the diesel spray-combustion model is activated. Figure 12 gives the validation results of diesel only operation conditions where heat release and cylinder pressure are used for validation. Two engine speeds and four load conditions are tested. It is shown that the model agrees well with experimental data at various engine operating conditions. Though at higher loads the model is losing some details of heat release rate around its peak, the cylinder pressure prediction still agrees well with experimental data. It is observed that the predicted heat release profile is showing slight oscillations. This is due to the limited number of packets used in the simulation that leads to discrete “steps” when calculating cumulative heat release. A “smoother” predicted heat release profile can be achieved by increasing the number of packets used in the simulation. However, this would bring the cost of elevated computational power.
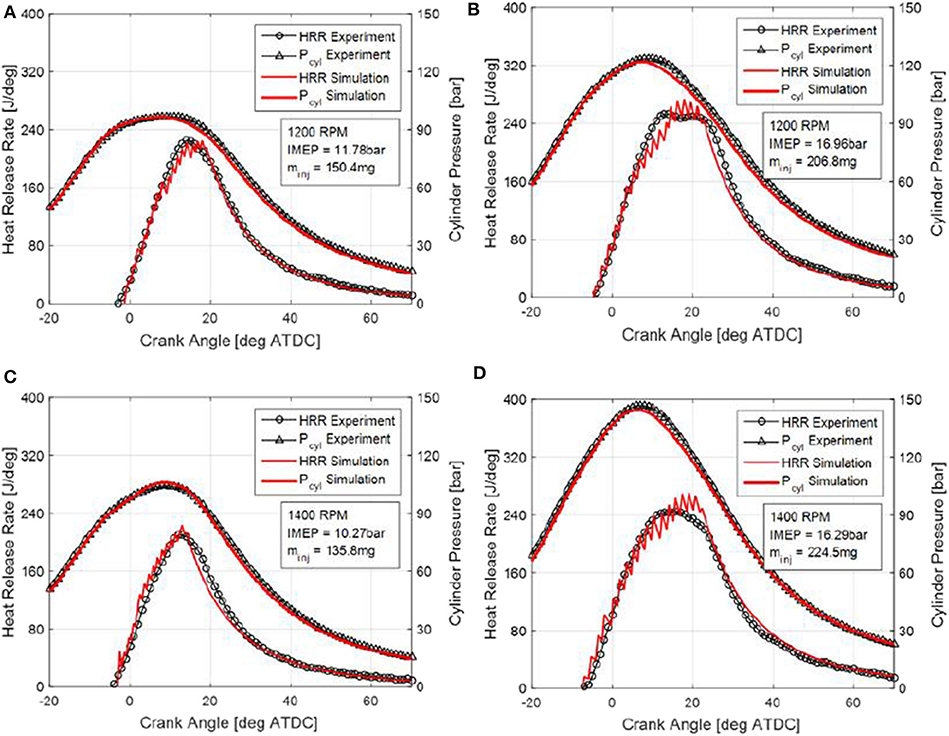
Figure 12. (A–D) Validation results of heat release profile and cylinder pressure at diesel only operation conditions.
Figure 13 shows the validation results for dual-fuel operating conditions. Two examples are given where engine speeds are both 1,200 rpm but engine load and NG substitution ratio is different. The percentages of NG in energy content are 65.6 and 31.8%, respectively. Figures 13A,B show the comparison between predicted and experimentally obtained cylinder pressure and heat release rate, while Figures 13C,D show the predicted heat release rates contributed from the diesel and NG, respectively. The injection rate profile derived from the correlation developed in the previous section is also shown as reference. Although the heat release profile of these two operating conditions are alike, the contributions from combustion of NG and diesel fuel are quite different because the substitution rate in the case A-B was 65.6%, and for C-D 31.8%. It is shown in Figures 13C,D that the proposed diesel injection duration correlation generates reasonable injection profiles under dual-fuel conditions. The turbulent flame propagation model and diesel spray combustion model work simultaneously to output the energy released by both fuels. Overall, the newly developed dual-fuel model agrees very well with experimental data in terms of both heat release rate and cylinder pressure.
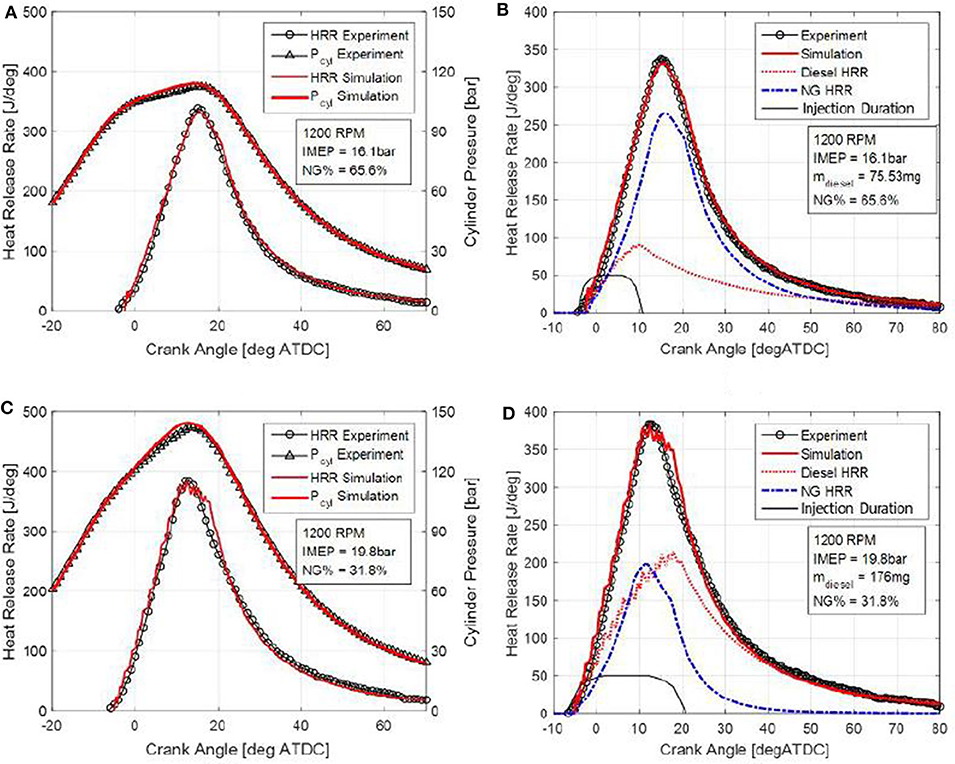
Figure 13. (A–D) Validation results of heat release profile and cylinder pressure at dual-fuel operation conditions.
Figure 14A shows the prediction of NG flame front surface area of the same engine operation conditions shown in Figure 13. The flame surface area Aflame and traveled distance Rflame are normalized with the Bore2 and Bore, respectively. The traveled distance Rflame is the same as r − r0 in the geometry illustrated in Figure 4C. It is shown that the flame front surface area model captures the details of the flame evolving history in its initiation, free-evolving and constraint cut-off stages. The difference between the two operating conditions is mainly due to the penetration depth of the diesel spray at SOC. For the higher load case (IMEP = 19.8 bar), the ignition delay is shorter, resulting a shorter penetration, hence a smaller surface area to initiate the combustion of NG-air mixture. In the early free-evolving stage, the normalized flame surface area of the higher load case is lower. However, normalized travel distance Rflame when the flame is quenched by the constraints is higher, as expected, since the diesel spray penetration at the initial condition is shorter.
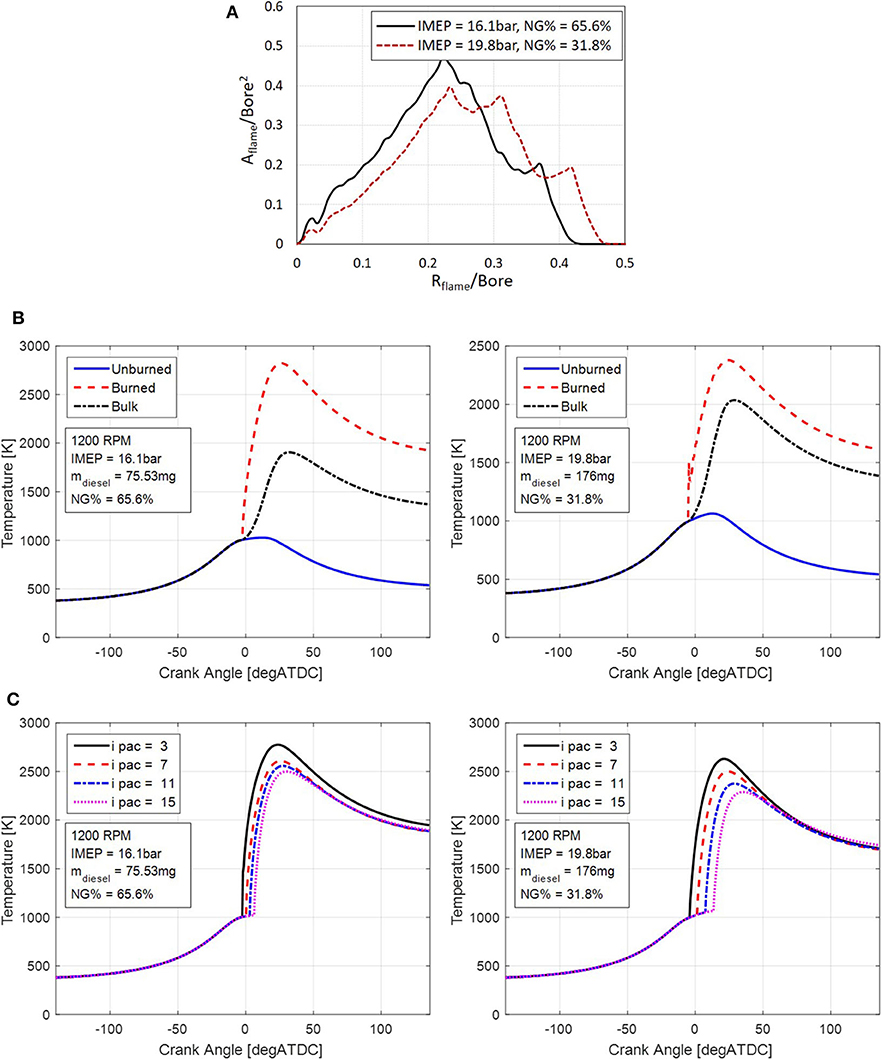
Figure 14. (A) Model prediction results of NG flame front surface area. (B) Model prediction results of in-cylinder temperatures of unburned, burned and bulk gas temperatures. (C) Model prediction results of in-cylinder temperatures in individual diesel spray packets.
Figure 14B shows model prediction of in-cylinder temperatures, including the unburned, burned and bulk gas temperatures. The unburned gas zone includes the gas that is not involved in the combustion while the burned gas temperature is the average temperature of the burned gas generated by the combustion of both diesel and NG. Figure 14C show the temperature predictions as a function of Crank Angle degrees for different packets. The ipac in the legend denotes the index of packet on the x axis originating at the injector tip as defined in Figure 1. The smaller ipac implies an earlier injection of the packet. The temperature histories demonstrate a phase lag and differences in peak values, therefore confirming the ability of the model to capture the temperature distribution within the spray. This in turn enables spatial resolution of the temperature distribution within spray, as well as prediction of emissions that would not otherwise be possible with the single burned zone models. In summary, model predictions shown in Figure 14 provide valuable insights into dual-fuel combustion that would otherwise be very difficult to obtain experimentally.
Discussion
In this work, a Quasi-D multi-zone dual-fuel combustion model is developed and validated with the experimental data obtained through testing of the modified Heavy Duty in-line six engine. The modeling approach is a combination of turbulent flame entrainment modeling and multi-zonal diesel spray-combustion modeling. Two combustion models run concurrently to provide a prediction of the heat-release and the pressure in the cylinder, as well as detailed insights into individual aspects of the dual-fuel combustion process. The modeling approach and the analysis of results are focused on the closed cycle, i.e., the crank angle range from IVC to EVO. The diesel spray-combustion model is activated after the Start of Injection. After the ignition delay period, the ignition of diesel triggers both diesel and NG combustion models.
The diesel combustion model is based on the multi-zonal framework which divides the spray into multiple packets. Each packet tracks the air and NG entrainment, fuel evaporation and reactions between both fuels and oxygen. The correlations in the model for a spray break-up time is modified to capture the features of modern diesel engines with high injection pressure systems. The NG combustion model relies the turbulent flame propagation modeling approach widely used in SI engines. However, a new method for modeling the flame front area of the burning NG-air charge was needed. The flame is assumed to initiate from the outer boundary of diesel spray and then propagate into the space outward from the spray until eventually starting to interacts with constraints imposed by the combustion chamber walls, the piston top, or the adjacent sprays. The shape of the flame front is represented with a cone and a hemispherical head surface. The proposed flame surface area algorithm solves the flame area in each main iteration of the combustion model and incorporates geometrical information of all constraints. Therefore, it has universal applicability for various piston bowl or cylinder head designs.
Due to limited access to injector diagnostics, a correlation is developed to generate diesel injection rate profile. A linear correlation was found between injected mass and injection duration with diesel only operation. The correlation is subsequently used for dual-fuel operation too.
The dual-fuel combustion model is validated with experimental data for both diesel only and dual-fuel operations. The model displays very good agreement with experimentally obtained heat release and cylinder pressure at various operating conditions. The model also generates valuable information that would otherwise be difficult to obtain experimentally, such as in-cylinder temperature of the unburned charge and burned gas, individual heat release rates from each of the fuels, flame area history, as well as histories of temperatures and composition of each of the packets. The latter enables valuable information for studies of temperature-dependent emissions.
This article includes a very detailed description of a Quasi-D dual-fuel combustion modeling algorithm, as well as equations comprising each of the combustion processes. Geometric modeling and tracking the flame front, correlations for determining injection rate and duration are discussed as well. Therefore, the modeling approach can easily be replicated by other researchers. By varying the number of packets and calculation time step, a balance between computing power requirement and model fidelity can be reached based on the simulation goal. The model can accelerate the calibration of the dual-fuel engine control, or the development process of the combustion system itself, e.g., investigations of the optimal substitution rates, fuel injection timings, knock limits etc.
Data Availability Statement
The datasets generated for this study are available on request to the corresponding author.
Author Contributions
ZF contributed to the concept. SX contributed to the bulk of the work, including modeling, simulation, and data analysis. All authors contributed to manuscript revision and approved the submitted version.
Conflict of Interest
The authors declare that the research was conducted in the absence of any commercial or financial relationships that could be construed as a potential conflict of interest.
Acknowledgments
The authors wish to gratefully acknowledge Prof. Keiya Nishida from Hiroshima University for providing the original version of the multi-zonal code and valuable guidance regarding its refinement published in Xu et al. (2017b).
References
Abd Alla, G. H., Soliman, H. A., Badr, O. A., and Abd Rabbo, M. F. (2000). “Using of quasi-two zone combustion model to predict the performance of a dual fuel engine,” SAE Technical Papers.
Assanis, D. N., and Heywood, J. B. (1986). Development and use of a computer simulation of the turbocompounded diesel system for engine performance and component heat transfer studies. SAE Trans. 95, 451–476. doi: 10.4271/860329
Assanis, D. N., Zoran, S. F., Fiveland, S. B., and Michalis, S. (2003). A predictive ignition delay correlation under steady-state and transient operation of a direct injection diesel engine. J. Eng. Gas Turbines Power 125, 450–457. doi: 10.1115/1.1563238
Dec, J. E. (1997). A Conceptual Model of DL Diesel Combustion Based on Laser-Sheet Imaging. SAE Transactions, 1319–1348.
Gordon, S., and McBride, B. J. (1976). Computer Program for Calculation of Complex Chemical Equilibrium Compositions, Rocket Performance, Incident and Reflected Shocks, and Chapman-Jouguet Detonations, Vol. 273. Scientific and Technical Information Office National Aeronautics and Space Administration.
Halstead, M. P., Kirsch, L. J., and Quinn, C. P. (1977). The autoignition of hydrocarbon fuels at high temperatures and pressures—fitting of a mathematical model. Combust. Flame 30, 45–60. doi: 10.1016/0010-2180(77)90050-5
Hernandez, J. J., Magin, L., Clara, S., and Andres, M. (2005). Estimation of the laminar flame speed of producer gas from biomass gasification. Energy Fuels 19, 2172–2178. doi: 10.1021/ef058002y
Heywood, J. B. (1988). Internal Combustion Engine Fundamentals, Vol. 930. New York, NY: Mcgraw-hill.
Hiroyasu, H. (1980). Fuel spray penetration and spray angle in diesel engines. Trans. JSME 44, 3208–3220.
Hiroyasu, H., and Kadota, T. (1976). Models for combustion and formation of nitric oxide and soot in direct injection diesel engines. SAE Trans. 85, 513–526. doi: 10.4271/760129
Hiroyasu, H., Masataka, A., and Michihiko, T. (1989). Empirical Equations for the Sauter Mean Diameter of a Diesel Spray. SAE Transactions, 868–877.
Johnson, S. L., Clarke, A., Fletcher, T., and Hylands, D. (2012). “A phenomenological approach to dual fuel combustion modelling,” in: ASME 2012 Internal Combustion Engine Division Fall Technical Conference (Vancouver, BC: American Society of Mechanical Engineers Digital Collection), 781–791.
Kadota, T., and Hiroyasu, H. (1976). Evaporation of a single droplet at elevated pressures and temperatures: 2nd report, theoretical study. Bull. JSME 19, 1515–1521. doi: 10.1299/jsme1958.19.1515
Kadota, T., Hiroyasu, H., and Hideo, O. Y. A. (1976). Spontaneous ignition delay of a fuel droplet in high pressure and high temperature gaseous environments. Bull. JSME 19, 437–445. doi: 10.1299/jsme1958.19.437
Karim, G. A. (1987). “The dual fuel engine,” in Automotive Engine Alternatives (Boston, MA: Springer), 83–104.
Karim, G. A. (2003). Combustion in gas fueled compression: ignition engines of the dual fuel type. ASME J. Eng. Gas Turbines Power 125, 827–836. doi: 10.1115/1.1581894
Karim, G. A., and Khan, M. O. (1968). Examination of effective rates of combustion heat release in a dual-fuel engine. J. Mech. Eng. Sci. 10, 13–23.
Karim, G. A., Klat, S. R., and Moore, N. P. W. (1966). Knock in dual-fuel engines. Proc. Inst. Mech. Eng. 181, 453–466.
Karim, G. A., and Liu, Z. (1992). “A predictive model for knock in dual fuel engines,” in Future Transportation Technology Conference & Exposition.
Kobori, S., Kamimoto, T., and Aradi, A. A. (2000). A study of ignition delay of diesel fuel sprays. Int. J. Eng. Res. 1, 29–39. doi: 10.1243/1468087001545245
Korakianitis, T., Namasivayam, A. M., and Crookes, R. J. (2011). Natural-gas fueled spark-ignition (SI) and compression-ignition (CI) engine performance and emissions. Prog. Energy Combust. Sci. 37, 89–112. doi: 10.1016/j.pecs.2010.04.002
Krishnan, S. R., Biruduganti, M., Mo, Y., Bell, S. R., Midkiff, K. C., Gong, W., et al. (2002). Performance and heat release analysis of a pilot-ignited natural gas engine. Int. J. Eng. Res. 3, 171–184. doi: 10.1243/14680870260189280
Krishnan, S. R., and Srinivasan, K. K. (2010). Multi-zone modelling of partially premixed low-temperature combustion in pilot-ignited natural-gas engines. Proc. Inst. Mech. Eng. Part D J. Auto. Eng. 224, 1597–1622. doi: 10.1243/09544070JAUTO1472
Krishnan, S. R., Srinivasan, K. K., and Midkiff, K. C. (2009). “Ignition in pilot-ignited natural gas low temperature combustion: multi-zone modeling and experimental results,” in ASME 2009 Internal Combustion Engine Division Spring Technical Conference (Milwaukee, WI: American Society of Mechanical Engineers Digital Collection), 625–634.
Krishnan, S. R., Srinivasan, K. K., Singh, S., Bell, S. R., Midkiff, K. C., Gong, W., et al. (2004). Strategies for reduced Nox emissions in pilot-ignited natural gas engines. J. Eng. Gas Turbines Power 126, 665–671. doi: 10.1115/1.1760530
Liu, Z., and Karim, G. A. (1997). Simulation of combustion processes in gas-fuelled diesel engines. Proc. Inst. Mech. Eng. Part A J. Power Energy 211, 159–169. doi: 10.1243/0957650971537079
Liu, Z., and Karim, G. A. (1998). An examination of the ignition delay period in gas-fueled diesel engines. J. Eng. Gas. Turbines Power 120, 225–231. doi: 10.1115/1.2818080
Papagiannakis, R. G., Hountalas, D. T., and Kotsiopoulos, P. N. (2005). “Experimental and theoretical analysis of the combustion and pollutants formation mechanisms in dual fuel DI diesel engines,” SAE Technical Paper (Detroit, MI).
Papagiannakis, R. G., Hountalas, D. T., and Rakopoulos, C. D. (2007). Theoretical study of the effects of pilot fuel quantity and its injection timing on the performance and emissions of a dual fuel diesel engine. Energy Convers. Manage. 48, 2951–2961. doi: 10.1016/j.enconman.2007.07.003
Poulos, S. G., and Heywood, J. B. (1983). The effect of chamber geometry on spark-ignition engine combustion. SAE Trans. 92, 1106–1129.
Sazhina, E. M., Sazhin, S. S., Heikal, M. R., and Marooney, C. J. (1999). The shell autoignition model: applications to gasoline and diesel fuels. Fuel 78, 389–401. doi: 10.1016/S0016-2361(98)00167-7
Singh, S., Long, L., Song-Charng, K., and Rolf, R. (2006). Development of a flame propagation model for dual-fuel partially premixed compression ignition engines. Int. J. Engine Res. 7, 65–75. doi: 10.1243/146808705X7464
Singh, S., Song-Charng, K., Reitz, R. D., Krishnan, S. R., and Midkiff, K. C. (2004). Modeling and Experiments of Dual-Fuel Engine Combustion and Emissions. SAE Transactions, 124–133.
Srinivasan, K. K., Krishnan, S. R., and Midkiff, K. C. (2006a). Improving low load combustion stability, and emissions in pilot-ignited natural gas engines. Proc. Inst. Mech. Eng. Part D J. Auto. Eng. 220, 229–239. doi: 10.1243/09544070JAUTO104
Srinivasan, K. K., Krishnan, S. R., Sabir, S., Midkiff, K. C., Bell, S. R., Gong, W., et al. (2006b). The advanced injection low pilot ignited natural gas engine: a combustion analysis. J. Eng Gas Turbines Power 128, 213–218. doi: 10.1115/1.1915428
Tabaczynski, R. J., Ferguson, C. R., and Radhakrishnan, K. (1977). A Turbulent Entrainment Model for Spark-Ignition Engine Combustion. SAE Transactions, 2414–2433.
Walther, H. P., Schlatter, S., Wachtmeister, G., and Boulouchos, K. (2012). Combustion models for lean-burn gas engines with pilot injection. MTZ Worldwide 73, 56–63. doi: 10.1365/s38313-012-0144-3
Watson, N., Pilley, A. D., and Marzouk, M. (1980). “A combustion correlation for diesel engine simulation,” SAE Technical Paper.
Westbrook, C. K., and Dryer, F. L. (1981). Simplified reaction mechanisms for the oxidation of hydrocarbon fuels in flames. Combust. Sci. Technol. 27, 31–43. doi: 10.1080/00102208108946970
Woschni, G. (1967). “A universally applicable equation for the instantaneous heat transfer coefficient in the internal combustion engine,” National Fuels and Lubricants, Powerplants, Transportation Meetings.
Xu, S., David, A., Amrit, S., Hoffman, M. A., Prucka, R., and Filipi, Z. (2014). Development of a phenomenological dual-fuel natural gas diesel engine simulation and its use for analysis of transient operations. SAE Int. J. Engines 7, 1665–1673. doi: 10.4271/2014-01-2546
Xu, S., David, A., Hoffman, M. A., Prucka, R., and Filipi, Z. (2017a). A phenomenological combustion analysis of a dual-fuel natural-gas diesel engine. Proc. Inst. Mech. Eng. Part D J. Auto. Eng. 231, 66–83. doi: 10.1177/0954407016633337
Xu, S., Yamakawa, H., Nishida, K., and Filipi, Z. (2017b). Quasi-dimensional diesel engine combustion modeling with improved diesel spray tip penetration, ignition delay and heat release, submodels. J. Eng. Gas Turbines Power 139:112802. doi: 10.1115/1.4036575
Zhang, Y., Kong, S.-C., and Reitz, R. (2003). Modeling and Simulation of a Dual Fuel (diesel/natural gas) Engine With Multidimensional CFD. SAE Transactions, 336–347.
Nomenclature
Keywords: dual-fuel, methane, diesel, quasi-D, modeling, combustion
Citation: Xu S and Filipi Z (2020) Quasi-Dimensional Multi-Zone Modeling of Methane-Diesel Dual-Fuel Combustion. Front. Mech. Eng. 6:46. doi: 10.3389/fmech.2020.00046
Received: 04 February 2020; Accepted: 02 June 2020;
Published: 16 July 2020.
Edited by:
Hailin Li, West Virginia University, United StatesReviewed by:
Adam Dempsey, Marquette University, United StatesJohn Nuszkowski, University of North Florida, United States
Jinlong Liu, Purdue University, United States
Copyright © 2020 Xu and Filipi. This is an open-access article distributed under the terms of the Creative Commons Attribution License (CC BY). The use, distribution or reproduction in other forums is permitted, provided the original author(s) and the copyright owner(s) are credited and that the original publication in this journal is cited, in accordance with accepted academic practice. No use, distribution or reproduction is permitted which does not comply with these terms.
*Correspondence: Shuonan Xu, c2h1b25heCYjeDAwMDQwO2NsZW1zb24uZWR1
 Shuonan Xu
 Zoran Filipi