 Mark Peckham
 Jamie Parnell
 Matthew Hammond
 Byron Mason
94% of researchers rate our articles as excellent or good
Learn more about the work of our research integrity team to safeguard the quality of each article we publish.
Find out more
ORIGINAL RESEARCH article
Front. Mech. Eng., 28 April 2020
Sec. Engine and Automotive Engineering
Volume 6 - 2020 | https://doi.org/10.3389/fmech.2020.00019
This article is part of the Research TopicCertification Cycles and Real Driving EmissionsView all 6 articles
Some of the most challenging aspects of preparing vehicles to comply with the new RDE (Real Driving Emissions) legislation are the calibration of engines to minimize emissions during numerous short lived transients. Fast response emissions analyzers are necessary to resolve rapid transient emissions and have been deployed simultaneously in the engine-out and tailpipe exhaust gas stream of several vehicles. The methodology presented and capability of the instrumentation enables fine resolution of emissions events leading to the opportunity for fine tuning of controller performance. Data has also been logged from the vehicles' ECUs and combined with accurate GPS data. The results show that certain road lay-outs (e.g., congested junctions and speed bumps) can provoke significant tailpipe NOx emissions; often emitting very high levels near schools where traffic calming measures have been adopted for road safety. The lean excursions and insufficient rich purge during such transients are generally shown to be the cause of such emitting events.
To date, four Real Driving Emissions Legislation packages have been released. The first package defines the RDE test procedure; the second package the NOx Conformity Factors and the introduction dates; the third package, adds a Particle Number (PN) Conformity Factor and includes cold-start emissions; the fourth package outlines conformity factors and the concept of surveillance, additionally it lowers the error margin of the 2020 NOx Conformity Factor from 0.5 to 0.431. The intent of the legislation is to ensure that the emissions generated under real driving conditions are suitably controlled, the differences between real and on-cycle emissions is well-known2.
The minimum trip duration requirement of RDE is 90 min, much longer than existing standardized cycles. For example the New European Driving Cycle (NEDC) has a cycle duration of 20 min and the Worldwide Harmonized Light Duty Test Cycle (WLTC) has a cycle duration of 30 min. The RDE sequence consists of urban driving following by rural and motorway driving. Unlike existing cycles which have a predefined vehicle speed profile, each RDE test has a unique vehicle speed profile. It is generated as a function of driver behavior, road, traffic and vehicle conditions during the test. Hence, many transient maneuvers will be undertaken, such as: gear change, speed bump, stop for traffic lights, roundabout etc. Many of these engine transients are not included in existing prescribed test cycles.
In terms of the engine, the above will result in much greater coverage of the operating space, increasing the range of boundary conditions experienced and is much more representative of real-world driving. As a consequence of the less steady operation the dynamic behavior of the system contributes significantly to performance.
The primary purpose of the RDE Legislation is to address the well-known discrepancy in emissions between real world driving and that seen on previous, less dynamic, legislative emissions cycles. This represents a significant technology challenge due to the high dimensionality of the design space, the non-linear system under study and the many complex interactions that often occur in modern powertrains.
Since many powertrain controllers are developed based on the assumption that the engine is always in a pseudo steady state, the execution of a transient maneuver e.g., increased torque demand, from the controller's perspective, is a disconnected collection of steady-state operating points. Setpoints are scheduled in the moment with little to no consideration given to how, due to the engine dynamics, adjacent points in time affect performance of the system under control.
Under RDE legislation, particularly as the limits are further reduced, it is becoming more necessary to consider the time dependent behavior of the system in its development and subsequent control. Traditional development processes and consequently control schemes are based on characterization data that is generated via steady-state test and subsequently reveals little about dynamic performance. To this end a new generation of instrumentation is required that enables measurement of higher frequency dynamics to ascertain and investigate the causal relationships between control variables (the parameterization) and the outputs e.g., emissions.
Whilst conventional PEMs analysers come a long way in achieving this they are still not able to provide sufficient temporal resolution for higher frequency engine events ranging at the lower end from interactions with PWM oscillations in fueling to single event misfires, either of which can lead to homologation failure under certain conditions. A range of portable emissions measurement systems (PEMS) have been developed2,3 to provide accurate measurement of tailpipe emissions and simultaneously integrate the volumetric readings of pollutants with the exhaust mass flow as measured by a pitot tube. PEMS are relatively easily attached to candidate vehicles via tailpipe exit and mounting the analyser on the rear of the vehicle. However, the PEMS' own response times coupled with gas transport and mixing through the exhaust system produce emissions data with time constants of the order of a few seconds. The duration of the urban transients are generally much shorter than this (often a fraction of a second) and therefore impossible to resolve. This paper describes a new technique for adapting a set of well-established fast response emissions analysers with millisecond response times (Duckhouse et al., 2018) to on-board use, specifically to identify and correlate real world rapid transients with engine control actuations which can help reveal the causes of emissions events. In addition, the use of two measurement channels allows for simultaneous measurement of both engine-out and tailpipe emissions data for analysis of after treatment effectiveness.
This paper was written with the intention of describing the hardware and the techniques for its use and not a critique of any particular vehicles' emissions characteristics. None of the candidate vehicles discussed are RDE compliant, having been sold before the RDE legislation came into force.
Fast response gas analysers have been available since 1987 and a summary of the fast NOx analyser can be found in4. In its standard form it is a two channel analyser and is typically used for test cell operation to measure engine-out and tailpipe [NO] or [NO and NO2]. The standard format is unsuitable for on-board use because the large and heavy main control unit is also relatively power-hungry; containing two large scroll vacuum pumps. The 10 m conduits connecting the sample heads to the cabinet are also unsuitable for in-vehicle work.
The fast response analysers were made mobile using a compact diaphragm vacuum pump and short (2.5 m) conduits connecting the main control unit to the remote sample heads. This reduced the space requirement and weight of the two channel analyser so that it could easily be placed in a vehicle luggage compartment (as shown in Figure 1) with a mass of approximately 60 kg (similar to a single passenger). Moreover, the main control unit is easily reconfigurable for laboratory use.
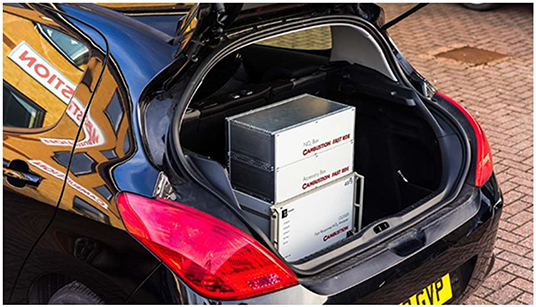
Figure 1. Fast RDE two channel analyser in rear of passenger car.
The compromises made by adopting the smaller pumps meant that sampling pre-turbo was precluded, but this is not a necessity for on-board testing. For measurement of fast NOx, the supply of pure oxygen from a small compressed gas bottle or a (respiratory) oxygen concentrator was required.
All systems were powered from 115 Ah lead acid batteries via a 12VDC to 230VAC inverter yielding at least 1 h of operation from a full charge per battery; two batteries being required for a full RDE test.
The vehicles tested were:
1. A 1.6 L twin-scroll-turbocharged GDI Euro 4 passenger car with close-coupled twin-substrate catalyst (hydrothermally aged to 50,000 km) and a manual 5-speed gearbox. Built in 2008.
2. A 1.6 L turbocharged Euro 6b passenger car diesel with SCR NOx after treatment system and DPF, 1,100 km on odometer, 5-speed manual gearbox. Built in 2015.
3. A 1.8 L PFI naturally aspirated gasoline Euro 6b Plug-in Hybrid Electric Vehicle (PHEV), 300 km on odometer and set to “Normal” driving mode (balanced blending of electric and engine power). Built in 2017.
The results from these are discussed in the same order below.
Exhaust sample probes were fitted to various locations in the exhaust system of each vehicle but always included both engine-out and tailpipe locations. The tailpipe location was upstream of the muffler to prevent unnecessary mixing of the exhaust gas, helping preserve the high frequency emissions information and to aid correlation with ECU measurements.
The fast gas analyser sample heads were positioned in the passenger foot well and the shortest path was adopted between the exhaust sampling point and each sample head. This was achieved by passing the fast analysers' heated sample probes through the steering column blanking plate (for engine-out measurements) and through the foot well drain hole for tailpipe (see Figure 2). Keeping the sample pipes as short as possible also reduced transport delay times to a few milliseconds.
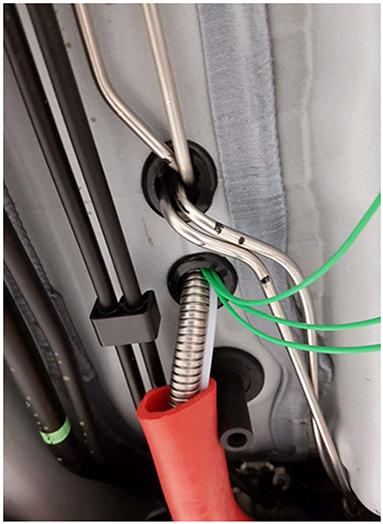
Figure 2. Fast analyser sample probes passing through floor pan.
Engine parameters were logged from the vehicles' OBD port via a National Instruments data logger with a logging frequency of ~10 Hz. This is significantly slower than the transient emissions events, but sufficiently fast to allow interpretation of the emissions events. The analog outputs of the fast gas analysers were logged at 100 Hz in to the same data file. Parameters of interest which were available include normalized air-fuel ratio i.e., lambda, engine speed, vehicle speed, torque, normalized air charge i.e., load, inlet manifold pressure and exhaust mass flow.
A dedicated Lab view software was written for data logging in-vehicle which allowed the passenger to view a live read-out of their choice of ECU parameters alongside the emissions data. In addition, where exhaust mass flow could be logged this was combined in real time with the emissions data to produce an estimate of fast, cumulative mass.
Vehicle position data was recorded via a low profile rooftop antenna with a Real Time Kinematics (RTK) GPS system which allowed for ~2 cm positional accuracy. With post-processing, the fast response emissions measurement combined with this GPS positional accuracy yielded a resolution of 14cm in space at 40kph. GPS position data was also recorded to the same file as the ECU and fast emissions data. This allowed further cross-correlation of events.
A dashboard front-facing portable camera was used to record the traffic conditions and also the engine sound. The video file was recorded to the dashcam's local SD card and was therefore a separate (large) file. When the video was combined with the other data, the sound of the engine start was used as a convenient time-alignment indicator.
All vehicles were tested on an RDE route which was devised within the environs of Cambridge, UK (Figure 3).
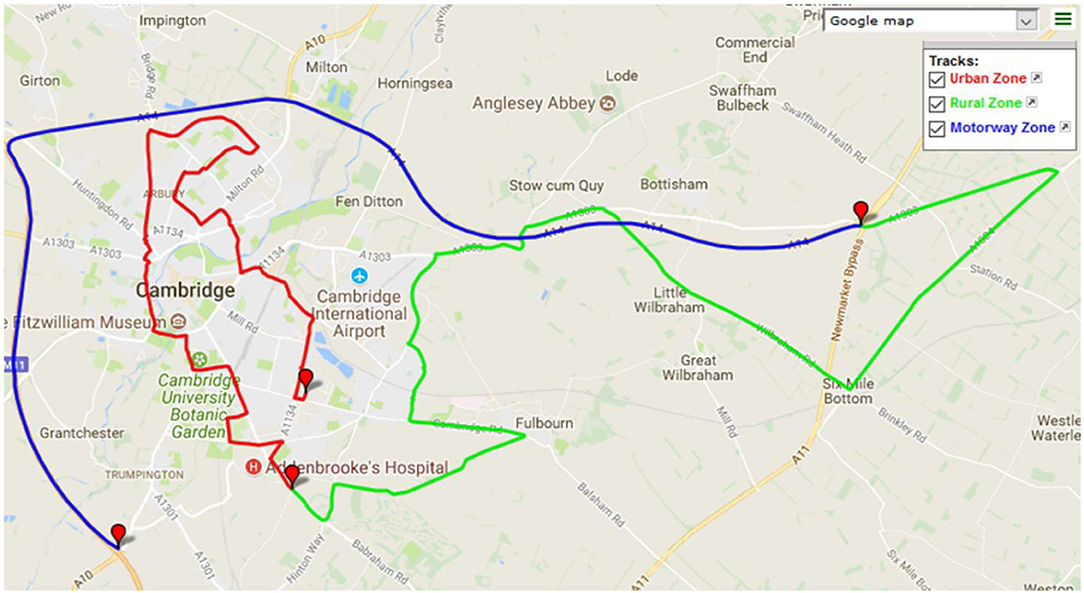
Figure 3. Cambridge RDE route summary.
Additionally, a route around London (see Figure 12) was provided by Transport for London (TfL) and was designed to coincide with an array of roadside air quality monitoring stations. This was part of an attempt to identify the location of urban NOx “hot spots.”
Python was used to develop tools for auto-identification of tailpipe emissions events (with thresholds set by the user) and results plotting. The plots incorporated 5 s leading up to the event and 5 s afterwards to provide some context. The use of positional information from GPS and dashcam footage provided further information.
The combination of ECU, GPS and emissions data within a single data file need not require any delay correction because the close association of all events with only millisecond delays on the emissions data enables easy correlation of parameters.
For brevity, only the NOx emissions data is discussed in this section, for information on fast CO, CO2, and HC the reader may refer to Irwin et al. (2018).
Combustion with air forms nitrogen monoxide (NO), nitrogen dioxide (NO2) and very small amounts of nitrous oxide (N2O), these are collectively referred to as oxides of nitrogen (NOx). The main component that is formed within the high temperatures of combustion is NO.
The specifics of NOx generation are outlined in Heywood (1988) but the principle reactions are shown in Equations 1–3.
NO emissions form in both the flame front and post flame gases, the amount tends to increase when there is a larger diffusion flame (Heywood, 1988). The rate of NOx formation depends on combustion conditions particularly favoring the higher temperatures associated with lean combustion.
Data was recorded from a GDI 1 L gasoline passenger car on a rolling road at Mahle Powertrain's UK facility which contains PEMS and fast response CLD equipment in an attempt to illustrate the improved definition available from fast response equipment.
The PEMS was sampling from its usual tailpipe location (post-muffler) and alongside a conventional emissions bench from the dilution tunnel plus an FTIR system. The tailpipe fast CLD was positioned immediately post-catalyst (therefore avoiding unnecessary mixing within the muffler).
During a “condensed RDE” drive the tailpipe NOx data could easily be compared with the transient operation during gear changes and other rapid changes of speed and load as shown in the data in Figure 4.
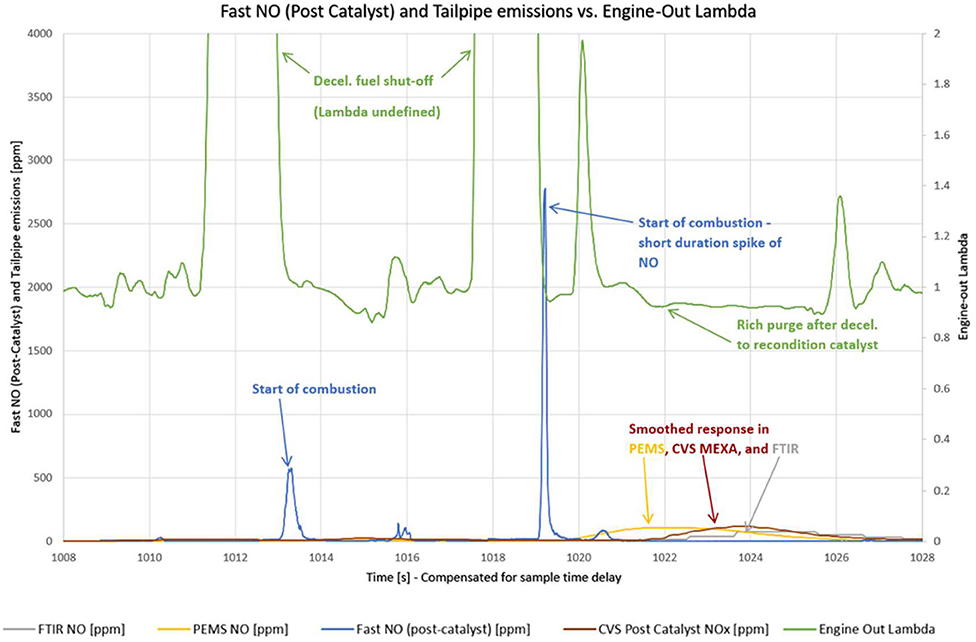
Figure 4. Comparison of fast RDE tailpipe NO with other conventional tailpipe emissions measurements.
The main event of interest is the engine restart following a decelleration fuel shut-off at 1019s where the engine produces a short spike of NO which is measured immediately by the fast RDE analyser and easily associated with the engine-out lambda signal. An engine restart like this can typically produce a spike of tailpipe NO because the engine-out NO is very high (the motoring phase having purged out any residual gas) and the catalyst has been filled with oxygen. Typically, emissions calibrators will choose to restart with a short-duration “rich purge” to recondition the catalyst for further NOx reduction.
Note that the PEMS, CVS tunnel and FTIR analyzers all measure this event, but their signals are smeared over a time period of ~5 s making it difficult to correlate with a particular engine event.
The data presented below is taken from the urban part of the Cambridge RDE route shown in Figure 3.
Engine-out and tailpipe NOx levels are similar at cold start and pull-away with a noticeable delay of the tailpipe measurements compared with the engine-out measurements caused by transport delay through the close-coupled three-way catalyst (this level of detail shown in the 30 s period in Figure 5). The engine's own lambda sensor is inactive for the first ~14 s; it has to heat up before closed-loop lambda control is possible, but from previous NEDC-based studies of this vehicle (Peckham et al., 2011), it is assumed that a similar catalyst heating strategy with double-pulse fuel injection and spark retard was being employed.
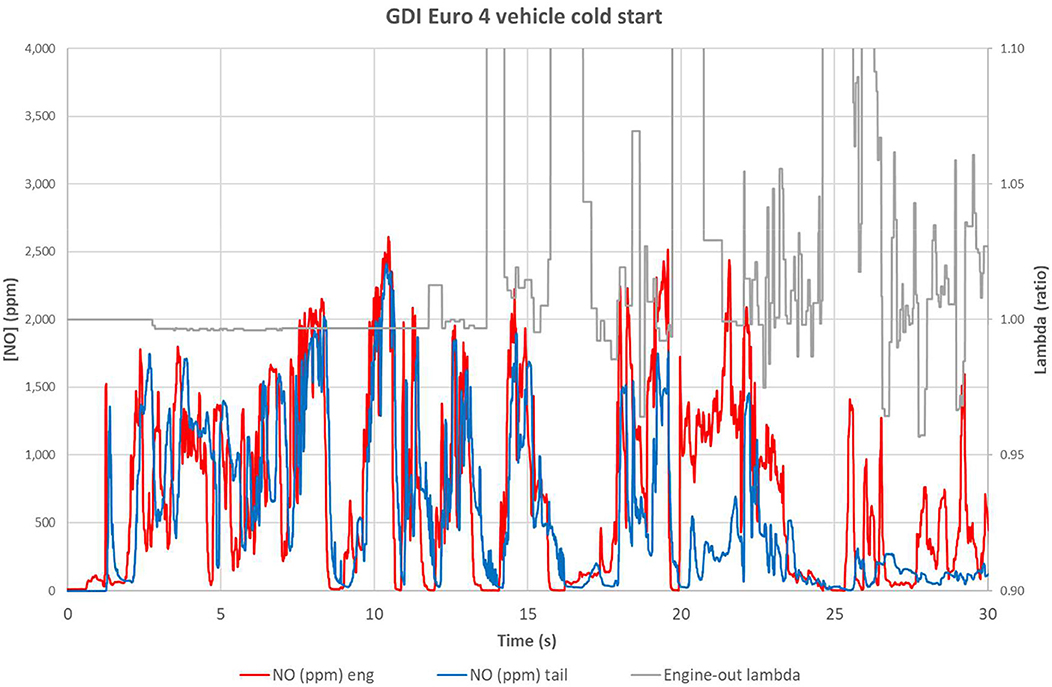
Figure 5. First 30 s of cold start, driving transients and onset of catalyst light-off.
Numerous very short duration transients can be seen in both the engine-out and tailpipe [NO] traces associated with the road conditions and transient engine operation. As can be seen in Figure 5, their duration is usually much shorter than one second and therefore would not be resolved fully by conventional PEMS equipment.
By 30 s (see Figure 6), the catalyst is beginning to reduce the tailpipe [NO] and after about 60 s, all but severe transients are being converted effectively. Dashcam footage showed “severe” transients being the cause on entering and leaving of the first roundabout on departing from the start point.
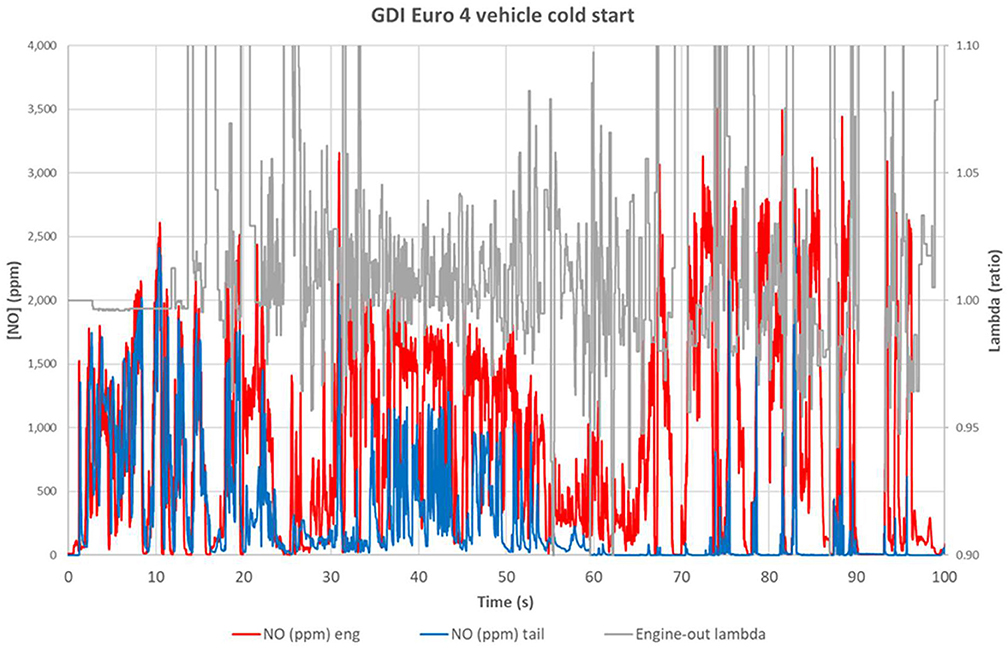
Figure 6. First 100 s of GDI Euro 4 vehicle [NO] emissions at start of RDE route showing catalyst light-off.
Predictably, this cold start and pull-away represents a major contributing portion of the total RDE cycle emissions.
An often-deployed speed limiting measure on UK roads is the speed bump, requiring the driver to slow down before driving over the obstacle and then accelerate away. In this GDI manual transmissions vehicle, this induced the following actions:
1. Deceleration following change-down from 3rd to 2nd gear: foot was removed from the throttle pedal and deceleration fuel-shut-off occurs and the motoring engine then flowed air through the three-way catalyst.
2. Start to idle: clutch was disengaged and the engine restarted at low speed and low load. The vehicle then drove over the speed bump at low speed, possibly with the foot brake applied slightly.
3. Acceleration away from the speed bump in 2nd gear.
4. Gear change from 2nd to 3rd gear with associated throttle, speed and load transients.
The data (Figure 7) shows very low tailpipe [NO] on approach to the speed bump at 203–205 s and the engine-out lambda data clearly shows the sharp lambda increase associated with the deceleration fuel shut-off at 205 s. The restart to idle at clutch-in (step 2 above at 208 s) shows a small rise in [NO] but a very significant spike of NO occurs at 209 s associated with the acceleration away from the speed bump (step 3). Soon after, at 211 s, another spike was evident and is associated with the 2nd to 3rd gear change.
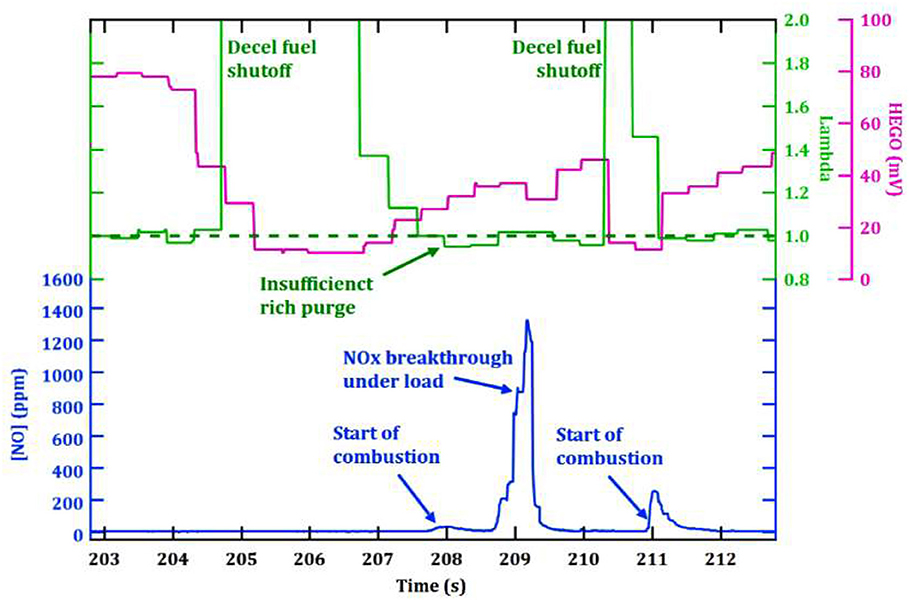
Figure 7. Fast RDE measurement of tailpipe [NO] from Euro 4 GDI vehicle negotiating a speed bump.
The lambda trace reveals (despite lower resolution than the emissions data) that the engine was undergoing a slight rich excursion immediately after engine restart at 208 s (probably designed to replenish the now air-washed catalyst with some HC and CO reductants) but that this was insufficient to prevent the sudden [NO] spike associated with the hard acceleration where the lambda was shown to drift slightly lean at 209 s.
On the same RDE route, this vehicle was shown to have a very effective after treatment system once it had reached its operating temperature with very low tailpipe NOx emissions after 400 s. These continue to be low despite the various transients associated with the urban portion of the drive (Figures 8, 9). The output of the vehicle's own solid-state NOx sensor was also logged to establish the time when active control of the SCR system was working (Figure 8). This was shown to be after 700 s from the start where the NOx sensor's output initially spiked and then, for the next ~700 s, reported approximately double the tailpipe NOx compared to the fast RDE NOx measurement (which was based on ChemiLuminesence Detector {CLD}). Despite this apparent inaccuracy of reading, the tailpipe [NOx] remained low.
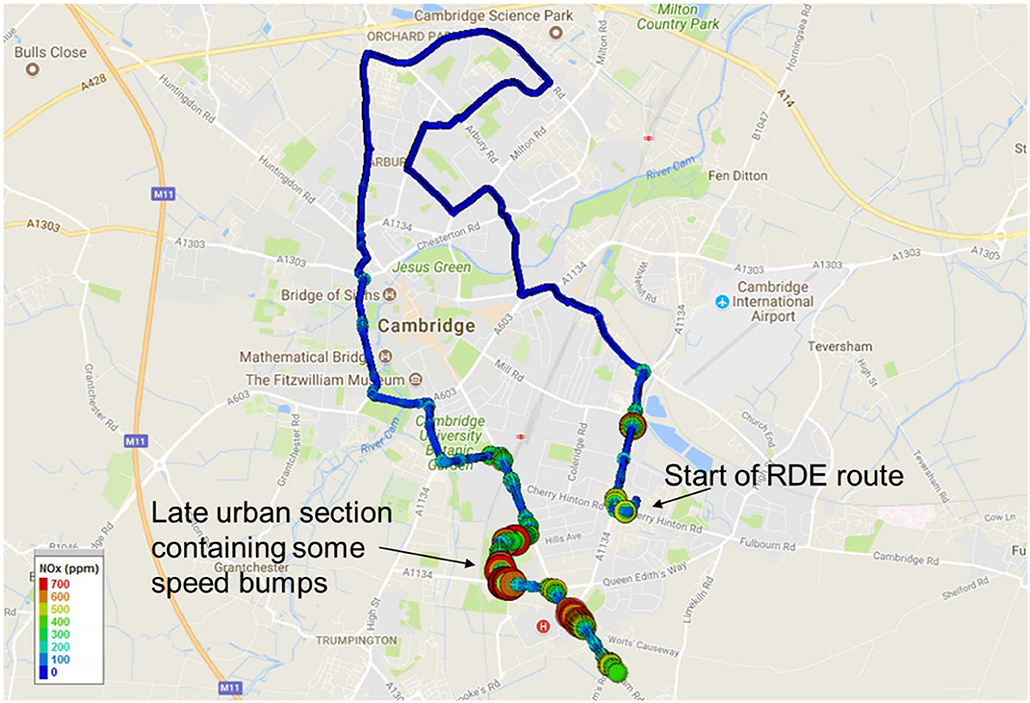
Figure 8. Diesel SCR vehicle showing urban section route with tailpipe NOx emissions events.
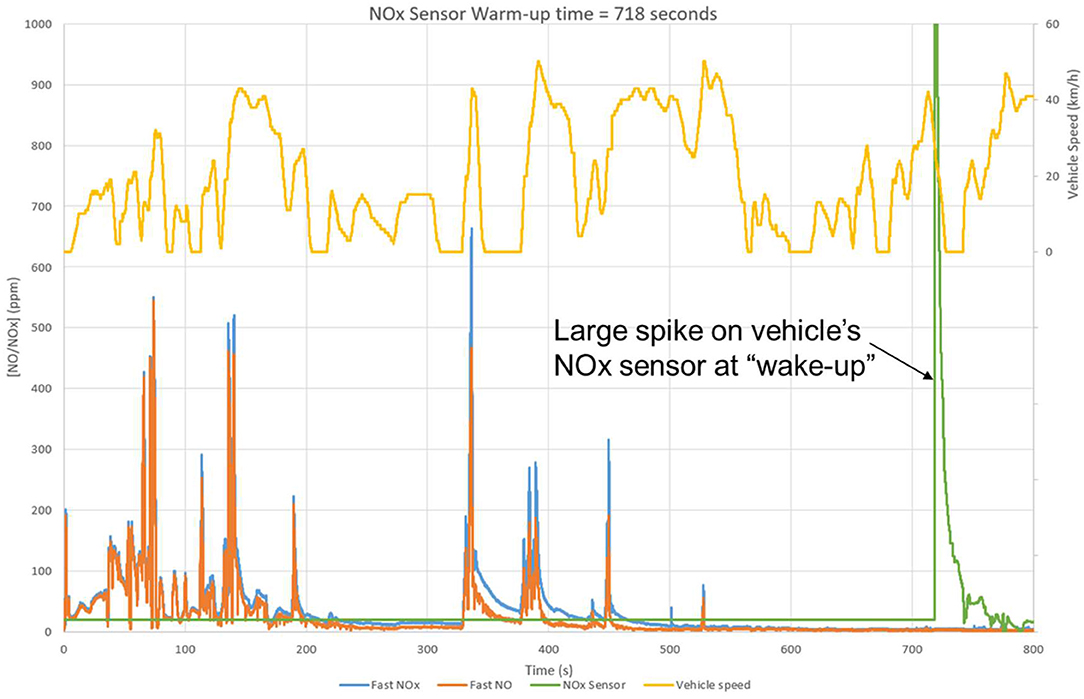
Figure 9. Fast RDE NOx compared with vehicle's own SCR feedback NOx sensor logged via ODB port.
The NOx from the tailpipe in the latter part of the urban section was increased especially during a series of speed bumps but also, more surprisingly, for about 5 min preceding the speed bumps (see Figures 9, 10).
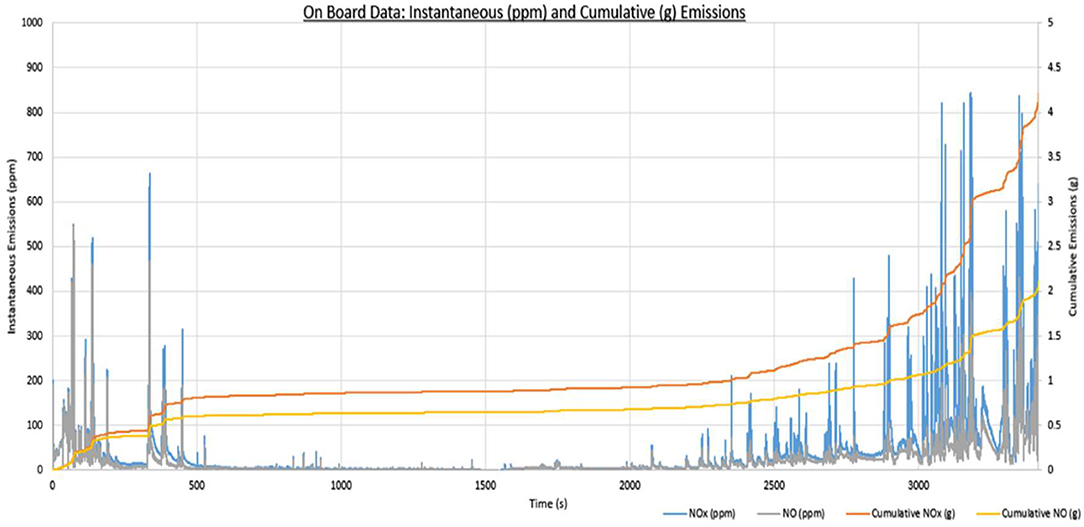
Figure 10. Instantaneous ppm and cumulative NOx and NO emissions for the urban part of the RDE route from Euro 6b diesel showing late urban NOx breakthrough.
Thermocouple data shows no significant reduction in exhaust temperatures and the driving style was similar to the preceding unremarkably low [NOx] period. The authors have been unable to explain this tailpipe rise from the data available, but it is worth noting that RDE-compliant Euro 6d rated vehicles would not be permitted to emit such levels.
During steady state operation on both the rural and motorway phases of the RDE route, an oscillation of the tailpipe NOx was recorded every few minutes (Figure 11). As part of a previous study on this vehicle, both the urea injection (5 ms) pulses and the urea rail pressure were logged.
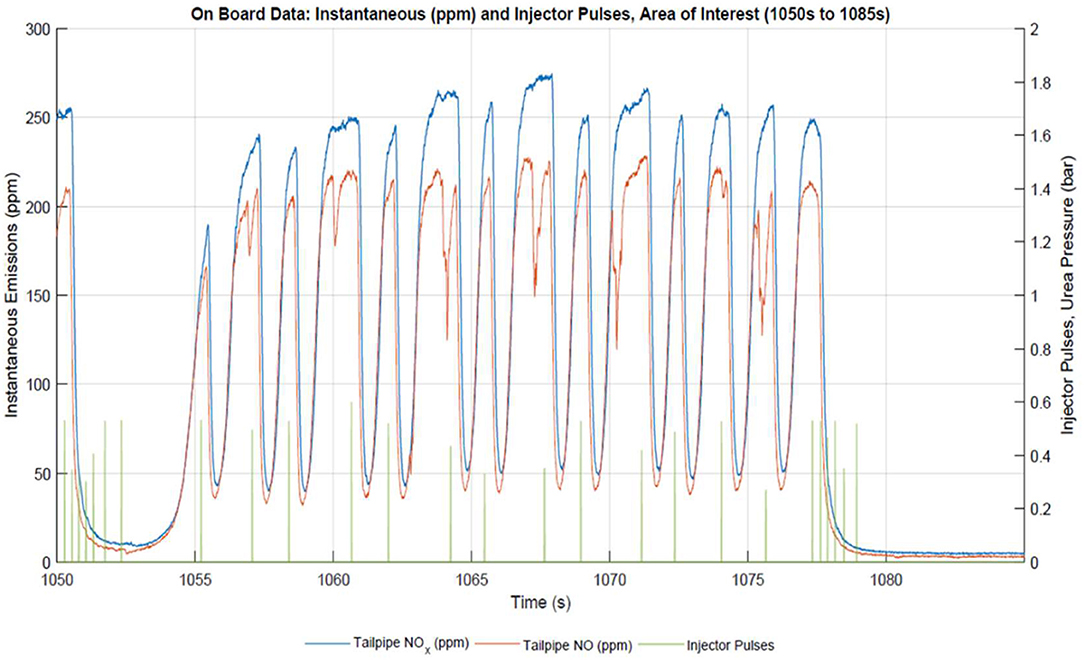
Figure 11. Oscillations in tailpipe NO and NOx during steady state driving encountered during rural and motorway phases or RDE route.
The data shows a 20 s period where the tailpipe NOx rises to 250 ppm on a 3 s period and at this high exhaust mass flow rate, this proved to be a relatively significant portion of the total cycle emissions.
Generally, during the oscillation, a single urea injection pulse reduces the tailpipe NOx, this was not followed by another pulse until the tailpipe sensor had detected a high NOx level indicating the full depletion of the stored urea/ammonia. This may be a diagnostic routine, albeit occurring approximately every 5 min.
This vehicle's traction battery was depleted to its indicated “optimum” charge of ~15% at the start of the route (see Figure 12) and was driven in “normal” mode where a reasonable blend of both electric and engine-powered traction was deployed.
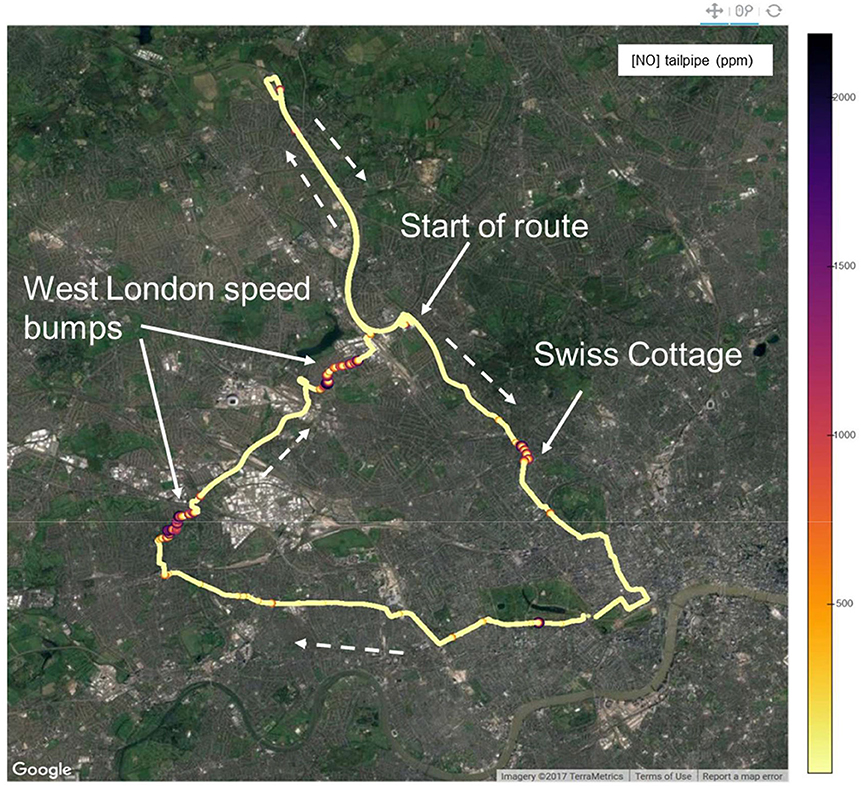
Figure 12. TfL “West London route” in a clockwise direction with tailpipe [NO] plotted using GPS co-ordinates.
The route data showed that the tailpipe NOx emissions were generally concentrated in 3 geographical areas (Figure 12): one associated with heavy and difficult driving conditions (“Swiss Cottage”), plus two areas of speed bumps (in Acton and Neasden). Generally, the control of the engine and after treatment systems is complex yet interesting with frequent engine stop/starts challenging the PFI engine's control scheme. These three areas contributed ~70% of the total journey's [NO] emissions (see Figure 13).
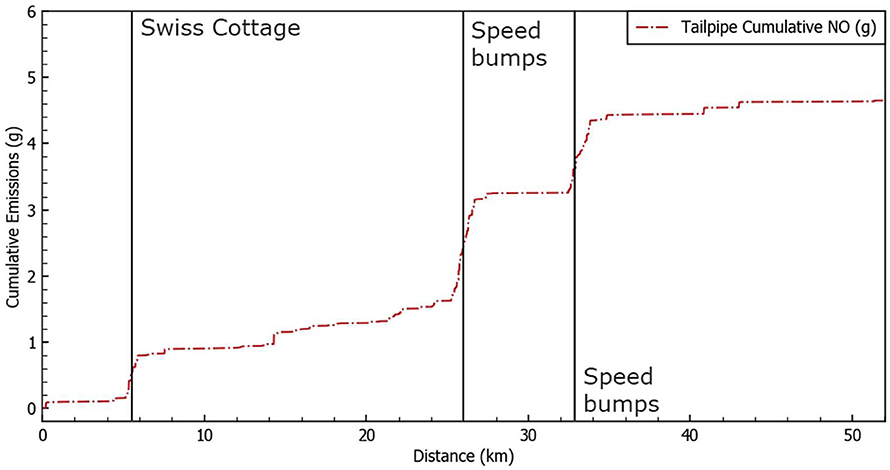
Figure 13. Cumulative mass NO emissions calculated using OBD-reported exhaust mass flow rate.
The following analysis concentrates on these high-emitting locations and transients.
The “Swiss Cottage” intersection is a fairly challenging drive during normal traffic levels with the negotiation of multiple lanes of traffic and traffic lights making for highly transient driving conditions.
The map derived from GPS and dashcam information shown in Figure 14 shows the precise location of the NO emissions and their associated causes. But the correlation with engine-out lambda (shown in Figure 15) reveals that one of the main causes of the tailpipe NO events is associated with the transient fueling control after engine start. The engine was shown to start with a short period of rich operation at 782 s, but where it subsequently drifted lean (783–784), the tailpipe [NO] was shown to be affected immediately despite this vehicle being equipped with two 3-way catalysts. This effect was seen repeatedly during subsequent harsh transients.
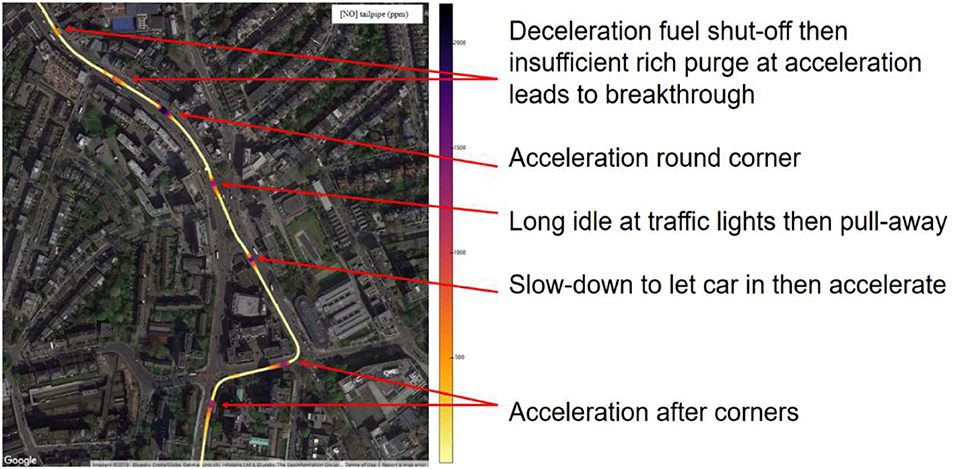
Figure 14. Series of transients induced by traffic conditions at Swiss Cottage.
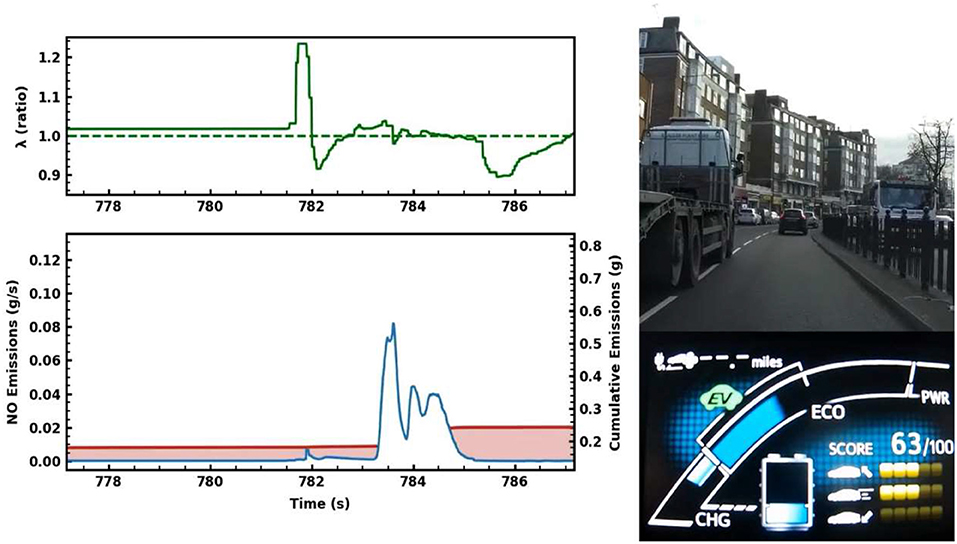
Figure 15. Dashcam, dashboard display, ECU and emissions data showing lambda correlation with tailpipe [NO].
Although PFI has benefits of low particle emissions, it is often associated with poorer lambda control during transients because of the difficulty in managing the intake fuel puddle. This may be a contributing factor leading to the lean excursions mentioned above.
The accurate GPS positioning of the tailpipe NO events associated with the acceleration and high load engine restarts when pulling away from the numerous speed bumps on this route reveal the advantages of the increased temporal resolution; the “clouds” of tailpipe pollution being discernible with “house number” accuracy (see Figure 16) compared to street level accuracy from slower instruments. Such spatially precise emissions data is anticipated to be useful for future dispersion modeling undertaken by others.
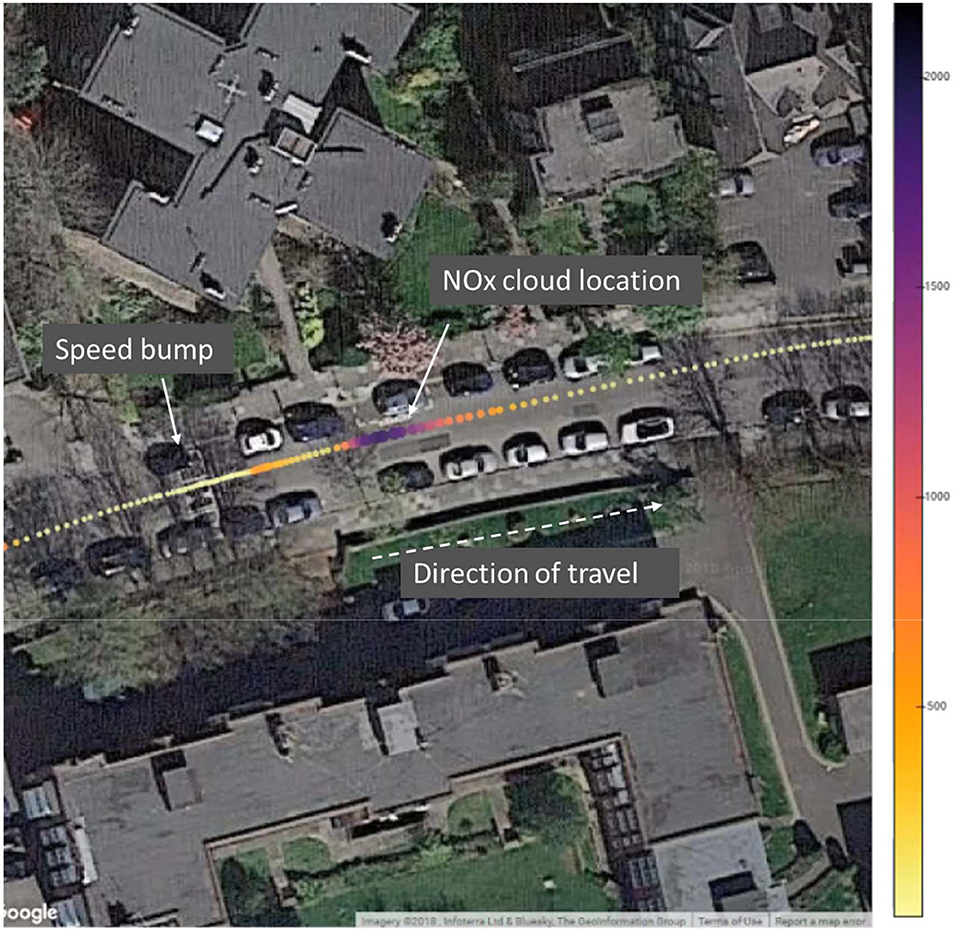
Figure 16. Satellite image from GPS co-ordinates showing high resolution detail of NOx tailpipe event and precise location.
Fast response emissions analysers have been combined with engine ECU and GPS measurements to provide high resolution spatial and temporal data. This enables significantly better understanding of the cause of short lived emission events facilitating for example, engineers to fine tune control parameters. Additionally, the higher resolution presents new opportunities for decision makers to more clearly understand the impact of various traffic calming features and urban planning more generally.
The data from both gasoline, diesel and PHEV vehicles shows a set of very short-duration emissions events which are characteristic of real world driving, but with the added benefit of being able to identify their causes with a view to solving them for future refinement.
The datasets for this article are not publicly available because to make it readable and understandable by most people will require formatting resource which is currently unavailable. Requests to access the datasets should be directed tobXNwQGNhbWJ1c3Rpb24uY29t.
BM kindly provided the vehicle and is an expert in engine control. MH provided data logging and presentation skills. JP provided technical support for the analyzers and MP oversaw the entire project.
MP, JP, and MH were employed by company Cambustion Ltd.
The remaining author declares that the research was conducted in the absence of any commercial or financial relationships that could be construed as a potential conflict of interest.
1. ^Commission Regulation (EU) 2016/427 of 10 March 2016 amending Regulation (EC) No 692/2008 as regards emissions from light passenger and commercial vehicles (Euro 6).
2. ^“AVL M.O.V.E Integrated Mobile Vehicle Evaluation PEMS - Portable Emissions Measurement Systems.” Available online at: https://www.avl.com/real-driving-emissions-rde-/-/asset_publisher/gYjUpY19vEA8/content/avl-m-o-v-e-gas-pems-portable-exhaust-gas-analyzer
3. ^HORIBA ONE system. Available online at: https://www.horiba.com/en_en/applications/mobility-and-transportation/automotive-manufacturing/rde-test-with-on-board-system/
4. ^“CLD Fast Response NOx Analyser”. Available online at: https://www.cambustion.com/products/cld500
Duckhouse, M., Peckham, M., Bradley, H., Irwin, M., and Hammond, M. (2018). “On board fast measurement of vehicle NOx emissions” in WCX World Congress Experience (Cambridge, UK).
Irwin, M., Bradley, H., Duckhouse, M., Peckham, M., and Hammond, M. (2018). High spatio-temporal resolution pollutant measurements of on-board vehicle emissions using ultra-fast response gas analyzers. Atmos. Meas. Tech. 11, 3559–3567. doi: 10.5194/amt-11-3559-2018
Keywords: emissions, RDE, analysers, PEMS, transient
Citation: Peckham M, Parnell J, Hammond M and Mason B (2020) The Measurement of Fast Transient Emissions During Real World Driving. Front. Mech. Eng. 6:19. doi: 10.3389/fmech.2020.00019
Received: 06 February 2019; Accepted: 30 March 2020;
Published: 28 April 2020.
Edited by:
Athanasios M. Dimaratos, Aristotle University of Thessaloniki, GreeceReviewed by:
Georgios Mavropoulos, National Technical University of Athens, GreeceCopyright © 2020 Peckham, Parnell, Hammond and Mason. This is an open-access article distributed under the terms of the Creative Commons Attribution License (CC BY). The use, distribution or reproduction in other forums is permitted, provided the original author(s) and the copyright owner(s) are credited and that the original publication in this journal is cited, in accordance with accepted academic practice. No use, distribution or reproduction is permitted which does not comply with these terms.
*Correspondence: Mark Peckham, bXNwQGNhbWJ1c3Rpb24uY28udWs=
Disclaimer: All claims expressed in this article are solely those of the authors and do not necessarily represent those of their affiliated organizations, or those of the publisher, the editors and the reviewers. Any product that may be evaluated in this article or claim that may be made by its manufacturer is not guaranteed or endorsed by the publisher.
Research integrity at Frontiers
Learn more about the work of our research integrity team to safeguard the quality of each article we publish.