 Faraz Hedayati
 Babak Bahrani
 Aixi Zhou
 Stephen L. Quarles1
 Daniel J. Gorham
- 1Insurance Institute for Business & Home Safety, Richburg, SC, United States
- 2Department of Applied Engineering Technology, North Carolina A&T State University, Greensboro, NC, United States
Generation of firebrands from various fuels has been well-studied in the past decade. Limited details have been released about the methodology for characterizing firebrands such as the proper sample size and the measurement process. This study focuses on (1) finding the minimum required sample size to represents the characteristics of the population, and (2) proposes a framework to facilitate the tedious measurement process. To achieve these goals, several firebrand generation tests were conducted at a boundary layer wind tunnel with realistic gusty wind traces. Firebrands were generated from burning structural fuels and collected in 46 strategically located water pans. The statistical analysis showed that the minimum required sample size based on the chosen statistical parameters (standard deviation, confidence interval, and margin of error) is 1,400 for each test. To facilitate characterizing such a large sample of firebrands, an automated image processing algorithm to measure the projected area of the firebrands was developed, which can automatically detect the edges of the background sheet, rotate the photo if its tilted before cropping, detect edges of firebrands, remove erroneous particles (e.g., ash) and finally measures the projected area. To facilitate the weighing process, a Gaussian process regression was performed to predict the mass based on projected area, traveling distance and wind speed. The model can predict the firebrand mass within 5% error compared to the measurement. This framework and model can provide a probabilistic range of firebrand characteristics over the continuous range of the collection region.
Introduction
Large-scale wildland and wildland-urban interface (WUI) fires have happened more frequently in recent years. Direct flame contact, radiant heat, and burning firebrands (or embers) have been identified as three principal ways that cause fire spread in the wildland and WUI (Clements, 1977; Maranghides and Mell, 2011; Koo et al., 2012; Caton et al., 2017). However, only burning firebrands can initiate a new spot fire at distances further than 60-m away from the main fire front (Cohen, 2008). Spotting due to firebrands, also referred as the firebrand phenomenon, can overpower fire suppression efforts and become the dominant fire spread mechanism (Koo et al., 2010). The spotting process includes three phases: firebrand generation, transportation, and ignition of the recipient fuel.
The ability of a firebrand to travel far way and start a new fire is a function of its physical properties and the environmental parameters (Tohidi et al., 2015). Primary physical properties of a firebrand include mass, size (aerodynamic) shape, surface temperature, heat flux, and the heat of combustion of the fuel. The shape and dimensions are critical factors in firebrand transport. In previous studies, firebrand size has been treated as a 2-dimentional parameter that is represented by the projected area of the firebrand (Manzello et al., 2012b; Zhou et al., 2015; Suzuki and Manzello, 2016; Caton et al., 2017; Manzello and Suzuki, 2017). The mass and heat of combustion determine the total available heat energy from the firebrand. Surface temperature and heat flux play an important role in heat transfer from the firebrand to the recipient fuel. Environmental conditions influence all three phases of the firebrand phenomena. Key parameters include relative humidity, environmental temperature, wind speed, terrain conditions, and the condition of the recipient fuel. Among the environmental parameters, wind speed is critical effecting breakage of burning fuel leading to the generation of firebrands, transport mechanism (e.g., travel distance) and the burning behavior.
Several studies have been conducted to obtain a better understanding of the firebrand generation in structural fires. The methodology for characterizing firebrands in this work was expensive (time/labor/money). In the 1960's Vodvarka conducted full scale building fire tests (Vodvarka, 1969, 1970) and used plastic sheets downwind of fire to measure size of the firebrands. The hot firebrands melted through the sheets, and by measuring the size of the remaining hole, the projected area and traveling distance of the firebrands were calculated. A challenge of this method is distinguishing between measurement of individual firebrands and accumulations when multiple land in the same hole. Recent work has employed water-filled pans to collect and quench firebrands (Manzello et al., 2012a,b; Suzuki et al., 2012, 2013, 2014; Manzello and Suzuki, 2013, 2017; Zhou et al., 2015; Suzuki and Manzello, 2016). Quenching firebrands preserves their mass and shape at the point of landing which changes as the firebrand burns. The center of each pan is considered as the landing position for each ember, so the data is discrete. The wet pan method also requires the drying of the collected firebrands which involves handling the fragile firebrands and may break some firebrands during handling and drying if not done properly, and thus contribute to measurement uncertainties and errors.
The process of measuring or characterizing the physical properties of firebrands can be more tedious than conducting the tests because the burning fuel generates many firebrands which need to be individually measured. For a single experiment the number of generated firebrands in the complete sample (or the whole firebrand population) is often extremely large. This makes the complete collection, enumeration, and characterization of the whole firebrand population impractical or impossible. Sampling techniques play a pivotal role in the validity of the measurements. Statistical sampling should be used so that a subset of manageable size can be used to represent the whole firebrand population. Ideally, a firebrand collection process should have unbiased representative firebrands during the sampling process. In practice, only firebrands larger than a certain size can be collected and enumerated by researchers. For example, in some early firebrand studies, expressions such as “unaccountable” or “many” were used for very small firebrands (Vodvarka, 1970). In strict terms, firebrand collection is not a random sample selection process because some firebrand (i.e., the very small ones) of the population will not be selected. This exclusion bias is a source of uncertainty and brings limitations on how much information a firebrand sample can provide about the whole population. The sample of the full-scale building component experiments conducted in the past varied between 50 and 500 firebrands (Manzello et al., 2012b; Suzuki et al., 2012; Suzuki and Manzello, 2016; Manzello and Suzuki, 2017). The vital question is how many firebrands are needed to sufficiently quantify the characteristics of entire population of the firebrands in an experiment. If the answer suggests a sample size far larger than 500, the efficiency of the current measurement methodology to count and measure thousands of firebrands must be explored. Furthermore, it is not practical to cover the entire area of the downwind of fire in water pans to catch all the firebrands; therefore, no information could be obtained at the uncovered locations. There is a need to determine (or at least estimate) different characteristics of the firebrands at those spots.
To address these issues, this study aims to develop and test a new statistics-based framework that incorporates a machine learning predictive model for the sampling and measurement processes in firebrand generation experiments so that the obtained firebrand data can achieve the desired level of statistical reliability with increased efficiency. To achieve this goal, sampling based on statistical analysis was performed to determine a statistically acceptable sample size for each experiment. To test the proposed framework, firebrand generation experiments were performed, firebrands were collected, and their physical properties were measured. The process of measuring the mass and projected area is a tedious task, so an advanced automated image processing algorithm was developed to minimize the human effort in measuring the projected area. By incorporating a machine learning predictive model into the framework, instead of physically weighing the firebrands, their mass can be estimated based on the desired level of accuracy.
The structure of this paper is as the followings. The framework and firebrand generation experiments are explained in Section Statistics-Based Framework and Firebrand Generation Experiments. This includes information about specimens and test facility, firebrand collection design, test procedures, and sampling design. Section Firebrand Characterization addresses the measurement and characterization of the collected firebrands, including their traveling distance, mass, and projected area. In this section, an advanced automated image processing algorithm is presented and then the uncertainty analysis of the measurements is discussed. In Section Firebrand Characterization Results, the framework for employing machine learning is presented to minimize the tedious weighing process.
Statistics-Based Framework and Firebrand Generation Experiments
Proposed Framework
The overview of the framework is depicted in Figure 1. Projected area and mass are the most tedious parameters to measure. To ease the former one, an image processing algorithm is developed. To facilitate the weighing process, Gaussian process regression is employed.
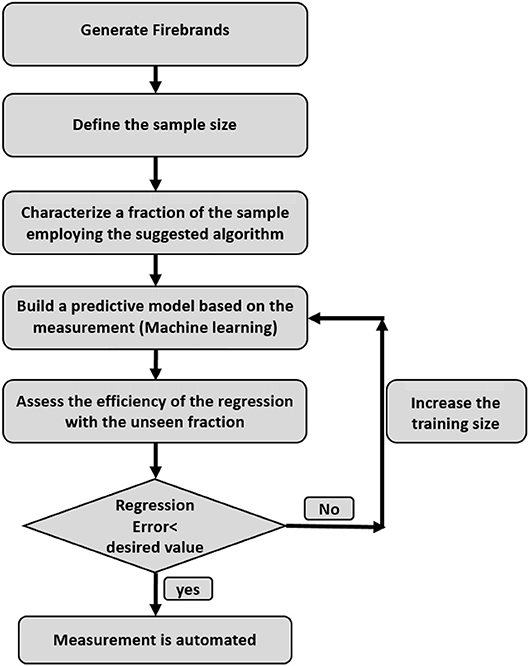
Figure 1. The overview of the framework.
Specimens and Test Facility
Several parameters were considered in the experimental design including burning fuel material, geometry, layout of the pans and wind speed. In a set of experiments, several full-scale structural assemblies with different materials were tested under different environmental conditions as part of a multi-year, multi-institutional project. For the purpose of this paper, only firebrands generated from 90° corner assemblies at three different wind speeds were used. The corner assemblies were built from typical residential building construction materials in wildfire prone areas of the United States. Corner assemblies were made with solid or composite wood horizontal lap attached to a ½-in. nominal oriented strand board (OSB) or CDX plywood. A picture of a burning corner assembly is shown in Figure 2A. Each wall in the corner assembly is 32-in. (81-cm) long, using 2-in.× 4-in. (5- × 10-cm) southern yellow pine (SYP) framing, 16-in. (41-cm) on center. A nominal ½-in. (1.3-cm) gypsum board is attached to the non-fire exposed walls. Wall sheathing on the fire-exposed side is nominal ½-in. (1.3-cm) OSB. Siding on the fire exposed side is solid cedar wood. All the samples were conditioned in a kiln to reach the nominal moisture content of 5% prior to firebrand production experiments. Fuel packages were ignited with custom-build natural gas burners. These tests were performed in the test chamber at the Insurance Institute for Business & Home Safety (IBHS) Research Center in Richburg, South Carolina, USA. The facility has a 148-ft. × 148-ft (45- × 45-m) open-jet wind tunnel with a clear height of 59-ft. (18-m). The wind flow is produced using arrays of 105 approximately 6-ft. (1.8-m) diameter fans with active and passive control elements to simulate atmospheric boundary layer flow up to 130-mph (58-m/s) wind speeds 33-ft. (10-m) above the ground (Standohar-Alfano et al., 2017). The three designated fluctuating wind speed levels used in the experiments are: low (average 12-mph or 5-m/s), medium (average 25-mph or 11-m/s), and high (average 40-mph or 18-m/s).
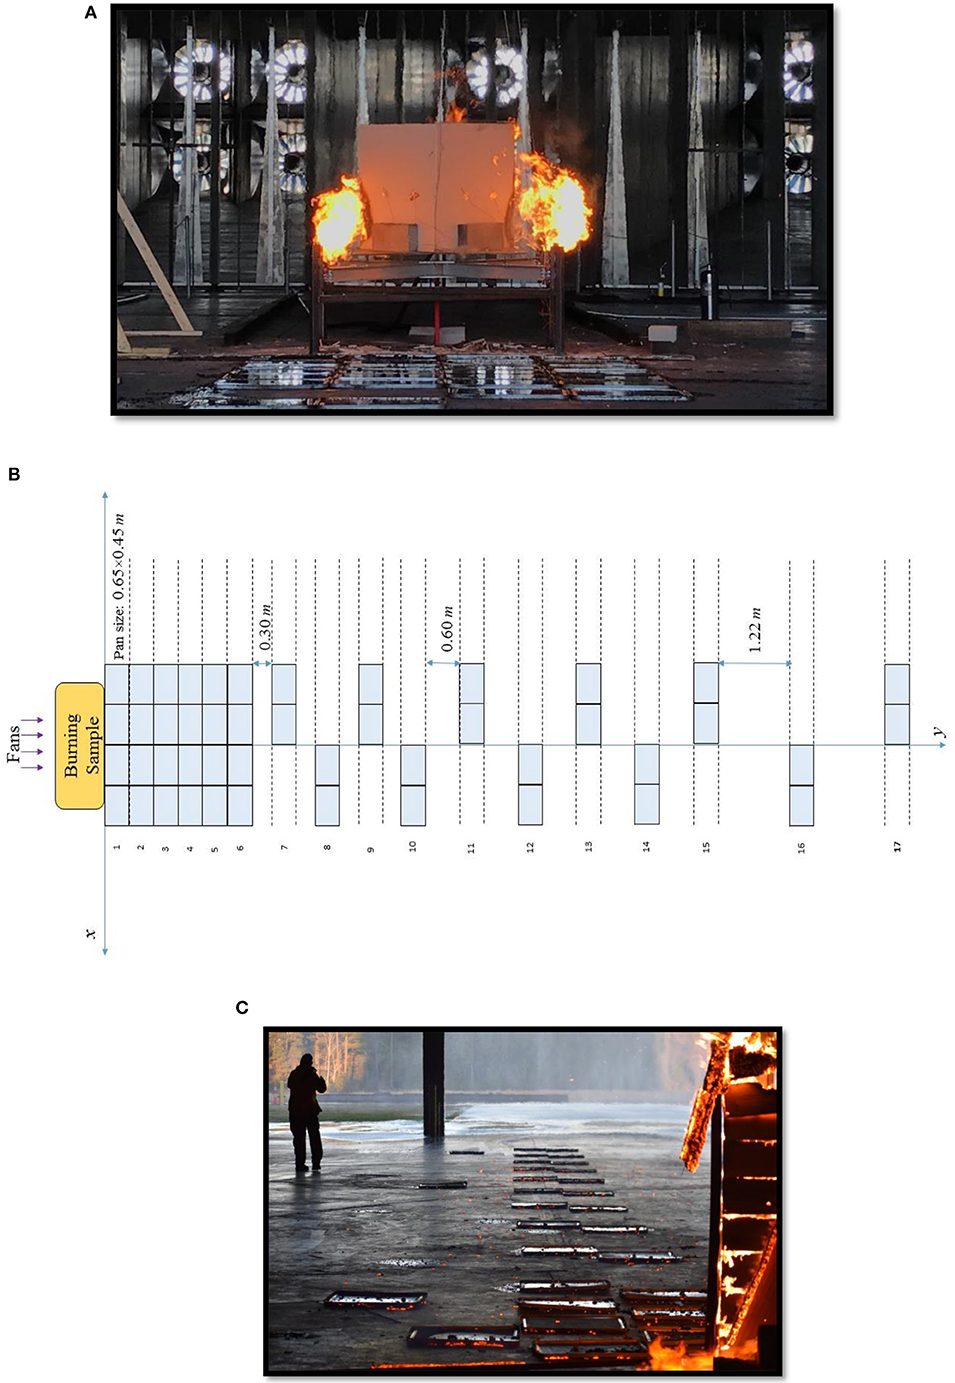
Figure 2. (A) Burning sample (corner assembly) inside the wind tunnel. (B) Layout of the water pans. (C) Water pans downwind of fire.
Firebrand Collection
A rectangular area of approximately 2- × 15-m downwind of fire specimen was available in the test chamber for water pans. Figures 2B,C depict the layout of the water pans in this collection area. Wake flows immediately downwind of the object are strong which may cause a large number of firebrands to land a short distance from the burning object so six rows of pans were placed immediately downwind of the fuel package. Assuming a symmetrical distribution of firebrands about the central line water pans were located on alternate sides for rows 6 through 17 to maximize distance covered. In total, 46 aluminum water pans, each with a capture area of 0.65- × 0.45-m, were strategically located to optimize collection of firebrands. Window screens (mesh) were submerged in each water pan to facilitate the collection of firebrands.
Test Procedure
The ignition source was an arrow shaped stainless steel burner placed at the base of the insider corner assembly. Test start time was at burner ignition with fans on. Burner was removed after 10 min and total test time was 30 min. Three corner assembly fuel packages were tested at each wind speed. Firebrands at each wind speed were collected after all three tests. The firebrands were oven-dried to reach zero moisture content level and then were sealed in plastic bags and clearly marked for each test. The number of firebrands in one bag was intentionally limited to ensure that only one layer of firebrands was stored in one bag. The bags were separated from each other with layers of paper towels and were gently placed in boxes to avoid firebrand breakage during transportation to the University of North Carolina at Charlotte. Although extreme care was taken during transportation and handling, some of them might have been broken. We recognize this is a source of uncertainty in this study.
Sampling
In order to estimate the characteristics of the entire population, either simple or stratified random sampling can be used. Stratified random sampling is suggested when there are different groups in the population (de Vries, 1986). Since each of the experiments is considered as a separate group, stratified sampling was chosen for this research. Assuming normality (Zhou et al., 2015), the sample size can be obtained using the confidence interval relation which requires defining the sample standard deviation, confidence interval and margin of error (Hosmer and Lemeshow, 1992). The larger the standard deviation becomes, the larger the sample size will be. The correlation of sample size with margin of error, however, is reversed. Since no information about the standard deviation of tests was available, the average of standard deviations of firebrands in previous studies (since the 1960s) (Hedayati and Zhou, 2017) was used, which showed the minimum threshold of 0.42 grams. However, to be more conservative, a standard deviation of 0.55 grams was used for this study. The margin of error was set to be 0.03 which is smaller (and thus more reliable) than the typical value of 0.05. Based on these requirements the sample size estimator function of Minitab suggests approximately 1,300. To be conservatives the minimum sample size was specified as 1,400 firebrands for each experiment. The sample included firebrands from all water pans which in some cases exceeded the minimum size. In this study, a total of 4,415 firebrands were collected and analyzed: 1,400 at idle, 1,520 at medium speed, and 1,495 at high wind speed.
Firebrand Characterization
Three key parameters of firebrand were investigated: traveling distance, mass, and projected area. The first two are straightforward to measure and are grouped together in Section Traveling Distance and Mass. The technique for measuring projected area is explained separately in Section Projected Area.
Traveling Distance and Mass
Traveling distance represents the horizontal distance from the point the firebrand was generated to where it lands. For these tests the travel distance can be calculated by over the straight length of the straight line from the burning corner assembly to the center of the collection pan which is known by the row and column (as shown in Figure 2). The mass of the firebrand changes from when it is generated from the source fuel as it burns, and virgin fuel combusts. When the firebrand lands the water quenches the combustion and stops mass loss. Individual firebrands were weighted using a digital balance (Sartorius H51, resolution of ± 0.0001 gram).
Projected Area
The size and shape of firebrands can impact the aerodynamics during transport and accumulation geometry. In the literature, there is not much detail about the calculation of the surface area of the firebrands (Manzello et al., 2012a,b; Suzuki and Manzello, 2016; Manzello and Suzuki, 2017). A new process was developed to expedite measuring the projected area of firebrands. Firebrands were placed on a white sheet which provided a contrasting background to black objects. High-resolution pictures were captures of each sheet using a Nikon D5600 and light setup that provided adequate lighting from three directions at 120° interval on the sheet to avoid shadows. To increase the efficiency in measuring the projected area and minimize human labor, a MATLAB code was developed to automate the process, with the steps illustrated in Figure 3. Images were processed to remove noise on the white sheet and outside of it (Figure 3A). A histogram of the image colors was stretched to adjust the contrasts. The algorithm detected the edges of the sheet and calculated the angle between the edges and the vertical axis (Figure 3B) and the image was rotated, thresholded, and cropped to remove noises beyond the sheet borders (Figures 3C,D). The thresholding value is a source of uncertainty in the measurement which will be discussed in Section Uncertainty in the Measurement. In Figure 4.1, two sources of noise can be observed; the scratches on the sheet that occurred by scattering the firebrands on the sheets, and the white ashes on the firebrands. In Figure 3E, both are removed, and the borders are cleaned so the remaining objects (white pixels) were individual firebrands. Each firebrand was labeled (Figure 3F), and the projected area of each firebrand with respect to Object 1 (rectangle with known area) were calculated. Using this automated method, counting and calculating the projected area of hundreds of firebrands can be accomplished in a few seconds. Note that in the traditional method, each of these steps were done manually which increases the measurement time significantly.
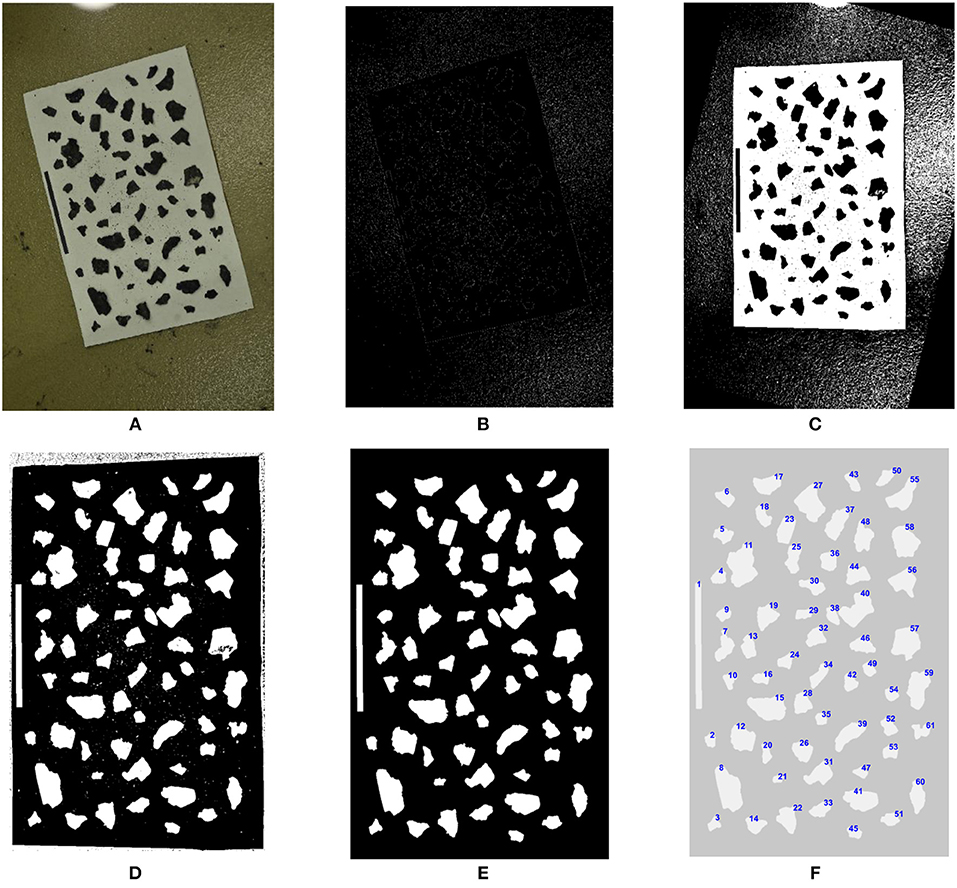
Figure 3. Detailed steps to calculate the projected area. (A) Original image. (B) Edge detection. (C) Rotation. (D) Corner detection and cropping. (E) Noise removal. (F) Labeling firebrands with known projected areas.
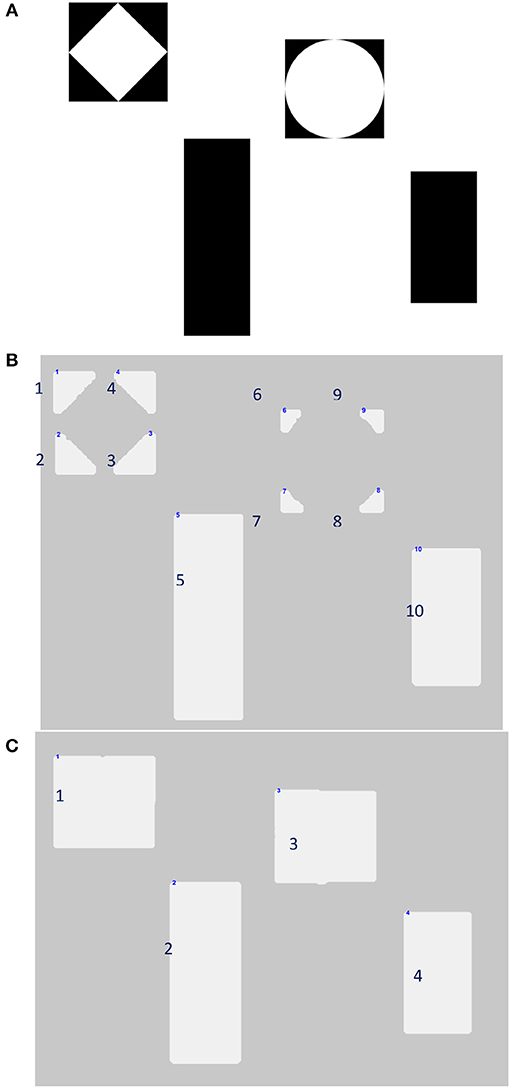
Figure 4. Investigating the effects of thresholding; (A) original image, (B) low thresholding value, (C) high thresholding value.
Firebrand Characterization Results
The measured firebrand data are summarized in Table 1. In addition to mean, standard deviation, median, and correlation values, the skewness of each parameter is also provided. Correlation value of positive one indicates a direct relationship between the parameters while negative one indicates an inverse relationship. Zero correlation means no relation between the parameters exists. The correlation values in the table show that mass and projected area are strongly correlated, as observed in some experimental (Manzello et al., 2012b; Suzuki and Manzello, 2016; Manzello and Suzuki, 2017) and theoretical studies (Tohidi et al., 2015) The corrections between mass and traveling distance as well as projected area and traveling distance are small. The mean and median of travel distance, projected area, and mass increased as wind speed increased. Wind speed can have competing effects on generation of firebrands, higher wind speed can force departing larger firebrands and at the same time will increase the combustion rate during the flight. Since the flying distance in this experiment was limited by the dimensions of the test chamber, Table 1 suggests that stronger wind causes larger firebrands to depart which can travel further away. Also, the standard deviation of projected area and mass increased when wind speed increased, which implies that the range of variation in the size and mass of the firebrands was larger at stronger winds (more variability in the sample).
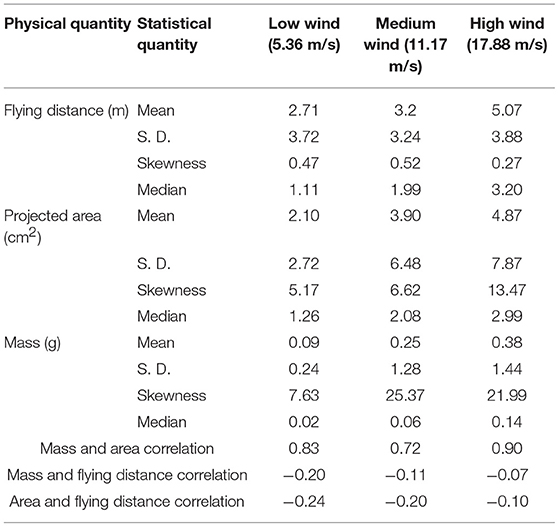
Table 1. Summary of the measured parameters at different mean wind speeds.
Measuring the density of firebrand can be a challenging task, but worth investigating. Strong correlation between mass (m) and projected area (a) suggests that there is a linear correlation between them. This correlation can be approximated as m = K a, where K is a constant. Since we know that m = (ρh)a (where ρ is the density and h is the thickness of a firebrand), recording the thickness of firebrands can provide useful information about the distribution of the density of firebrand.
Uncertainty in the Measurement
To investigate the uncertainty of the projected area measurement, different geometries have been plotted on a sheet with known pixel numbers and areas. As Photoshop plots with three significant digits (0.01-cm2 resolution), the calculations also presented three significant digits. Miscounting the pixels typically happens at the borders of an object, which depends on the user-defined binary image threshold. The threshold defines how sensitive the MATLAB code should be when it converts different shades of gray in an RGB image to a binary one. To investigate the effects of thresholding reference objects with various and known pixel configurations were used (Figure 4). At a granular level angular and curved edges of these objects are square pixels which effects the uncertainty of the measurement based on the thresholding value. A thresholding value (α) to 0.20 resulted in loosing numerous pixels in counting (Figure 4B) while a value of 0.9 led to identifying any dark point on the sheet as an object, which can be seen in Figure 4C.
To find the proper range for α in which the minimum error-difference between the best estimated value and the measured value- occurs, the surface area of the objects in Figure 4A were calculated at several thresholding levels (from 0.1 to 1 with 0.1 intervals). The minimum relative error happens when 0.6 < α <0.8. This threshold range was validated on a sample of 27 firebrands. Using the same code, the differences between the projected areas were calculated at α = 0.6 and α = 0.8 for each firebrand. It was determined that the maximum difference is 0.11-cm2 which can be considered as the uncertainty of the projected area for each measurement.
The standard uncertainty of the measurement can be calculated by dividing the standard deviation by the square root of the sample size. The standard uncertainty of measuring mass, traveling distance, and projected area were determined to be 0.0169-grams, 0.22-m, and 0. 0.09-cm2, respectively. Among the three parameters traveling distance measurements has additional sources of uncertainty because a two-dimensional collection area was reported as a single point (the center of the pan). For this case, the theoretical uncertainty is rounded up to the measurement resolution which is half of the width of the water pans (0.22m).
As mentioned earlier, skewness is an important parameter to study asymmetry of Probability Density Functions (PDFs). Equation (1) shows that the uncertainty in skewness depends on the uncertainties of the mean and individual firebrands.
The uncertainty can be calculated with Equation (2), where and are already calculated as 0.05 and 0.11, respectively.
The numerical values for the derivatives are shown in Equation (3) (work shown in Appendix).
The numerical value for the combined uncertainty for skewness reduces to 0.29-cm2. Employing a similar approach, the uncertainty in measuring the skewness for mass and traveling distance are 0.047-gr, and 0.33-m, respectively.
Mass Prediction Model
Employing the proposed algorithm in Section Projected Area, measuring the projected area becomes a straightforward task. Measuring the mass, however, remains a tedious task because each of the 4,415 firebrands must be weighed individually using the high-precision balance. Machine learning, a type of artificial intelligence that enables the computer to predict or classify a set of data (Carbonell et al., 1983), can be employed to expedite the weighing process. There are several different algorithms available to predict (regress) a variable with machine learning techniques. For this project Gaussian process regression is employed which is useful when the relationship between the predictors and the predicted value is unclear (Williams and Rasmussen, 1996; Bernardo et al., 1998). This type of regression also works well for continuous regressed values, such as mass. This method provided the best estimated value for the prediction as well as a probabilistic range defined the certainty about the predicted values. The mathematical formulation of the Gaussian process regression is beyond the scope of this paper; however, the method is explained briefly in the following for the purpose of this study.
Gaussian Process Regression
The idea of Gaussian process regression (Rasmussen, 2003; Rasmussen and Williams, 2006) is the extension of probability distribution of numbers to the probability distribution of functions. In this study four attributes describe each firebrand, where the obtained data set can be analyzed in two different ways. The conventional way is to see all the points in a four dimensional space. The alternative look is to consider them as the values of a function sampled at four points. In the first perspective, points can be chosen from a probability distribution which are typically determined by a mean vector and a covariance matrix. In the second analyzation, we can have a probability distribution of functions determined by mean and covariance functions. This covariance function depends on the Kernel function which describes the influence of each point on its neighbors.
To predict the value of an input that the model has not yet seen before (validation subset), Gaussian regression built a multidimensional normal distribution with the seen data (training subset). In other words, in order to regress the n+1st value, an n dimensional normal distribution is built. Having conditioned (sliced) the multivariate PDF, the dimensions of the PDF reduces and ultimately the most probable value, as well as a probabilistic range for the prediction, can be estimated (Bernardo et al., 1998). The probabilistic range depends on the covariance function between the inputs that the user provides for the algorithm.
Before discussing the results of the predictive model, it is necessary to address the effects of the training and validating subsets on the model. The training subset is used to build a model to predict the response value and the validation set is utilized to assess the accuracy of the build model based on the training data set. Typically, 70% of the data is implemented to train the model and 30% is held out for the validation set (Rasmussen, 2003). However, the accuracy of the model heavily depends on how the data is split and trained. Although one may have chosen the subset elements randomly, it would be more accurate if the division process was repeated for multiple times in a random way to minimize the dependency of the model on the subsets. This process is known as cross validation (Refaeilzadeh et al., 2009). In this method, the data would randomly be divided into k sets. K-1 of the sets would be used to train and 1 will be saved for validation. This process continues until all the subsets have been employed for validation at least once (Refaeilzadeh et al., 2009). The larger the k is, the more computational efforts we will have but the model will be more robust.
Results and Discussion of the Predictive Model
To evaluate the influence of different inputs on predicting the mass of each firebrand, a decision tree model was built for the different attributes in the data and uses them to split the data into subsets (Safavian and Landgrebe, 1991). The obtained split subsets are called pure if all the elements in that subset are homogenous and called impure otherwise. Once all the predictors are split, the algorithm starts to split each subset in order to find the purest subset. Clustering the data into an absolutely pure subset rarely happens.
The importance of the predictors to estimate the response value is measured by the magnitude of a fraction; the numerator is the purity of each branch and the denominator is the number of binary decisions to reach the final step in each subset. The larger the ratio is, the more significant that parameter is to predict the response variable. Projected area, distance, and wind speed are the three important predictors and mass is the response variable. Having employed 3/2 Matérn kernel function and taken the cross-validation factor equal to five (k = 5), a Gaussian regression was built over the training set with the size of 950.
Figure 5 depicts the results of the prediction of the mass for the medium wind speed experiment. Red dots depict the measured mass with the balance, and the blue circles illustrate the predicted value with the predictive model. The dotted line shows the maximum probabilistic range that the mass of a firebrand could be based on the given surface area, traveling distance, and the wind speed. This can be helpful to simulate the worst-case scenario and monitor how large/heavy a firebrand may be at any desired distance or wind speed. Errors between measured and calculated firebrand mass values can be seen in Figure 6.
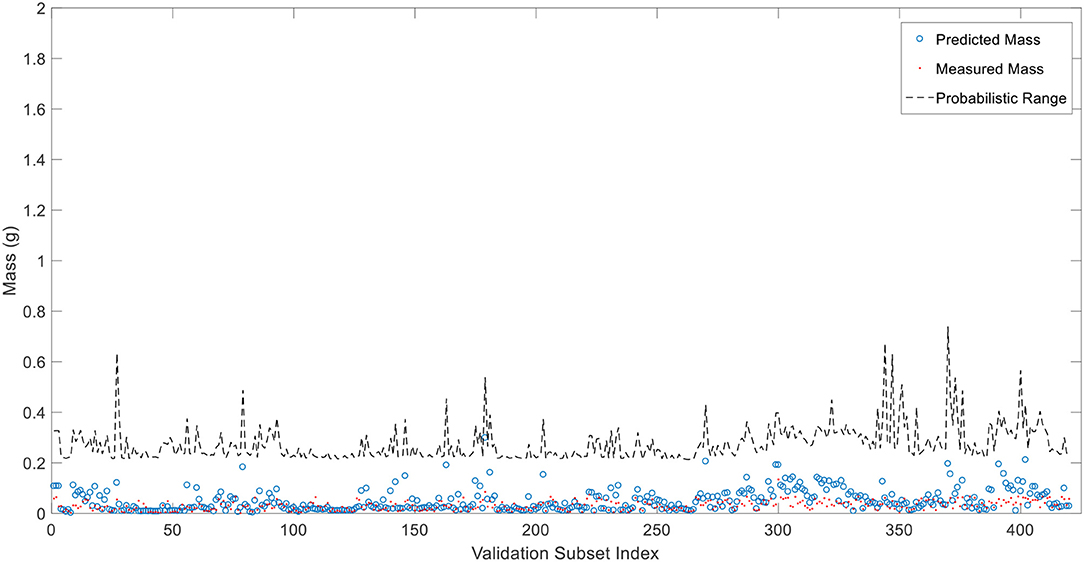
Figure 5. Schematic of predicted and measured firebrand mass values.
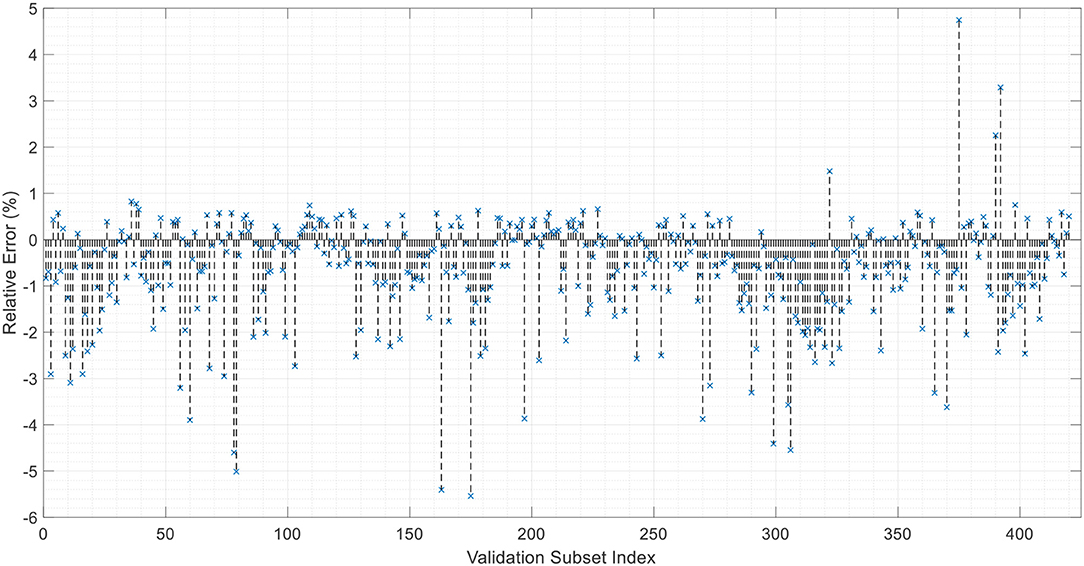
Figure 6. The error between measured and predicted firebrand mass values for unseen firebrands (validation subset index).
To visualize the relative error between the predicted and measured values, the validation subset is plotted for each firebrand as illustrated in Figure 8. The model was able to predict the mass within 0.5%. Although the individual values for mass have been predicted sufficiently accurate, the individual values do not play an important role when one intends to create a PDF based on the data. Regardless of the underlying PDF, all the PDFs require the mean, standard deviation and correlations between the predictors which will be addressed subsequently.
The relative error of mean, standard deviation, and correlations vs. the training size are plotted in Figures 7–10 with a sample size of 1,400. In each figure, 5 and 10% error lines are plotted with red dotted lines. What stands out in these figures is that when setting the training size to 700, the model can predict the mean, standard deviation and correlations of the mass with <10% error. In other words, employing this model, the results that one may obtain by counting 700 firebrands is <10% deviated from counting 1,400 firebrands. Hence, employing this technique can significantly reduce the labor (e.g., 50%) involved in the measurement process.
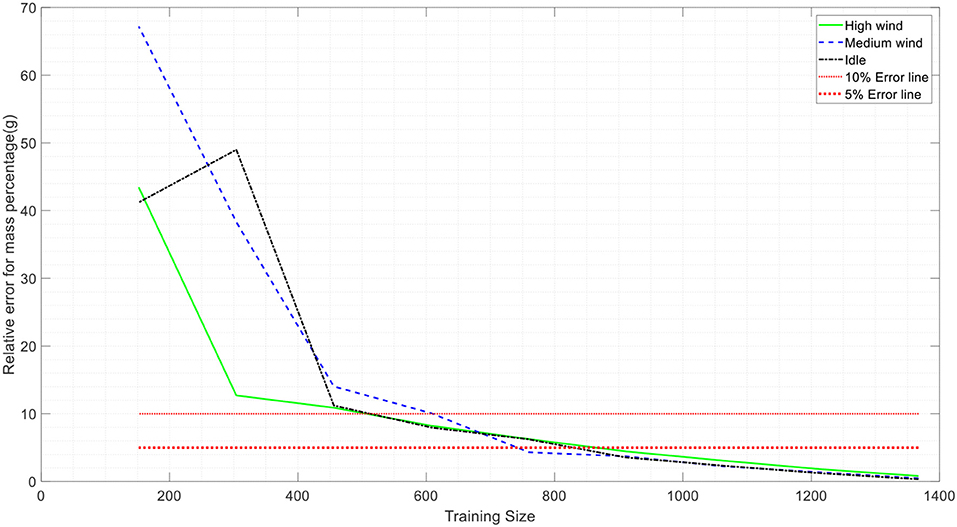
Figure 7. Variation prediction of mean values for firebrand mass with sample size.
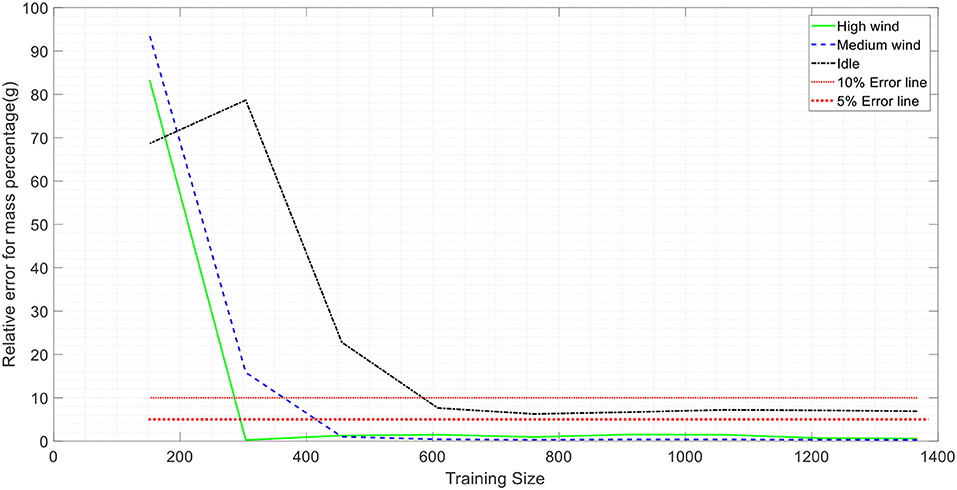
Figure 8. Variation predication of standard deviation values for firebrand mass with sample size.
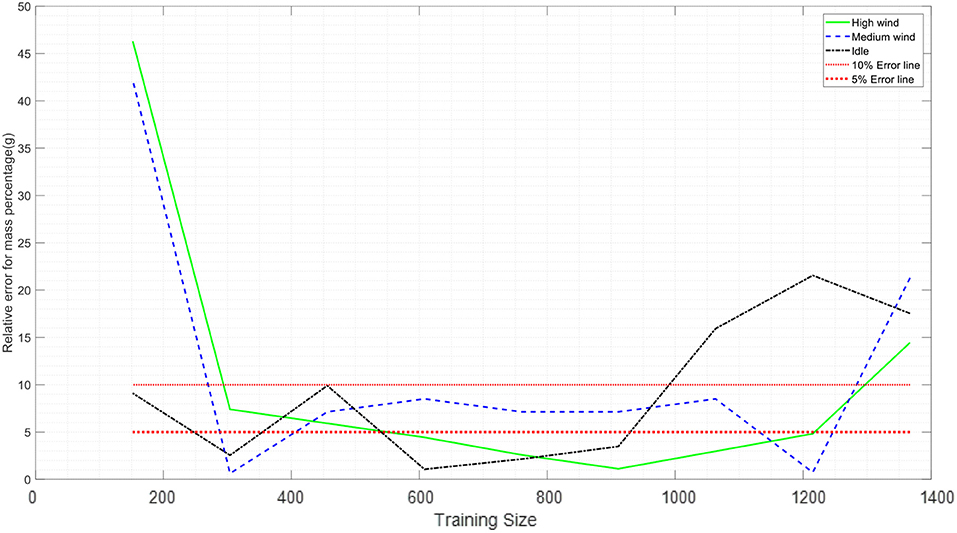
Figure 9. Variation predication of firebrands' mass and projected area correlation with sample size.
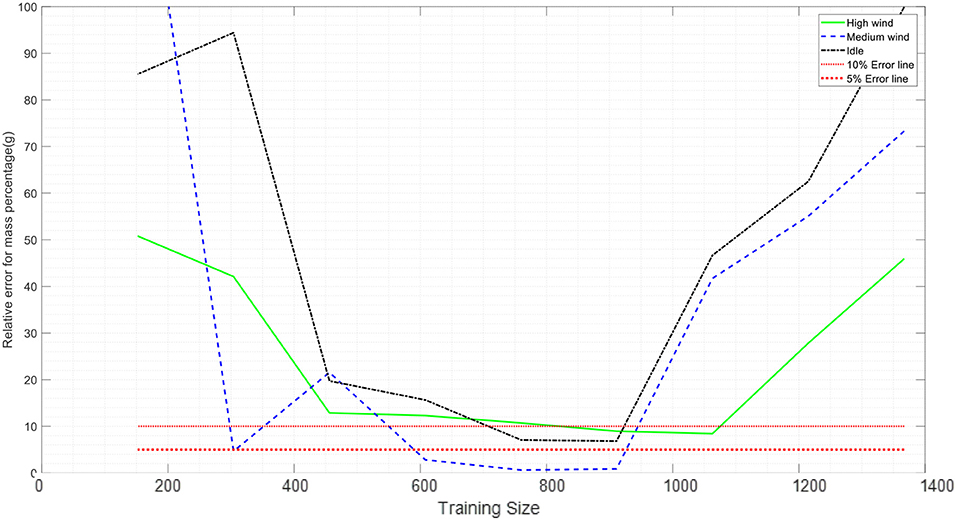
Figure 10. Variation predication of firebrands' mass and flying distance correlation with sample size.
Figures 9, 10 show that the relative error starts increasing when the training size is larger than approximately 900 samples, a result of overtraining the model. In any regression problem, if the complexity of the model increases, it is very likely that the model is not capable of predicting the validation set very well. If the model touches every point in the training set exactly, it involves the fluctuations and noises in the training set and will be trained without any uncertainty for the prediction. However, the model will lose the ability of predicting the response value for a new unseen point. In Figures 7, 8, since the concept of the mean and standard deviation is to subtract each point from the mean value, the noise in the data set is reduced. For correlations in Figures 9, 10, when the training size gets larger than 900, the model losses its accuracy to predict the mass and then the relative error in calculating the correlations increases. From experimental data the center of pans is the landing position of the firebrand; thus, the data is inevitably discrete. Considering this fact, the calculated correlation between the mass and traveling distance may have less degree of accuracy comparing to other presented parameters.
Conclusion
In this study, experiments were conducted to generate firebrands from burning corner assemblies (building materials) in a boundary layer wind tunnel. A sample size of 1,400 firebrands for each of the three experimental configurations was necessary to determine the characteristics of the population. A process for efficiently measuring traveling distance and projects area was employed for a large sample size. An image processing algorithm was developed to measuring project area of each firebrand in batches. The projected area accompanied with traveling distance and wind speed was used to train a predictive model for estimating the mass of individual firebrands. The comparison between the predicted mass and measured mass shows a maximum error of 5%, confirming the accuracy of the model. This framework provides a methodology for efficiently measuring travel distance and project area along with a model that provides a probabilistic range for the estimation of firebrand mass/projected area/flying distance. Using this method for future testing will reduce the resource demands for measuring large sample sizes and reliably characterizing firebrands.
Data Availability
The datasets generated for this study are available on request to the corresponding author.
Author Contributions
FH, BB, and DG performed research under the guidance of AZ and SQ. FH, BB, and AZ worked on data analysis, image analysis, and machine learning algorithms. FH, BB, AZ, DG, and SQ worked on the firebrand generation experiments and manuscript preparation.
Funding
Research funding is provided by the Joint Fire Science Program (JFSP) with project ID # 15-1-04-4. Open access publication fees are provided by the Insurance Institute for Business and Home Safety (IBHS).
Conflict of Interest Statement
The authors declare that the research was conducted in the absence of any commercial or financial relationships that could be construed as a potential conflict of interest.
Acknowledgments
The authors would like to thank the Joint Fire Science Program (JFSP) for sponsoring this project (Project ID # 15-1-04-4). The authors would also like to thank Dr. Christine Alfano for providing the facility to conduct experiments and supplying the samples for this study. The authors appreciate the assistance from Dr. Vahid Hemmati, Gregorio Mesa, Jacob Kadel, Noah Bull, and Ja'Juan Battle from the University of North Carolina at Charlotte. Any opinions, findings, and conclusions or recommendations expressed in this material are those of the authors and do not necessarily reflect the views of the JFSP, the US Department of Agriculture and Department of the Interior.
References
Bernardo, J., Berger, J., Dawid, A., and Smith, A. (1998). Regression and classification using gaussian process priors. Bayesian Statist. 6:475.
Carbonell, J. G., Michalski, R. S., and Mitchell, T. M. (1983). An Overview of Machine Learning. Machine Learning (Palo Alto, CA: Springer), 3–23.
Caton, S. E., Hakes, R. S. P., Gorham, D. J., Zhou, A., and Gollner, M. J. (2017). Review of pathways for building fire spread in the wildland urban interface part i: exposure conditions. Fire Technol. 53, 429–473. doi: 10.1007/s10694-016-0589-z
Clements, H. (1977). Lift-off of Forest Firebrands [Pinus]. USDA Forest Service Research Paper SE (USA) no. 159
Cohen, J. (2008). The wildland-urban interface fire problem. Forest History Today. 11, 20–26. Available online at: https://www.fs.usda.gov/treesearch/pubs/33787
de Vries, P. G. (1986). “Stratified random sampling,” in Sampling Theory for Forest Inventory, ed D. Mandallaz (New York, NY: Springer, 31–55.
Hedayati, F., and Zhou, A. (2017). “Statistical analysis on firebrand generation from structural fuels,” in Proceedings of the 15th International Conference on Fire and Materials (San Francisco, CA), 656–667.
Hosmer, D. W., and Lemeshow, S. (1992). Confidence interval estimation of interaction. Epidemiology 3, 452–456. doi: 10.1097/00001648-199209000-00012
Koo, E, Pagni, PJ, Weise, DR, and Woycheese, JP. (2010) Firebrands and spotting ignition in large-scale fires. Int. J. Wildland Fire 19, 818–843. doi: 10.1071/WF07119.
Koo, E., Linn, R. R., Pagni, P. J., and Edminster, C. B. (2012). Modelling firebrand transport in wildfires using higrad/firetec. Int. J. Wildland Fire 21, 396–417. doi: 10.1071/WF09146
Manzello, S. L., and Suzuki, S. (2013). Experimentally simulating wind driven firebrand showers in wildland-urban interface (WUI) fires: overview of the NIST firebrand generator (NIST Dragon) technology. Procedia Eng. 62 (Suppl. C):91–102. doi: 10.1016/j.proeng.2013.08.047
Manzello, S. L., and Suzuki, S. (2017). Generating wind-driven firebrand showers characteristic of burning structures. Proc. Combust. Instit. 36, 3247–3252. doi: 10.1016/j.proci.2016.07.009
Manzello, S. L., Suzuki, S., and Hayashi, Y. (2012a). Enabling the study of structure vulnerabilities to ignition from wind driven firebrand showers: a summary of experimental results. Fire Safety J. 54:181–196. doi: 10.1016/j.firesaf.2012.06.012
Manzello, S. L., Suzuki, S., Yamada, T., Foote, E. I., Lage, M., Laing, G., et al. (2012b). Exposing Wood Decking Assemblies to Continuous Wind-Driven Firebrand Showers. Gaithersburg, MD: US Department of Commerce, National Institute of Standards and Technology.
Maranghides, A., and Mell, W. (2011). A case study of a community affected by the witch and guejito wildland fires. Fire Technol. 47, 379–420. doi: 10.1007/s10694-010-0164-y
Rasmussen, C. E. (2003). “Gaussian processes in machine learning,” in Summer School on Machine Learning, eds C. E. Rasmussen and C. K. I. Williams (Berlin, Heidelberg: Springer, 63–71.
Rasmussen, C. E., and Williams, C. K. (2006). Gaussian Processes for Machine Learning, Vol. 1. Cambridge: MIT press.
Refaeilzadeh, P., Tang, L., and Liu, H. (2009). “Cross-validation,” in Encyclopedia of Database Systems (New York, NY: Springer), 532–538.
Safavian, S. R., and Landgrebe, D. (1991). A survey of decision tree classifier methodology. IEEE Trans. Syst Man Cyber. 21, 660–674. doi: 10.1109/21.97458
Standohar-Alfano, C., Estes, H., Johnson, T., Morrison, M., and Brown-Giammanco, T. (2017). Reducing losses from wind-related natural perils: research at the IBHS Research Center. Front. Built Environ. 3:9. doi: 10.3389/fbuil.2017.00009
Suzuki, S., Brown, A., Manzello, S. L., Suzuki, J., and Hayashi, Y. (2014). Firebrands generated from a full-scale structure burning under well-controlled laboratory conditions. Fire Safety Journal 63:43–51. doi: 10.1016/j.firesaf.2013.11.008
Suzuki, S., and Manzello, S. L. (2016). Firebrand production from building components fitted with siding treatments. Fire Safety J. 80, 64–70. doi: 10.1016/j.firesaf.2016.01.004
Suzuki, S., Manzello, S. L., and Hayashi, Y. (2013). The size and mass distribution of firebrands collected from ignited building components exposed to wind. Proc. Combust. Insti. 34, 2479–2485. doi: 10.1016/j.proci.2012.06.061
Suzuki, S., Manzello, S. L., Lage, M., and Laing, G. (2012). Firebrand generation data obtained from a full-scale structure burn. Int. J. Wildland Fire 21, 961–968. doi: 10.1071/WF11133
Tohidi, A., kaye, N., and Bridges, W. (2015) Statistical description of firebrand size shape distribution from coniferous trees for use in metropolis monte carlo simulations of firebrand flight distance. Fire Safety J. 77, 21–35. doi: 10.1016/j.firesaf.2015.07.008
Vodvarka, F. (1969). Firebrand Field Studies. Chicago, IL: IIT Research Inst Chicago Ill Engineering Mechanics Division.
Vodvarka, F. (1970). Urban Burns - Full-Scale Field Studies. Chicago, IL: IIT Research Inst Chicago Ill Engineering Mechanics Division.
Williams, C. K., and Rasmussen, C. E. (1996). “Gaussian processes for regression,” in Advances in Neural Information Processing Systems, eds M. C. Mozer, M. I. Jordan, and T. Petsche (NIPS), 514–520. Available online at: https://papers.nips.cc/book/advances-in-neural-information-processing-systems-9-1996
Zhou, K., Suzuki, S., and Manzello, S. L. (2015). Experimental study of firebrand transport. Fire Technol. 51, 785–799. doi: 10.1007/s10694-014-0411-8
Appendix
The details about the partial derivation of skewness is presented below.
Keywords: firebrand, machine learning, Gaussian process regression, image processing, ember, wildfire, WUI
Citation: Hedayati F, Bahrani B, Zhou A, Quarles SL and Gorham DJ (2019) A Framework to Facilitate Firebrand Characterization. Front. Mech. Eng. 5:43. doi: 10.3389/fmech.2019.00043
Received: 06 April 2019; Accepted: 27 June 2019;
Published: 12 July 2019.
Edited by:
Michael John Gollner, University of Maryland, College Park, United StatesReviewed by:
Nigel Berkeley Kaye, Clemson University, United StatesWei Tang, National Institute of Standards and Technology (NIST), United States
Copyright © 2019 Hedayati, Bahrani, Zhou, Quarles and Gorham. This is an open-access article distributed under the terms of the Creative Commons Attribution License (CC BY). The use, distribution or reproduction in other forums is permitted, provided the original author(s) and the copyright owner(s) are credited and that the original publication in this journal is cited, in accordance with accepted academic practice. No use, distribution or reproduction is permitted which does not comply with these terms.
*Correspondence: Aixi Zhou, YXpob3VAbmNhdC5lZHU=