 Grahame B. Douglas
 Yaping He*
- School of Computing, Engineering and Mathematics, Western Sydney University, Penrith, NSW, Australia
In this article, a risk based approach to design for bushfire protection in view of adaptation to global warming is discussed. The concept of design bushfire is explained in an analogy to design flood or design earthquake in terms of event of prescribed return period. In lieu of using the Global Climate Model, the current study is based on the analysis of historical fire weather data from multiple locations in a state wide region. The generalized extreme value (GEV) analysis method is employed to establish the recurrence models for predicting the fire weather index of given return period and the associated fire intensity. To examine the impacts of the climate change, a moving GEV method is utilized to the weather data records over the period of 44 years. The result demonstrated a heterogeneity in the impact of climate change in terms of a given recurrence fire danger index and the potential bushfire severity over the region studied. The implication of this outcome is that the traditional prescriptive approach to design for bushfire protection may not be suited for adaptation to climate change.
Introduction
Bushfires (wildfires or forest fires) can be a more complicated phenomenon than other kinds of natural disasters. For example, unlike tsunami, earthquake or storms where only the natural force is at work, the contributing factors to bushfires include vegetation, weather, topography, and even human activities. Notwithstanding, bushfires possess some similar features when compared with some other natural hazards (such as floods, drought, and heatwaves) in that they are predominantly influenced by weather and climate conditions (Douglas et al., 2015; Steffen et al., 2017). Recent bushfire events in many parts of the world have given strong indications that the global warming is having an impact on the geographical location, frequency, and severity of such disasters (Norway Today, 2018; The Guardian, 2018).
The potential impacts of climate change on natural events such as heat waves, storms, floods and, particularly, bushfires have been the subject of many theoretical and empirical investigations (Kiern et al., 2006; Semenov and Stratonovitch, 2010; Fox-Hughes et al., 2014; Barbero et al., 2015; Ayar et al., 2016; Abatzoglou et al., 2017). These investigations have included the applications of global climatic models (GCM) and other models to predict future scenarios for developing climate change adaptation strategies (Hennessey et al., 2005).
At the international level, the Intergovernmental Panel on Climate Change (IPCC) met and agreed to its 5th Assessment Report which confirms and extends previous concern for global warming and increased losses from natural hazards, including bushfires (IPCC, 2014). In 2018, the IPCC issued its Special Report on Global Warming, warning that major changes in extreme events were likely with temperatures up to and exceeding average increased temperatures of 1.5°C. These reports have given rise to concerns that climate change will have a significant impact on bushfire behavior (Steffen et al., 2018).
When considering the implications of climate change on bushfires, the trends in annual or seasonal frequency of fire and fire severity need to be accompanied by information on recurrence of fire weather. As such, climate change can be translated into changes in fire frequency and severity (Hennessey et al., 2005). These changes are correlated with fire danger indices that incorporate drought as a pre-conditioning factor, and temperature, relative humidity, and wind speeds as ambient conditions (Noble et al., 1980).
Traditional building design practice for bushfire protection has been relying on the so called prescriptive approach (e.g., AS3959, 2018). Even though performance based building regulations have been introduced in many countries in the world since the last quarter of the last century, very little consideration has been given to adaptation strategies to climate change so far as design for bushfire protection is concerned. Recognizing the challenges faced by performance based codes, the idea of risk-informed performance-based building codes was proposed by a number of scholars in recent years (Meacham and Van Straalen, 2018). The hierarchy of the risk-informed performance-based building code is a multi-tiered system which includes the performance criteria based on risk concept and the verification methods. Such a hierarchy gives rise to the need to: (a) establish acceptable risk criteria; and (b) develop appropriate risk assessment or verification methods.
Current risk based approaches consider climatic conditions as being invariant from the past, both spatially and temporally (AS3959, 2018). While climate models can be used to indicatively show that changes in fire weather are likely to occur, there has not been much discussion on verification methods that are ready for use by practitioners and engineers to incorporate the effect of climate change in their design practice for bushfire protection.
In this article, a risk based approach to design for bushfire protection is discussed. The concept of design bushfire is introduced as an analogy to design flood or design earthquake in terms of event of prescribed return period (or annual exceedance probability). The focus is then given to the selection of design bushfires incorporating the effect of climate change. The ultimate aim of the study is to assist in the development of appropriate verification methods for bushfire protection design in adaptation to the global warming.
In lieu of using the GCM, the current study is based on the analysis of historical fire weather data. A number of methods are employed to demonstrate the effect of climate change on fire weather which is characterized with a fire danger index and the associated fire intensity. One of these methods, namely the generalized extreme value (GEV) analysis is employed to establish the recurrence models for predicting the fire weather of given return period. To examine the impacts of the climate change, a moving GEV method is introduced, where the GEV is applied to a series of consecutive timeframes with fixed duration to reveal the changes in the control parameters of the recurrence models. The methods of analysis have been applied to the weather data records of a number of weather districts in the state of New South Wales in Australia for the period of 1972–2015.
Section Bushfire Weather and Global Warming of this paper presents a literature review of fundamental concepts of fire danger index, its correlation with bushfire severity, and design bushfire. The relevant building regulation and design standard for bushfire protection in Australia, as well as the previous studies on the effect of climate change on bushfires are also reviewed. Section Determination of the Impact of Climate Change describes the data and the method used in the current study. The results are presented in section Results. Section Discussion presents the application of the results and the regression analyses to the selection of 50-year recurrence value of fire danger index for determining the design bushfire conditions. The spatial uncertainty in the results is also discussed in this section, followed by conclusion in Section Conclusion. An error analysis and tabulated results are delivered in Appendices A, B, respectively.
Bushfire Weather and Global Warming
Fire Danger Indices and Fire Severity
In many countries, bushfire behavior has been linked to various fire danger rating (FDR) systems, such as those in the USA, Canada, Portugal, and Australia (Sullivan, 2009). Extensive work has been undertaken to relate bushfire risk in Australia (Verdon et al., 2004), Canada (Cruz et al., 2003; Abbott et al., 2007; Beverly and Wotton, 2007), USA (Hardy and Hardy, 2007), and Europe (Fernandes, 2001; Good et al., 2008) to various fire danger index systems, and the correlations between such indices and fire intensity appear useful in determining fire severity.
In Australia, the Forest Fire Danger Index (FFDI) (Luke and Mcarthur, 1978) is commonly used as a measure of fire weather conditions. This index is a dimensionless parameter and is a function of multiple weather variables as shown in the following (Noble et al., 1980):
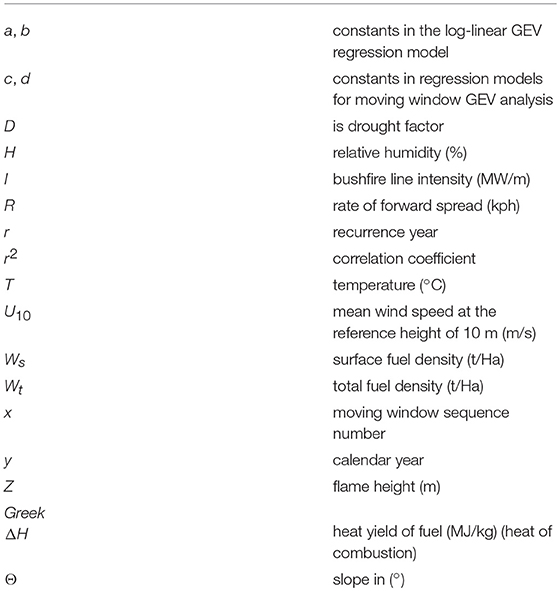
where F stands for FFDI, D is drought factor, H is relative humidity, T is temperature (°C), and U10 is the mean wind speed (km/h) at the reference height of 10 m.
It has been well-established that house loss rate in terms of average loss per bushfire event is related to FFDI (Gibbons et al., 2012). The data presented in Table 1 was extracted from Blanchi et al. (2010). This table illustrates that house losses are relatively rare at Fire Danger Rating below HIGH but increases significantly at VERY HIGH to CATASTROPHIC ranges. These results confirm that bushfire severity can be correlated to FFDI.
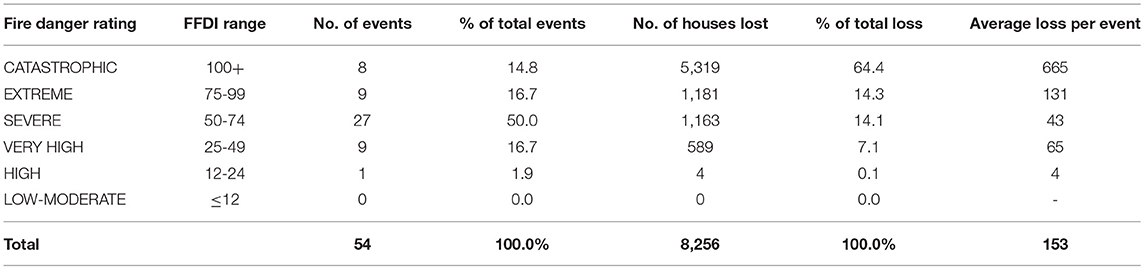
Table 1. House losses of some major bushfire events in Australia (1957–2009) (Blanchi et al., 2010).
The bushfire severity factors such as forward rate of spread, fire intensity, and flame height can be correlated to FFDI by the following empirical equations (Byram, 1959; Noble et al., 1980; AS3959, 2018):
where R is the rate of forward spread (kph), Ws is surface related fuel density (t/Ha) (i.e., surface, near-surface and elevated fuel, AS3959, 2018), Wt is total fuel density (including Ws, bark and canopy fuel), θ is slope in degrees (−15° ≤ θ ≤ 20°), I is bushfire line intensity (MW/m), H the heat yield of fuel (MJ/kg), and Z is flame height (m). For a given design site, the topography information is known. Provided that the fuel density is also known, then the bushfire condition is predominantly determined by FFDI.
It is noted that historically the FFDI value was originally presumed to have an upper limit of 100 which corresponded to the deemed worst possible conditions for bushfire that occurred in the state of Victoria, Australia in 1939 (Sullivan, 2004). However, these conditions and the FFDI 100 limit were exceeded significantly on many occasions (Douglas et al., 2015). In practice, whole integers rather than fractional numbering are used (NSW Rural Fire Service, 2009). Fire agencies across Australia introduced a categorized FDR system to assist the public's perception of bushfire events. This rating system and the corresponding range of FFDI values are illustrated in the first two columns of Table 1.
Design Bushfire in Engineering Approach to Bushfire Protection
Determining the severity of a potential bushfire for land-use planning and construction practice purposes is crucial in the planning assessment processes (Douglas and Ellis, 2000). Property protection measures are related to the concept of “design bushfire” (Ramsay et al., 2006). A design bushfire is a reference bushfire condition against which bushfire protection strategies or engineering solutions are to be developed. The “design bushfire” can be considered as the dimensions and characteristics of a bushfire flame, its initiation, spread, and development, which arises from assumed weather conditions, topography, and fuel (vegetation) in a given regional setting. The design bushfire can therefore be used to determine consequences including radiant heat flux, sustained flame contact, and wind speeds arising from the assumed bushfire event (Douglas and He, 2017).
Obtaining the correct inputs for developing the design bushfire is therefore critical in considering the protection of life and property assets, including resident, and fire fighter safety, protection of homes, and other infrastructure and the need to balance environmental objectives.
Deterministic and empirical approaches to bushfire behavior modeling combined with fire engineering principles have been applied to determine defendable space for fire fighters and building protection in North America (Butler and Cohen, 1998; Gettle and Rice, 2002), in Portugal (Zárate et al., 2008), and in Australia (Douglas and Tan, 2005). These defendable space arrangements are contingent on an appropriate design bushfire.
Attempts have been made in the past to quantify suitable design bushfires based on a frequency distribution profile of fire weather. Andrews et al. (2003) considered the utilization of logistic regression and percentile analysis in describing severe weather. Blanchi et al. (2010) compared bushfire statistics in Australia from 1957 to 2009 with local meteorological conditions to determine conditions under which house loss was likely.
A major difficulty is in defining bushfire scenarios for design and assessment purposes. Inappropriate selections of design bushfire can result in either additional costs to the environment and construction, or the failure of the building systems to withstand the likely fire event. So the question arises, on what basis can the design bushfire be determined.
Risk Based Approach in Verification Method
Natural and man-made disasters often exhibit themselves as random events which cannot be predicted with high certainty (Coles, 2001). Regulations or codes for structural designs against flood and cyclonic wind disasters often use events with known likelihood or frequency as benchmarks. For example, annual exceedance probabilities are provided for structural provisions within the National Construction Code of Australia (NCC, 2019). This has led to the development of performance criteria for various construction arrangements, in the hope of supporting innovation, reducing costs, and improving productivity.
The implementation of performance based building codes, however, have not been without criticism and reservations. The qualitative or descriptive nature of the performance requirements are sometimes criticized for being subject to interpretations and being lack of quantifiable or verifiable performance requirements and criteria (Almgren and Hansson, 2010). To address these concerns, verification methods have been introduced which aim to establish more quantitative approaches to design and construction practice. A recent development by the Australian Building Codes Board is the introduction of a verification method for bushfire protection design into the National Construction Code of Australia (NCC, 2019) in support of the performance requirements for construction in bushfire prone areas. This is seen as a significant advancement toward a risk informed performance based building code and the supporting verification methods (Douglas and He, 2017).
The performance requirement for bushfire protection can be found in Vols. 1 and 2 of the National Construction Code of Australia (NCC, 2019) and is not repeated herein. So as to meet this requirement, the new verification method (NCC, 2019), provides the acceptance criteria in terms of the probability of fire initiation of a building that is exposed to the bushfire conditions with prescribed recurrence. More specifically, the verification method GV5.1 states that fire ignition probability of a building should be <10% when it is exposed to design bushfire conditions with prescribed recurrence based on building importance. For a residential (Class 1) building, the annual exceedance probability is specified in Table G5.1 of the code as 1:50, with higher recurrence levels for other residential and vulnerable types of buildings (NCC, 2019).
The proposed ignition probability limit is essentially a benchmark for acceptable conditional failure probability. The prescription of the recurrence period of bushfire event in effect sets up a reference bushfire condition against which fire protection strategies or solutions are to be developed. This reference bushfire condition is referred as the design bushfire as discussed in the previous subsection.
Generalized Extreme Value Method for Selection of Design Bushfires
As can be seen in subsection Fire Danger Indices and Fire Severity, the fire severity parameters that are used in bushfire protection design are associated with fire weather. The selection of design bushfire conditions is reduced to the selection of appropriate fire weather, fuel, and topography. In accordance with GV5.1, it is eventually reduced to the determination of design bushfire conditions within the prescribed recurrence, or return period.
In statistical terms, the use of a return period (or annual probability of exceedance or APE) is an appropriate mechanism for determining design parameters for rare but extreme conditions (Coles, 2001). As such, the extreme value analysis can be used when considering planning for extreme weather events (Holmes and Moriarty, 1999). Extreme value analysis (EVA) allows, through regression analysis, the prediction of certain conditions for planning, and construction practice purposes. Extreme value analyses are used in determining flood outcomes, temperatures (Dury, 1972), storms (Holmes and Moriarty, 1999), and other natural phenomena.
Katz et al. (2005) noted the potential advantages of extreme value theory when modeling ecological disturbances. Such approaches can be combined with moving average methods to detect shifts among alternate states through non-linear methods (Ives and Dakos, 2012). Where data is of a longer duration (20 years or more), the GEV method was found to usually suffice (Coles, 2001).
Some work has been done recently in relation to fire weather or fire behavior in Australia at the extreme by Douglas et al. (2014). In their study, the prevailing extreme values were determined by comparing different statistical approaches at the 1:50 year recurrence with existing policy values based on previously limited data. However, this work assumed static climatic conditions.
Impact of Climate Change on Bushfires
It has already been ascertained by previous investigations (Hasson et al., 2008) that fire weather conditions, and hence fire behavior will alter in the future as the effects of climate change will become more pronounced over time. However, the possible extent of such changes has not been quantified. Increases in average temperature due to climate change may occur (Hasson et al., 2008) but do not directly indicate increased bushfire severity. Based on the McArthur bushfire behavior model (Noble et al., 1980), it is difficult to ascertain whether or not the recurrence of the EXTREME forest fire danger would differ significantly from the current range without a careful analysis of each variable used to determine FFDI (Hennessey et al., 2005; Lucas et al., 2007; Clarke et al., 2011).
Previous studies (Hennessey et al., 2005; Lucas et al., 2007) described changes in annual average cumulative FFDI (denoted ΣFFDI) under different climate change scenarios using. Hennessey et al. (2005) generated future fire weather data from GCM simulations of FFDI. They then studied the number of events per year which have FFDI ≤ 25 or FFDI ≤ 50 over the period of data and found that there were indeed shifts in both seasonal and annual threshold events, although the numbers vary across the NSW landscape. Lucas et al. (2007) combined the historical weather data and the predicted changes using GCM to study daily-average and monthly-average FFDI, annual average cumulative FFDI (or ΣFFDI), average number of days of FFDI ≤ 25, and average number of days of FFDI ≤ 50 for the period 1973–2007 and predicted increases in these parameters to 2020.
Changes using FFDI as an indicator in modeled scenarios provided some insight into possible shifts in fire weather. However, GCM is not generally accessible and operable by bushfire protection practitioners. It is expensive and time consuming to run and the results may contain large uncertainty. More importantly, straightforward application of GCM do not address climate change impacts in terms of recurrence events.
Summary
Climate change is almost certain to give rise to increased frequency of prolonged periods of adverse bushfire conditions and potentially increased severity of bushfires. The understanding of these changes alone is not sufficient for developing the bushfire scenarios for adaptation strategies in land use planning or construction. The question is how to determine design bushfires, knowing that climate change is making impact on individual fire weather events?
Albeit having been used in the literature to predict future climate conditions, GCM does have limitations in engineering practice to develop design bushfire conditions for the risk based approaches. The historical climate data, in conjunction with a statistical approach to extreme weather events can be used to develop design bushfire scenarios. This approach is more robust than either cumulative FFDI or changes in number of threshold days which by its nature does not consider the distribution of weather data.
Determination of the Impact of Climate Change
Data Source and Distributions
The dataset used in the current study was primarily obtained from Australia's National Historical Fire Weather Dataset program (Lucas, 2009) which covers 77 stations nationwide for the period beginning 1972 to the end of 2015. This dataset contains the evaluated daily FFDI and all the associated weather parameters.
Eight weather stations were identified in the state of New South Wales (NSW) of Australia to illustrate the geographical spread of the impacts of climate change on fire weather. The weather stations and associated weather districts are listed in Table 2 and the geographic distribution of the eight weather stations is depicted in Figure 1.
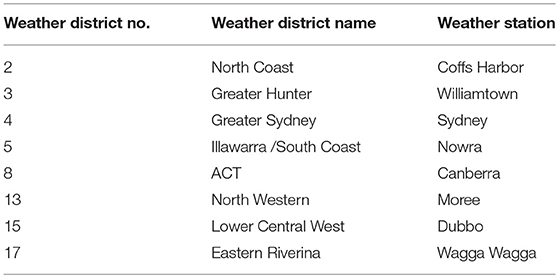
Table 2. NSW weather stations selected in the current study.
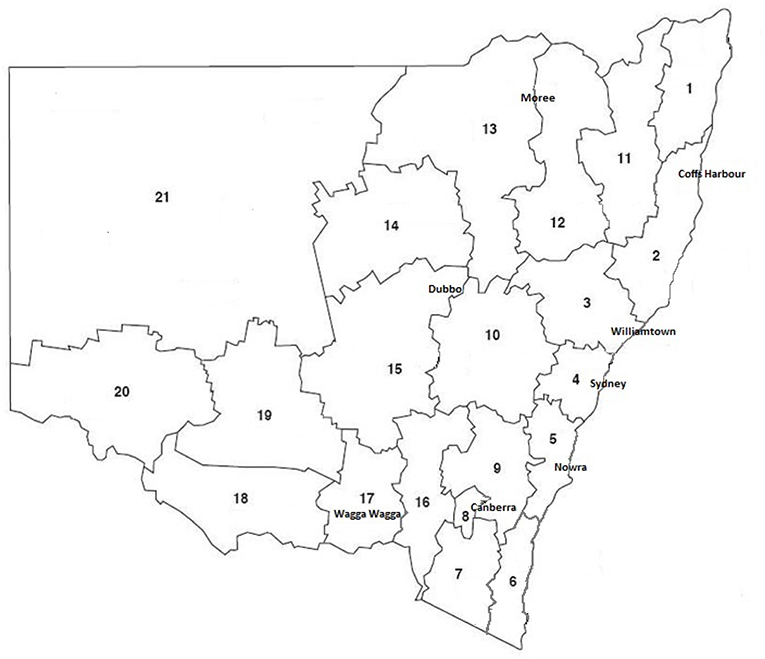
Figure 1. New South Wales Fire Weather Districts and the locations of the eight weather stations involved in the current study. Adapted from NSW Rural Fire Service (2006).
As seen in Equation (1), FFDI is calculated using temperature, relative humidity, wind speed, and daily drought factor. The National Historical Fire Weather Database comprises calculated FFDI based on:
• Daily drought factor (1–10);
• 3:00 p.m. wind speed (km/h, 10 min average at 10 m height);
• 3:00 p.m. relative humidity (%RH); and
• Maximum daily temperature (°C).
Lucas (2009) has quantified some of the errors associated with this dataset, notably that wind speed may have errors associated with changes in instrumentation, changes in station location or changes in recording procedures. The 3:00 p.m. dataset is used due to the long term accumulation of weather station data, although improved technology will allow for a more accurate and continuous daily dataset in the future. Historically, data was collected between 1 and 8 times per day, with 9:00 a.m. and 3:00 p.m. being the most common. As such, the 3:00 p.m. data for relative humidity and wind speed will not necessarily identify the true daily maximum FFDI, which would be ideal for GEV analysis. The deviations in the input parameters from the worst case scenario may raise a concern in relation to the level of uncertainty associated with the calculated FFDI data. A detailed analysis is presented in Appendix A to estimate the level of uncertainty associated with the use of these four weather parameters in calculating FFDI. The result shows that the uncertainty in the recorded FFDI values is in the order of 20%. This is a quite significant error and aligns with the issues considered by Lucas (2009). However, it should be noted that, although drastic, this error consistently leads to under-estimate of FFDI and does not consider the correlations between the contributing variables. It can therefore be concluded that the data is suitable for climatic studies (Lucas, 2009).
Method of Analysis
As reviewed in Subsection Generalized Extreme Value Method for Selection of Design Bushfires, the extreme value analysis has now been adopted for risk based approaches in bushfire design. The collected daily FFDI over the data period of 44 years were subjected to GEV analysis to establish the relationship between FFDI and their return period. The method is based on the work of Makkonen (2006). A detailed description of the application of GEV method to historical weather data can be found in Douglas et al. (2014). From a sufficient length of data, a log-linear model of the form
is established, where r is the return period or recurrence, Fr is the forest fire danger index corresponding to the give recurrence r, parameters a and b are constants obtained from the log-linear regression of GEV result.
In order to reveal the changes in fire weather as the consequence of climate change, an attempt is made in the current study to apply the GEV analysis to the FFDI index subject to a moving 20-year data window over the data period of 1972–2015.
The moving window technique is a simple and widely used technique for local averaging or smoothing in data processing to identify some main features imbedded in otherwise noisy background. It is often referred to as the Savitzky–Golay filter (Chen et al., 2004). The advanced use of such technique can be found in Schulze et al. (2012) for spectral analysis. In the current study, this technique is extended to the GEV analysis whereby the recurrence value of FFDI is modeled on the basis of a relatively small (short) time window of data over a long period of data record. The window is then successively traversed through the entire data record period to reveal the changes in a given recurrence value.
For a finite length of the total data record, there is a trade-off between the window width and the accuracy of the GEV model. Generally speaking, the wider the window width, the better the GEV result. However, the wider window might smooth out the imbedded variations in the change of recurrence value. The 20-year window is considered the minimal number of years required for reasonable accuracy for prediction of recurrence values (see Gumbel, 1958). This width is adopted in the current study.
The window is traversed consecutively year by year for 24 times to cover the entire data span of 44 years. A number of 24 predictive equations in the form of Equation (5) are obtained. These equations are then used to estimate the 50-year recurrence values of FFDI, or F50, of which the variation may indicate the impact of climate change.
The outcome of the moving window GEV analysis is then fitted with three types of regression functions, namely power, linear and logarithm as given in Equations (6–8) to discern the trend of variation:
where c and d are regression constants, x is the period sequence number. For a given calendar year y, x is evaluated according to the following equation:
Results
An analysis was undertaken for the weather data of each of the eight weather stations using the method described in section Method of Analysis. As an example, the daily forest fire danger index extracted from the data sources for Coffs Harbor (D2) for the period of 44 year are plotted in Figure 2. Three data windows among the 24 in total for the moving window GEV analysis are also indicated in this figure. The results of the recurrence forest fire danger index values for a sequence of moving window GEV analysis are presented in Figure 3 showing windows 1, 5, and 13 in the series. The figure also contains the corresponding regression lines as in the form given in Equation (5) from which the F50 value is estimated.
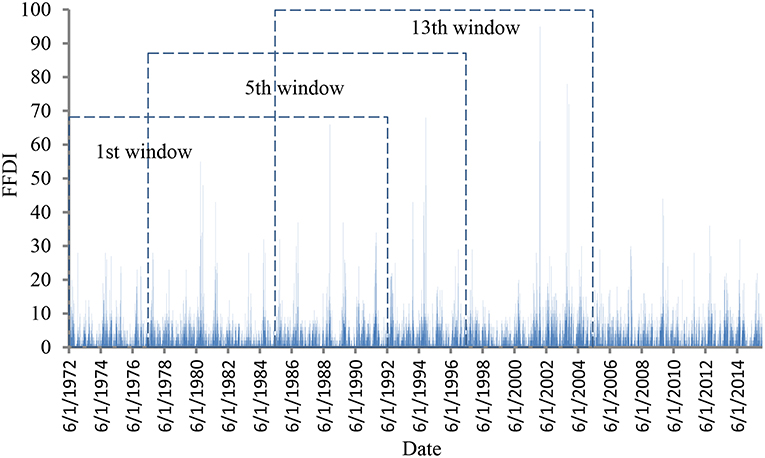
Figure 2. Raw data of FFDI for Coffs Harbor (D2) over the period of 1972–2015 and the 1st, 5th, and 13th moving window for GEV analysis.
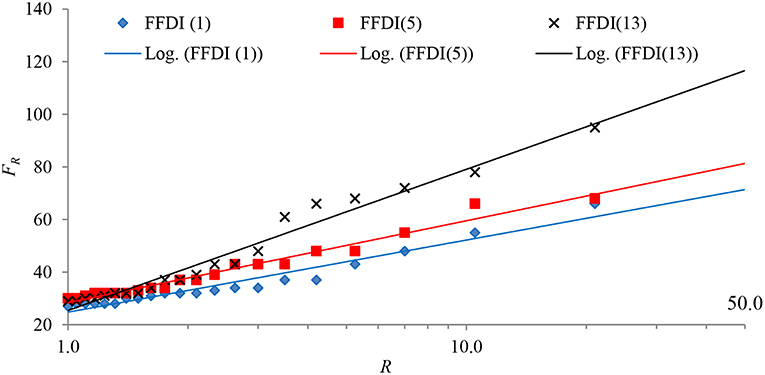
Figure 3. Plots of recurrence FFDI and the log-linear model [Equation (5)] of the 1st, 5th, and 13th moving window for Coffs Harbor (D2).
Twenty-four F50 values are derived from the moving window GEV analysis for each weather district. The results are presented in Figure 4 and tabulated in Table B1 of Appendix B. Also included in Figure 4 are the three regression lines, namely power, linear, and logarithm, of which the regression parameters are listed in Table B2.
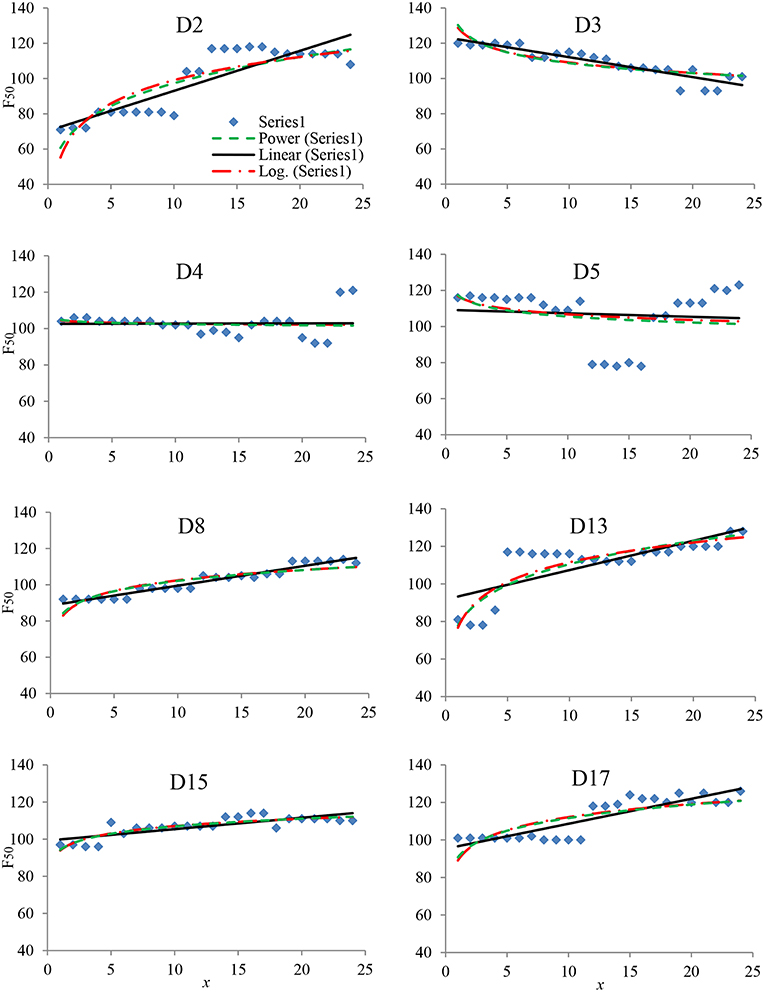
Figure 4. Moving window GEV and regression results for weather stations in the eight districts.
As can be seen, the moving GEV assessment of Coffs Harbor (D2) fire weather data indicates that the 50-year recurrence FFDI values have increased from ~70 in the first period to nearly 120 in the last. The significant jump occurred in the 10th period, or the period including the year 1983 when the historical Ash Wednesday fire event took place (Blanchi et al., 2010). The increases in F50 for D13 and D17 also exhibit stepwise increments at different periods, respectively. The reason for this kind of behavior is not known.
It can also be discerned that the trend in F50 is increasing over the period for the majority of the sites. An exception to this can be found with the Williamtown (D3) weather station, where the trend is clearly declining. The F50 value of Nowra district (D5) is quite peculiar, showing a trace of bath-tab curve. These results indicate that the impact of climate change on fire weather conditions over a portion of the landscape in New South Wales is heterogeneous.
Figure 4 and Table B2 also reveals that, except for districts 4 and 5, the three regression functions generally produce reasonable approximations of variations in F50. On average, the power and logarithm regression functions produce more conservative and, perhaps, more reasonable, estimates of future variations than the linear regression.
Discussion
Determination of Design Bushfire Conditions
To demonstrate the application of the GEV analysis and modeling results the selection of recurrence values of FFDI for determining future design bushfire conditions, a comparison between each of the three regression methods [see Equations (6–8)] is made in Table 3 for the year 2015 and 2025. The parameters in Table B2 were substituted into Equations (6–8) for each of the eight districts investigated.
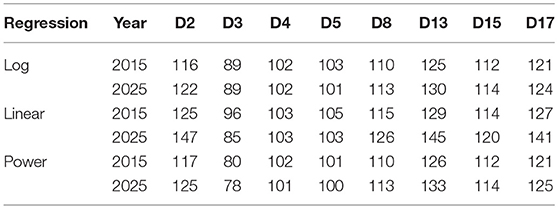
Table 3. Comparison between three regression methods for predicted F50 at eight weather stations.
Equation (7) should be used with caution, as linear regression may not be the most appropriate choice for some cases. For example, the F50 for Coffs Harbor (D2) exhibits stepwise increments over the 24 window periods and remains almost constant for quite a long period since the last change as shown in Figure 4. The use of the linear regression could result in significant over prediction of the future variation in F50. Equations (6, 8) however exhibit a lower level of deviation for all stations, either trending positively or negatively.
In the districts where correlation coefficient is small, the variation in the 50-year recurrence FFDI value is very irregular. The linear form was not a good choice of regression. In such a case, the overall F50 value may be considered for the same purpose. For example, no regular variation trend was discernible in the Sydney district (D4). Then the overall F50 of 116 as given in Appendix B can be used to determine the design bushfire condition. As for D5 (see Figure 4), the latest trend of variation could be taken into account in order to err on the conservative side for the selection of design bushfires.
Uncertainty
The accuracy of the result by the moving window GEV method depends on the total length of the available data and the width of the moving window. Generally, the longer of the total data period and the wider of the moving window are, the better the result. Since the total available data length was 44 years and the minimum 20-year window was used to estimate the F50 values, large uncertainties in the results may expected. Such uncertainties will be based on inference of the likelihood function and therefore consistent at the moving window selected (Coles, 2001).
It should be noted that spatial resolution of the data and the results need to be considered in the design application of the regression models. The limited numbers of weather stations within the landscape can only produce representative data and results for the entire weather districts. Variations within a district are expected as much as variations between districts, which have been revealed in the current study. The spatial distribution of weather stations can therefore also build in some level of uncertainty when considering the role of the design bushfire for a specific development proposal. It is recommendable that for a proposed development, the weather data, and the derived regression models from the nearest weather station be used to determine the recurrence FFDI values for design bushfire selection purpose.
A further issue associated with climate change is the potential impact on fuel accumulation and or curing. It should be noted that bushfire severity is determined not only by fire weather, but also by fuel load which may also be influenced by climate change (DECCW, 2010; Cary et al., 2012). The GEV study of the effect of climate change on fuel load and further on bushfire severity is not within the scope of the current paper.
Conclusion
This study has examined the impact of climate change on the forest fire danger index, which incorporates a range of weather parameters. The design bushfire concept in terms of fire weather conditions and the related fire severity was explained. A novel approach of moving window GEV analysis was applied to historical record of weather data to reveal the variation in the fire danger index with prescribed return period.
It has been found through the application of the GEV analysis to the data from limited number of weather stations selected across the NSW landscape, the impact of the climate change on the design bushfire with nominated return period is heterogeneous and geographically dependent. The trends predicted by the GEV results differ dramatically, from coastal locations to the inland, as well as latitudes from north to south of the State. The severity of the design bushfire would be aggravated in some weather districts by climate change but may be alleviated in other districts or neutral in others.
The moving window GEV analysis method not only revealed the heterogeneity in the impact of climate change on bushfire conditions, it also assisted in the selection of design bushfire conditions within the risk based framework to cater for protections against future bushfire attacks.
Based on the outcome of this research it is recommended that bushfire protection strategies for climate change adaptation should be flexible and take into account the local and regional conditions in order to generate economic benefit as well as provide safety for communities. Because of the limited length of available data and the minimum window width used in the current study, the results of moving window GEV may contain significant uncertainty. Future studies should, if possible, extend the data length and examine the sensitivity to window width.
The current study did not include the impact of climate change on fuel load on which bushfire severity is also dependent. It will be worth investigating this issue for the long term adaptation to climate change.
Author Contributions
GD initiated the study on the topic. He contributed to the work by conducting literature review, collecting data, developing the methodology, and the implementation of it. He started the preliminary draft of the manuscript. YH contributed to the work by providing an outline. He oversaw the progress of the study, refined, and verified the methodology and its implementation. He contributed to the analysis of the results. He drafted 40% of the manuscript.
Conflict of Interest Statement
The authors declare that the research was conducted in the absence of any commercial or financial relationships that could be construed as a potential conflict of interest.
Acknowledgments
The authors wish to acknowledge the constructive comments of the reviewers, which have led to significant improvements in the content of the paper. This work was funded in part by the Australian Research Council grant ARC-DP160103248.
Supplementary Material
The Supplementary Material for this article can be found online at: https://www.frontiersin.org/articles/10.3389/fmech.2019.00027/full#supplementary-material
References
Abatzoglou, J. T., Kolden, C. A., Williams, A. P., Lutz, J. A., and Smith, A. M. S. (2017). Climatic influences on interannual variability in regional burn severity across western US forests. Int. J. Wildland Fire 26, 269–275. doi: 10.1071/WF16165
Abbott, K. N., Leblon, B., Staples, G. C., McLean, D. A., and Alexander, M. E. (2007). Fire danger monitoring using RADASAT1 over Northern Boreal Forests. Int. J. Remote Sens. 28, 1317–1378. doi: 10.1080/01431160600904956
Almgren, E., and Hansson, P. (2010). Finding the Performance in Performance Based Codes-Lesson Learned From the Pre-Study for the Renewal of the Swedish Fire Safety Code due to 2010. 8th Performance-Based Codes and Safety Design Methods. Lund University, Sweden: Society of Fire Protection Engineers.
Andrews, P. L., Loftsgaarden, D. O., and Bradshaw, L. S. (2003). Evaluation of fire danger rating indexes using logistic regression and percentile analysis. Int. J. Wildland Fire 12, 213–226. doi: 10.1071/WF02059
AS3959 (2018). Construction of Buildings in Bushfire-Prone Areas. Standards Australia; SAI Global. Available online at: https://infostore.saiglobal.com/en-au/Standards/AS-3959-2018-122340_SAIG_AS_AS_2685241/
Ayar, P. V., Vrac, M., Bastin, S., Carreau, J., Déqué, M., and Gallardo, C. (2016). Intercomparison of statistical and dynamical downscaling models under the EURO- and MED-CORDEX initiative framework: present climate evaluations. Clim. Dyn. 46, 1301–1329. doi: 10.1007/s00382-015-2647-5
Barbero, R., Abatzoglou, J. T., Larkin, N. K., Kolden, C. A., and Stocks, B. (2015). Climate change presents increased potential for very large fires in the contiguous United States. Int. J. Wildland Fire 24, 892–899. doi: 10.1071/WF15083
Beverly, J. L., and Wotton, B. M. (2007). Modelling the probability of sustained flaming: predictive value of fire weather index components compared with observations of site weather and fuel moisture conditions. Int. J. Wildland Fire 16, 161–173. doi: 10.1071/WF06072
Blanchi, R., Lucas, C., Leonard, J., and Finkele, K. (2010). Meteorological conditions and wildfire-related house loss in Australia. Int. J. Wildland Fire 19, 914–926. doi: 10.1071/WF08175
Butler, B. W., and Cohen, J. D. (1998). Firefighter safety zones: A theoretical model based on radiative heating. Int. J. Wildland Fire 8, 73–77. doi: 10.1071/WF9980073
Byram, G. M. (1959). “Combustion of forest fuels,” in Forest Fire: Control and Use, ed K. P. Davies (New York, NY: McGraw-Hill), 61–89.
Cary, G. J., Bradstock, R. A., Gill, A. M., and Williams, R. J. (2012) “Global change fire regimes in Australia,” in Flammable Australia – Fire Regimes, Biodiversity Ecosystems in a Changing World, eds R. A. Bradstock, A. M. Gill, R. J. Williams (Melbourne, VIC: CSIRO Publishing), 149–169.
Chen, J., Jonsson, P., Tamura, M., Gu, Z., Matsushita, B, and Eklundh, L. (2004). A simple method for reconstructing a high-quality NDVI time series data set based on the Savitzky-Golay filter. Rem. Sens. Environ. 91, 332–344. doi: 10.1016/j.rse.2004.03.014
Clarke, H. D., Smith, P. L., and Pitman, A. J. (2011). Rural signatures of future regional fire weather over south-eastern Australia from global climate models. Int. J. Wildland Fire 20, 550–562. doi: 10.1071/WF10070
Coles, S. (2001). An Introduction to Statistical Modelling of Extreme Values. London: Springer-Verlag.
Cruz, M. G., Alexander, M. E., and Wakimoto, R. H. (2003). Assessing canopy fuel stratum characteristics in crown fire prone fuel types of western North America. Int. J. Wildland Fire 12, 39–50. doi: 10.1071/WF02024
DECCW (2010). NSW Climate Impact Profile: The Impacts of Climate Change on the Biophysical Environment of NSW. Sydney, NSW: Department of Environment, Climate Change and Water. Available online at: https://climatechange.environment.nsw.gov.au/Impacts-of-climate-change/2010-NSW-climate-impact-reporting
Douglas, G., and Ellis, P. (2000). Integrating Land Use Planning and Construction Standards for Protection for Bushfires in New South Wales – A Model. Christchurch: Bushfire 2000.
Douglas, G., and He, Y. (2017). Moving Forward on a Verification Method for Bushfire Protection Under the National Construction Code, Quantify Fire Safety - Fire Australia 2017. Australia Fire Protection Association. Available online at: http://www.fpaa.com.au/media/229666/d2-fse-p5-douglas.ppt.pdf
Douglas, G., He, Y., Yang, X., and Morris, E. (2015). “Construction practice and planning in bushfire prone environments,” in Research Proceedings of the Natural Hazards and Bushfire Cooperative Research Centre & AFAC Conference (Adelaide, SA). Available online at: https://www.bnhcrc.com.au/events/2015-annual-conf
Douglas, G., He, Y. Yang, X., and Morris, E. C. (2014). “Use of extreme value analysis in determining annual probability of exceedance for bushfire protection design,” in Proceedings of the 11th International Symposium on Fire Safety Science, ed P. Van Hees (Christchurch: International Association of Fire Safety Science; University of Canterbury), 1379–1392.
Douglas, G., and Tan, Z. (2005). Integrating Site Assessment and Performance Planning Outcomes for Bushfire Prone Areas at Planning for Natural Hazards - How We Can Mitigate the Impacts? University of Wollongong.
Dury, D. H. (1972). High temperature extremes in Australia. Ann. Assoc. Am. Geogr. 62, 388–400. doi: 10.1111/j.1467-8306.1972.tb00871.x
Fernandes, P. A. M. (2001). Fire Spread prediction in shrub fuels in Portugal. Forest Ecol. Manage. 144, 67–74. doi: 10.1016/S0378-1127(00)00363-7
Fox-Hughes, P., Harris, R., Lee, G., Grose, M., and Bindoff, N. (2014). Future fire danger climatology for Tasmania, Australia, using a dynamically downscaled regional climate model. Int. J. Wildland Fire. 23, 309–321. doi: 10.1071/WF13126
Gettle, G., and Rice, C. L. (2002). “Criteria for determining the safe separation between structures and wildlands,” in Forest Fire Research & Wildland Fire Safety, ed D. X. Viegas (Rotterdam; Holland: Millpress), 18–23.
Gibbons, P., van Bommel, L., Gill, M., Cary, G. J., Driscoll, D. A., Bradstock, R. A., et al. (2012). Land management practices associated with house loss in wildfires. PLoS ONE 7:e29212.
Good, P., Moriondo, M, Giannakopoulos, C., and Bindi, M. (2008). The meteorological conditions associated with extreme fire risk in Italy and Greece: relevance to climate model studies. Int. J. Wildland Fire. 17, 155–165. doi: 10.1071/WF07001
Hardy, C. C., and Hardy, C. E. (2007). Fire danger rating in the United States of America: an evolution since 1916. Int. J. Wildland Fire 16, 217–231. doi: 10.1071/WF06076
Hasson, A. E. A., Mills, G. A., Timbal, B, and Walsh, K. (2008). Assessing the Impact of Climate Change on Extreme Fire Weather in Southeast Australia. CAWCR Techical Report 007, The Centre for Australian Weather and Climate Research.
Hennessey, K., Lucas, C, Nicholls, N, Bathols, J, Suppiah, R, and Ricketts, J. (2005). Climate Change Impacts on Fire-Weather in South-East Australia. Melbourne, VIC: CSIRO.
Holmes, J. D., and Moriarty, W. W. (1999). Application of the generalized Pareto distribution to extreme value analysis in wind engineering. J. Wind Eng. Ind. Aerodyn. 83, 1–10. doi: 10.1016/S0167-6105(99)00056-2
IPCC (2014). “Climate change 2014: synthesis report,” in Contribution of Working Groups I, II and III to the Fifth Assessment Report of the Intergovernmental Panel on Climate Change, eds R. K. Pachauri and L. A. Meye (Geneva: IPCC), 151.
Ives, A. R., and Dakos, V. (2012). Detecting dynamical changes in nonlinear time series using locally linear state-space models. Ecosphere 3, 1–15. doi: 10.1890/ES11-00347.1
Katz, R. W., Brush, G. S., and Parlange, M. B. (2005). Statistics of extremes: modelling ecological disturbances. Ecology 86, 1124–1134. doi: 10.1890/04-0606
Kiern, A., Stewart, F., and Danielle, V. (2006). Climate variability in the land of fire and flooding rain. Austr. J. Emerg. Manag. 21, 52–56. Available online at: https://search.informit.com.au/documentSummary;dn=158193333195283;res=IELHSS
Lucas, C. (2009). On developing a historical fire weather dataset for Australia. Austr. Meteorol. Oceanogr. J. 60, 1–14. doi: 10.22499/2.6001.001
Lucas, C., Hennessey, K, Mills, G, and Bathols, J. (2007). Bushfire Weather in Southeast Australia: Recent Trends and Projected Climate Change Impacts. Melbourne, VIC: CSIRO and Bushfire CRC.
Luke, R. H., and Mcarthur, A. G. (1978). Bushfires in Australia. Canberra, ACT: Australian Government Publishing Service.
Makkonen, L. (2006). Plotting positions in extreme value analysis. J. Appl. Meteor. Climatol. 45, 334–340. doi: 10.1175/JAM2349.1
Meacham, B. J., and Van Straalen, I. J. (2018). A socio-technical system framework for risk-informed performance-based building regulation. Build. Res. Inf. 46, 444–462. doi: 10.1080/09613218.2017.1299525
NCC (2019). National Construction Code of Australia, Vol. 1 and 2, Building Code of Australia. Canberra, ACT: Australian Building Code Board. Available online at: https://ncc.abcb.gov.au/ncc-online/NCC
Noble, I. R., Bary, G. A. V., and Gill, A. M. (1980). McArthur's fire-danger meters expressed as equations. Austr. J. Ecol. 5, 201–203. doi: 10.1111/j.1442-9993.1980.tb01243.x
Norway Today (2018). Nearly 300 Forest Fires So Far This Year. Available online at: http://norwaytoday.info/news/nearly-300-forest-fires-far-year/ (accessed 29 April, 2019).
NSW Rural Fire Service (2009). Fire Danger Ratings [Brochure]. Available online at: https://www.rfs.nsw.gov.au/__data/assets/pdf_file/0005/9428/Fire-Danger-Ratings-Factsheet.pdf (accessed 29 April, 2019).
Ramsay, G. C., Wynn-Jones, M, Wood, C, Douglas, G, and Robeson, P. (2006). “The Australian bushfire safety engineering guidelines,” in Proceedings of Fire Safety Engineering Conference (Gold Coast, QLD: Society of Fire Safety).
Schulze, H. G., Foist, R. B. Okuda, K., Ivanov, A., and Turner, R. F. B. (2012). A small-window moving average-based fully automated baseline estimation method for Raman spectra. Appl. Spect. 66, 757–764. doi: 10.1366/11-06550
Semenov, M. A., and Stratonovitch, P. (2010). Use of multi-model ensembles from global climate models for assessment of climate change impacts. Clim. Res. 41, 1–14. doi: 10.3354/cr00836
Steffen, W., Hughes, L., Alexander, D., and Rice, M. (2017). Cranking Up the Intensity: Climate Change and Extreme Weather Events. Climate Council. Available online at: https://www.climatecouncil.org.au/resources/cranking-intensity-report/
Steffen, W., Rice, M., Hughes, L., and Dean, A. (2018). The Good, the Bad and the Ugley: Limiting Temperature Rise to 1.5°C. Climate Council. Available online at: https://www.climatecouncil.org.au/resources/limiting-temperature-rise/
Sullivan, A. L. (2004). Nature of Severe Fire Events. Client Report for Fire Management Unit, Department of Urban Services ACT Government (CSIRO: Canberra, ACT).
Sullivan, A. L. (2009). Wildland surface fire spread modelling, 1990-2007. Part 2: Empirical and quasi-empirical models. Int. J. Wildland Fire 18, 369–386.
The Guardian (2018). Sweden Calls for Help as Arctic Circle Hit by Wildfires. Available online at: https://www.theguardian.com/world/2018/jul/18/sweden-calls-for-help-as-arctic-circle-hit-by-wildfires (accessed December 5, 2018).
Verdon, D. C., Kiem, A. S., and Franks, S. W. (2004). Multi-decadal variability of forest fire risk-eastern Australia. Int. J. Wildland Fire 13, 165–171. doi: 10.1071/WF03034
Zárate, L. J., Arnaldos, J., and Casal, J. (2008). Establishing safety distances for wildland fires. Fire Safety J. 43, 565–575. doi: 10.1016/j.firesaf.2008.01.001
Nomenclature
Keywords: adaptation, design bushfire, extreme value, heterogeneous, recurrence, severity, weather
Citation: Douglas GB and He Y (2019) Design Bushfire Selection for Bushfire Protection in Adaptation to Global Warming. Front. Mech. Eng. 5:27. doi: 10.3389/fmech.2019.00027
Received: 01 February 2019; Accepted: 23 April 2019;
Published: 21 May 2019.
Edited by:
Michael John Gollner, University of Maryland, United StatesReviewed by:
Wei Tang, National Institute of Standards and Technology (NIST), United StatesAlexis Cantizano, Comillas Pontifical University, Spain
Copyright © 2019 Douglas and He. This is an open-access article distributed under the terms of the Creative Commons Attribution License (CC BY). The use, distribution or reproduction in other forums is permitted, provided the original author(s) and the copyright owner(s) are credited and that the original publication in this journal is cited, in accordance with accepted academic practice. No use, distribution or reproduction is permitted which does not comply with these terms.
*Correspondence: Yaping He, eS5oZUB3ZXN0ZXJuc3lkbmV5LmVkdS5hdQ==