- 1Institute of Structural Material Failure and Strengthening Technology, Ningbo Polytechnic, Ningbo, Zhejiang, China
- 2School of Architectural Engineering, Hunan Institute of Engineering, Xiangtan, China
- 3School of Civil Engineering, Fujian University of Technology, Fuzhou, China
Engineered Cementitious Composite (ECC) material, as a hybrid material, also has uncertainties. In addition, the shear failure mechanism of reinforced ECC (R-ECC) member is different from that of ordinary reinforced concrete (RC) member, and a new material partial factor of ECC is needed. This paper conducted experiments for the statistical mechanics of ECC strength. The shear failure test data of 36 R-ECC members were collected, and four representative bearing capacity calculation models were also collected and assessed. Then, the limit state function of the shear capacity of R-ECC beams was derived, and the reliability indexes were calculated. To evaluate the ECC material partial factor reasonably, it was calibrated. The results indicate that ECC strength obeys a normal distribution, and the coefficient of variation can be taken as 6.0%. The calculated reliability index will increase with the increase of the material partial factor and the increase of the ratio k between dead load and live load. Considering the different k values comprehensively, for the guidelines GB 50068-2018, CSA S806, ACI 440.2R, CIDAR, fIB TG 9.3 and UK TR 55, the recommended values for the material partial factor are 1.20, 1.10., 1.15, 1.55, 1.05, and 1.05, respectively.
1 Introduction
Nowadays, the most often utilized material in engineering is concrete. It is very strong, but it is not very ductile. Consequently, a lot of researchers were thinking about incorporating fiber materials, like carbon, basalt, steel and plant fiber, into concrete. ECC material is a type of fiber-reinforced concrete. As demonstrated in Figure 1, when the initial crack forms, the load can still increase and a huge number of small cracks will emerge before the material ultimately fails. This significantly enhances the deformation performance of ECC. Its ultimate tensile strain is 300–1,000 times that of ordinary concrete and ordinary fiber reinforced concrete (Gu et al., 2022).
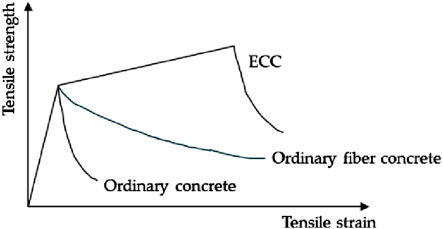
Figure 1. Typical tensile stress-strain curves of ECC, ordinary fiber concrete and ordinary concrete.
Therefore, many scholars have conducted researches on ECC components, for example, in the work of Kang et al. (2017), to describes the shear strength of engineered cementitious composites, twelve push-off tests were carried out on conventional concrete, mortar and ECC specimens. The creation and performance assessment of a new high performance composite flooring system featuring cutting-edge, environmentally friendly, and economically viable ECC was presented by Hossain et al. (2016). The seismic behavior of H-steel reinforced ECC short columns has been studied by the combined constant axial compression and lateral cyclic load, as Zhang et al. (2019) described.
Normal section bending failure and oblique section shear failure are the two primary forms of failure for reinforced concrete (RC) bending components in the final bearing capacity state. One of these is shear failure, which typically occurs abruptly and exhibits no failure indicators. Therefore, it is standard practice in structural design to ensure that the components have the capacity to support excess shear. When calculating the shear bearing capacity of diagonal sections of components, the plane section assumption is no longer applicable, which makes the shear problem difficult. Different guidelines from various countries have also provided completely different calculation methods, and the calculation methods are based on a combination of theory and experiment. To study the calculation method of shear bearing capacity of reinforced ECC (R-ECC) components, scholars have also conducted a series of studies. A well-designed testing strategy that included continuous strain quantification along the stirrups was employed in the work of Gu et al. (2022) to accurately estimate Vc and Vs. as well as their increase during the loading.
Arulanandam et al. (2022) used in-depth analytical and finite element (FE) methodologies to discuss the performance of R-ECC beams under shear, both with and without transverse reinforcements. The shear behavior of large-scale R-ECC beams reinforced with various fiber kinds was assessed by Ismail and Hassan (2021). Hossain et al.'s research (Hossain et al., 2020) examined the shear performances of hybrid composite beams, which are composed of two separate layers of self-consolidating concrete (SCC) and ECC. The findings of an experimental study on the flexural and shear behaviors of plain and reinforced polyvinyl alcohol-ECC beams were reported in Meng et al.'s research (Meng et al., 2017). An experimental evaluation of the shear behavior of beams made of steel R-ECC was reported by Paegle and Fischer (Paegle and Fischer, 2016). The shear behavior of reinforced ultrahigh toughness ECC beams without transverse reinforcement was examined by Xu et al. (2012).
Actual constructions and ideal approaches differ in a few ways, and these discrepancies can be attributed to several uncertainties such as material strength, computation mode, load, etc. In order to guarantee that the structure possesses adequate safety reliability, the majority of nations employ the Limit State Method for component design. The reliability index serves as an indicator for assessing the likelihood of component failure.
The high-strength steel reinforced concrete beam (HSSRCB) limit state design technique, which is practical for the adoption and popularization of HSSR, was proposed by Zhang et al. (2022) and is based on reliability analysis. Six design recommendations for concrete structures shear enhanced with fiber reinforced polymer (FRP) have been evaluated based on the load and resistance factor design approach philosophy, according to Huang et al. (2023) investigation into the dependability level of these guidelines. A statistical and reliable evaluation for designing hybrid FRP/steel-RC beams under flexure over a global experimental database was given by Tarawneh et al. (2024). The dependability of the flexural capacity prediction models for ultra-high performance concrete (UHPC) beams was examined by Feng et al. (2024).
Similarly, as a mixed material, ECC also has significant variability. To provide reasonable material partial factor for R-ECC beams, this paper collects and compares the uncertainties of various bearing capacity calculation models, thus, a computational model which is most suitable for reliability analysis will be selected. In order to solve the problem that the uncertainty of the calculation model does not obey the conventional distribution, the linear moment method is also used to generate random samples, and this method is simple and does not require distribution assumption. In addition, since the load partial factor has a great influence on the reliability index, the reliability index of the load partial factor given in different guidelines will be calculated separately. Finally, calibration method will be used to select the optimal material partial factor of ECC strength. The flowchart of this work can be seen in Figure 2. The research work in this paper will provide reference for the design and application of reinforced ECC structures.
2 Experimental study on statistical characteristics of ECC
ECC is a hybrid material with significant discreteness, which can affect the safety and reliability of R-ECC structures. The strength discreteness of ECC materials will be conducted. The raw materials used include P.O. 42.5 cement, Grade II fly ash, quartz sand, silica fume, high-efficiency water reducing agent and PVA short cut fibers. Among them, the length of PVA fiber was 12 mm, and its volume fraction was 2%. The mix proportion is shown in Table 1, which includes three kinds of mix proportion, and 30 test blocks were made for each mix proportion.
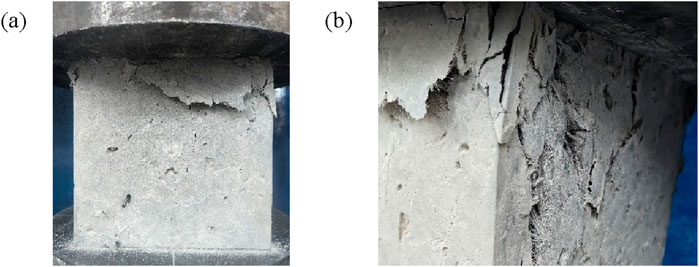
The failure mode of ECC under compression is shown in Figure 3. The ECC concrete first experienced local cracking under compression, and finally experienced overall crushing, without obvious sudden brittle fracture throughout the process. From Figure 3B, it can be seen that there were a large number of fibers between the cracks, which can still play a bridging role after the concrete cracks, thereby improving the toughness of the concrete. The experimental research in this paper is mainly to obtain the statistical characteristics of strength of ECC material. More information about the macro and micro fracture mechanism of ECC materials can be found in these literature (Ismail and Hassan, 2021; Huang et al., 2020).
The total compressive strength of the three ECC mix proportions is shown in Figure 4, where the upper and lower red lines represent a 95% guarantee rate, which is obtained using the mean ±2 times the standard deviation. It can be seen that the strength of ECC-1 mix is between 30 and 40 MPa, ECC-2 mix is between 35 and 45 MPa, and ECC-3 mix is between 38 and 52 MPa. Overall, there is a certain degree of variability in each mix proportion.
The Kolmogorov-Smirnow hypothesis (K-S) test was used to determine the distribution of the sample. It was assumed that the sample obeys a normal distribution, and its mean and standard deviation were consistent with the experimental samples. The test results are shown in Table 2. It can be seen that the coefficients of variation (COV) of three kinds of sample are 5.9%, 5.5%, and 6.7%, respectively. The hypothesis test results are all 0, indicating that all three kinds of sample do not reject the hypothesis, and can be considered to obey a normal distribution.
The comparison between the cumulative distribution function (CDF) curves of the three mix proportions and the normal distribution is shown in Figure 5. It can be seen that the CDF curves of the experimental samples are close to those of the normal distribution samples, further proving that the experimental samples follow a normal distribution. The COV for the three mix proportions is 6.0%, and this is very close to the suggestion value in guideline JSCE (2008), and this COV will be used for subsequent reliability analysis.
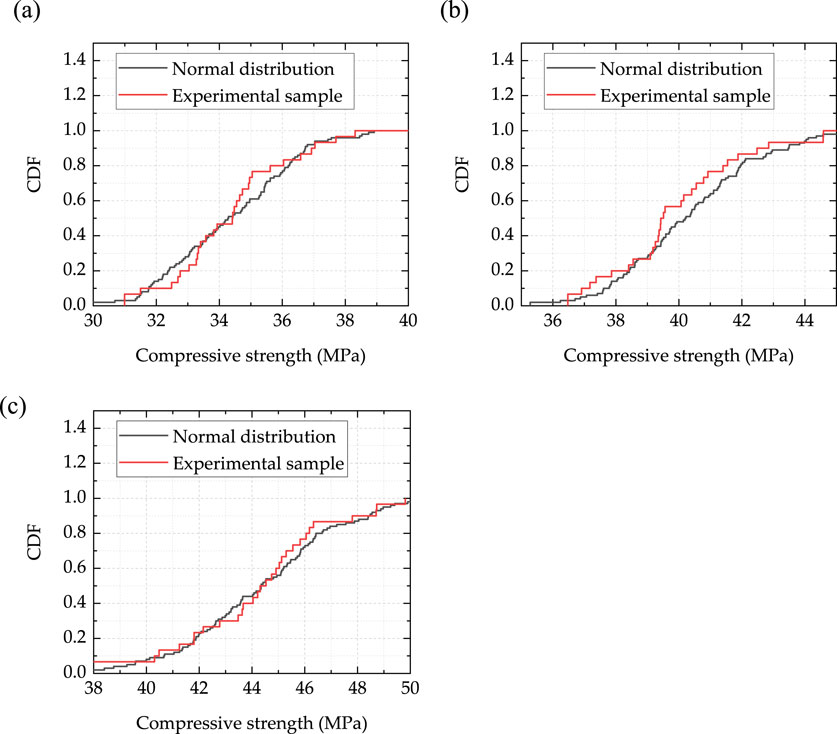
Figure 5. Comparison of CDF between experimental samples and normal distribution: (A) ECC-1; (B) ECC-2; (C) ECC-3.
3 Calculation model and evaluation of bearing capacity
3.1 Bearing capacity model
To provide a simple calculation method for the shear bearing capacity of beams, many countries and scholars have proposed calculation models. Four influential models were collected, including two types. The first type was the shear bearing capacity of ordinary RC members, including the Chinese standard GB20010-2010 (Code for design of concrete structures, 2010); The second type was the shear bearing capacity of R-ECC members, which includes Japanese standard JCSE 08 (JSCE Japan Society of Civil Engineers, 2008), Hou model (Hou et al., 2014), and Gu model (Gu et al., 2022).
3.1.1 GB20010-2010 model
The model suggested in Chinese standards GB20010-2010 (Code for design of concrete structures, 2010) considers the contribution of concrete tensile strength and stirrup reinforcement, as well as the influence of shear span ratio, and it can be written as Equation 1,
where ft denotes tensile strength of concrete; b and h0 denote width and effective height of section respectively; λ denotes shear span ratio; Av, fyv and s denotes the section area, strength and spacing of stirrup.
3.1.2 JCSE 08 model
JSCE 08 (JSCE Japan Society of Civil Engineers, 2008), a guideline for the design and construction of high performance fiber-reinforced cementation composites by the Japan Civil Engineering Society, adopts the classic 45-degree critical oblique crack assumption, and considers that all the hovers within the critical shear crack range yield, and the shear capacity of R-ECC concrete beams can be calculated according to Equations 2–5,
where ρ1 denotes longitudinal reinforcement ratio,
3.1.3 Hou model
Hou et al. (2014) proposed an empirical model based on the test results, which believed that contribution of ECC to shear resistance would decrease with the increase of stirrup ratio, as follows Equations 6–11,
3.1.4 Gu model
Gu et al. (2022) established a reasonable and accurate calculation model of shear capacity based on the truss-press bar shear transfer mechanism in R-ECC beams. At the same time, the shear test database of R/ECC beam was established, and the simple calculation formula of shear capacity of R/ECC beam was proposed through nonlinear regression analysis, and it can be written as Equation 12,
where ρt denotes stirrup ratio and fyv denote the strength of stirrup rebar.
3.2 Date collection
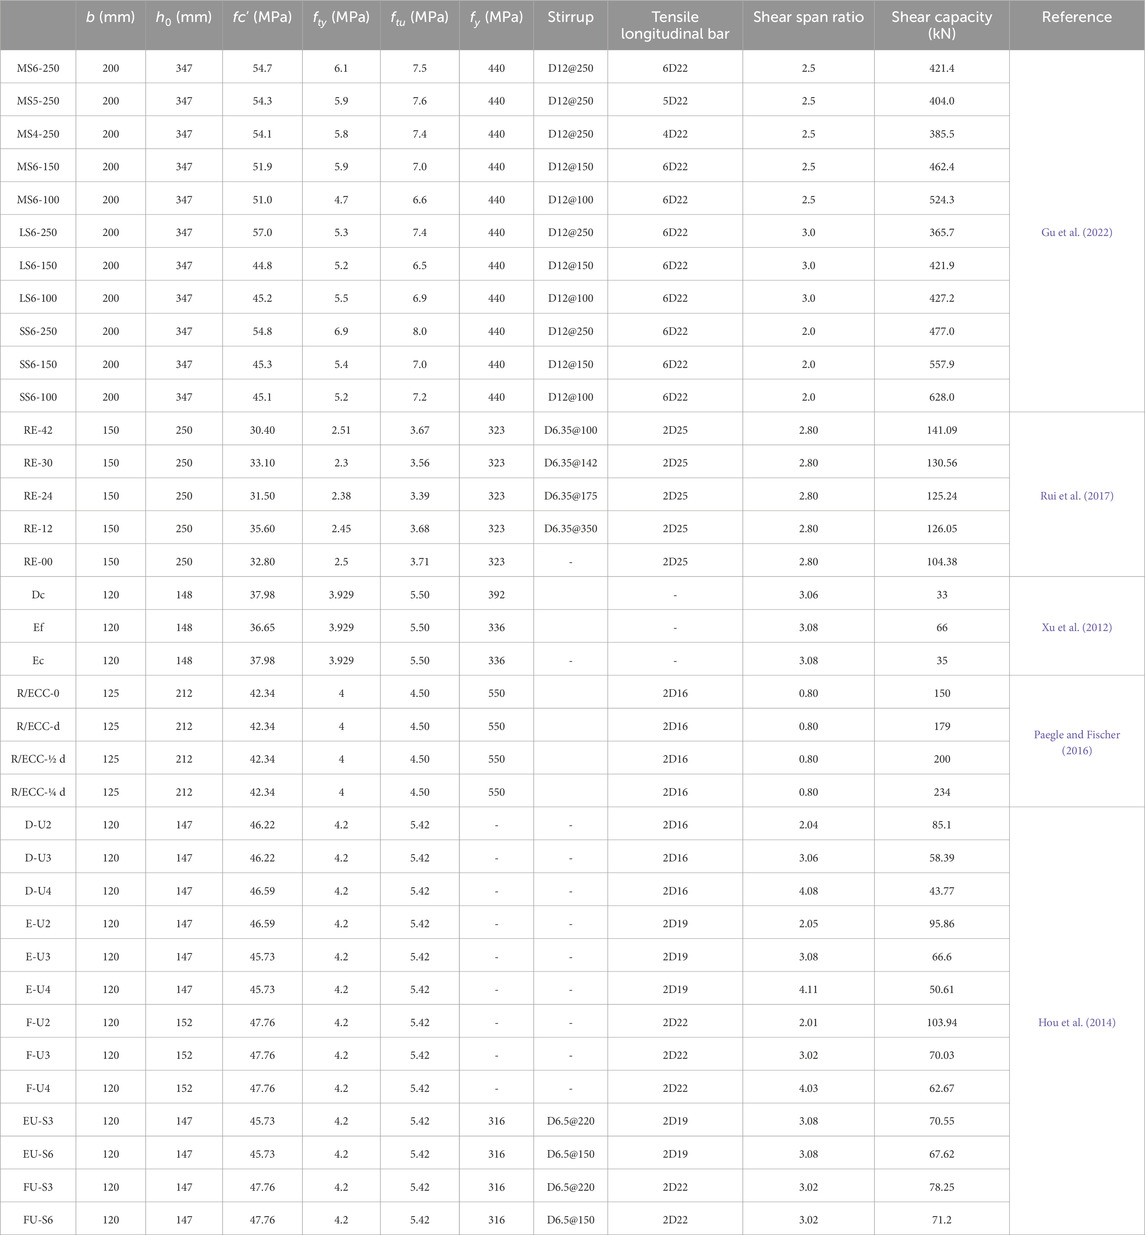
In order to assess the above models, 36 specimens in published literature were collected and sorted out, as shown in Table 3.
3.3 Calculation model uncertainty and assessment
GB20010-2010 model, JCSE 08 model, Hou model and Gu model were respectively used to calculate the shear capacity of the components in Table 3. The calculation results of the model were compared with the test results as shown in Figure 6, where Vu,pre represents the calculation results of the model, and Vu,exp represents the test results. It can be seen that the calculated results of GB20010-2010 model are close to the experimental results. The calculation results of JCSE 08 model are generally greater than the experimental results, and only a few models are less than the experimental values, indicating that the calculation results of the model are relatively conservative. Most of the calculation results of Hou model are near the test value, and some of the calculation results are greater than the test value. Most of the calculated results of Gu model are near the test, and some of the calculated results are greater than the test values.
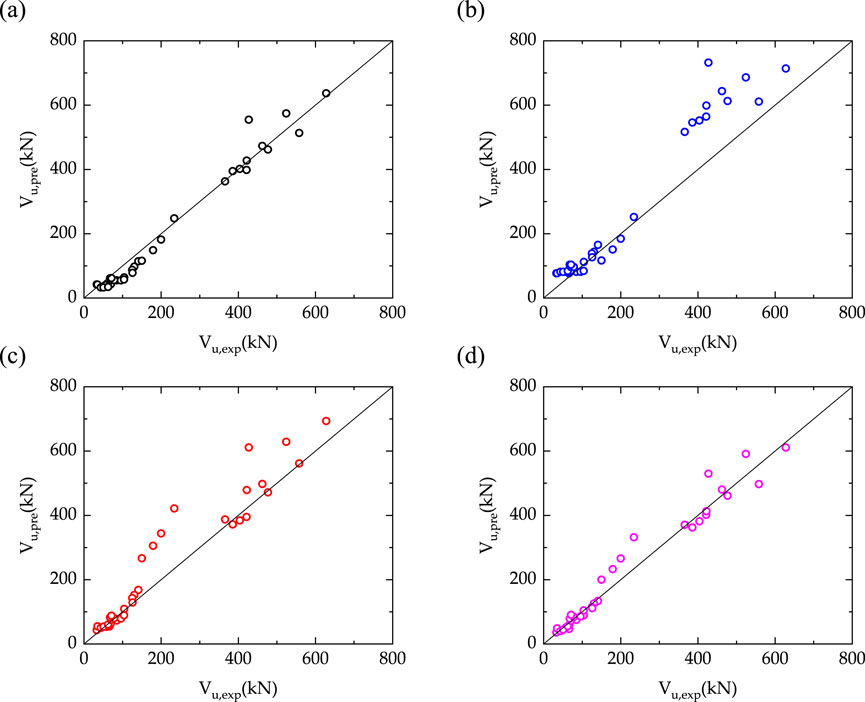
Figure 6. Comparison between the calculated results and the measured values: (A) GB50010-2010 model; (B) JCSE-08 model; (C) Hou model; (D) Gu model.
In order to better evaluate the model and apply its error in reliability analysis, the expression of model error μ was established as Equation 13,
The model errors were statistically analyzed, and the results are shown in Figure 7. It can be seen that the mean value of model error of GB20010-2010 model are 1.2553 and coefficient of variation (COV) is 0.0925, which approximate follows normal distribution on the whole. The mean value of error of the JCSE-08 model is 0.8233 and the COV is 0.0413, which follows the normal distribution. The mean value of error of Hou model is 0.9176 and COV is 0.0336, which did not follow normal distribution on the whole. The mean value of error of the Gu model is 0.9918 and the COV is 0.0200, which does not follow the normal distribution on the whole. On the whole, the mean value of the calculated results of Gu model is closest to 1.0, and its COV is the smallest. In other words, Gu model has the best accuracy and discreteness when used to evaluate the bearing capacity. Therefore, Gu model will be adopted in the subsequent reliability analysis.
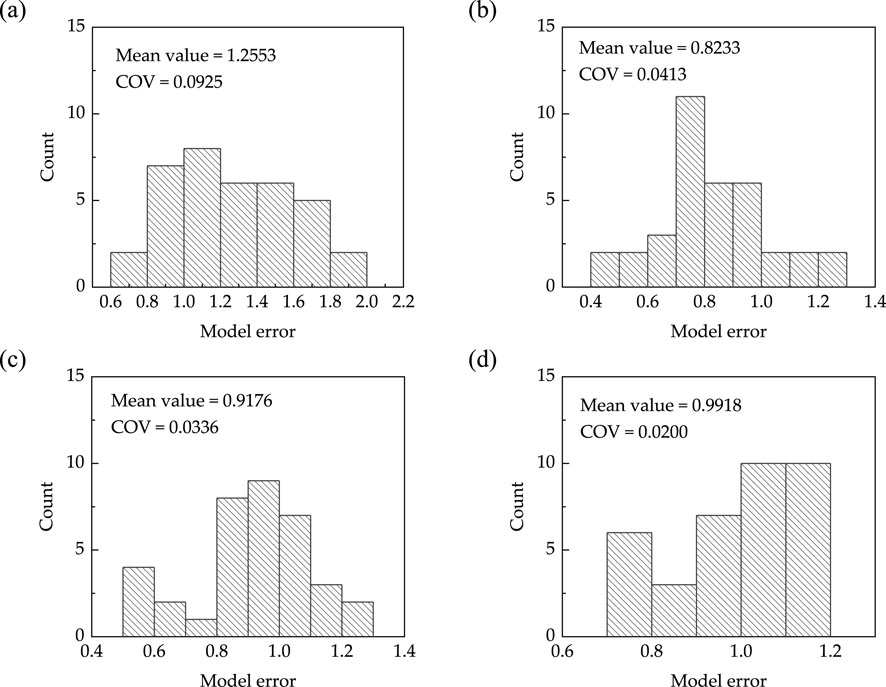
Figure 7. Model error distributions: (A) GB50010-2010 model; (B) JCSE-08 model; (C) Hou model; (D) Gu model.
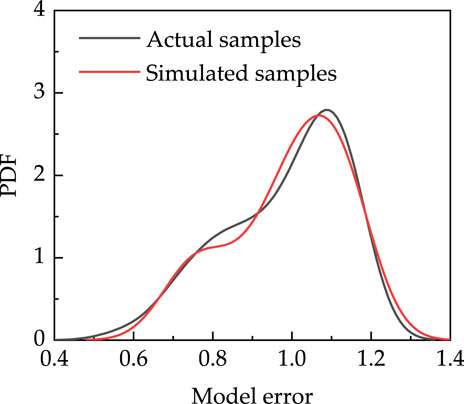
As can be seen from the statistical graph calculated by Gu model in Figure 7, model errors do not follow normal distribution and lognormal distribution, so it is unreasonable to regard them as normal distribution or lognormal distribution in reliability analysis. For such statistical data that do not conform to conventional random distribution, linear statistical moment method can be used to simulate data samples (Zhang et al., 2022; Tong et al., 2021). The first four linear moments of the model error were 0.9917, 0.796, −0.0155 and 0.0035, respectively. The sample of the model error can be obtained through numerical simulation, and the comparison the probability density function (PDF) of simulated sample actual sample is shown in Figure 8. As a whole, the simulation result is very close to the PDF curve of the actual sample, and the validity of the simulation results is proved.
4 Reliability analysis method and random parameters
4.1 Analytical method
4.1.1 Design route of limit state method
Dead load effect (SG) and live load effect (SQ) are included in the load effect, which is often computed first in structural design. The design guidelines prescribe the corresponding dead load partial factor γG and live load partial factor γQ to ensure the reliability of the structure because the load effect is highly unknown. This can be expressed as Equation 14:
The structural member’s parameter design can then be completed in accordance with the load effect S, which takes into account the partial factor γm of the primary material parameters. For instance, in GB50010-2010, the material partial factor for ordinary concrete strength is 1.41, and the material partial factor for ordinary steel bar is 1.11.
After considering the partial factors of material and load, the structural component parameters can be designed. According to the findings in sub-section 2.3, the resistance (i.e., the shear capacity of R-ECC beam) can be calculated by using the Gu model, that is, the corresponding shear capacity Vu can be calculated using Equation 12. The bearing capacity of the structural member should meet the following formula,
4.1.2 Reliability index calculation
There was no specific load effect, and all the variables were assumed in this work. In this instance, the default calculation of the structural resistance could be precise. The most ideal situation from an economic standpoint is one in which the load effect and the resistance are totally constant, hence the actual load effect can be written as Equation 16,
It should be noted that there are no random variables in the above equation. Part of the Vu is used to resist the dead load effect, denoted Vu,G, and the other part is used to resist the live load effect, denoted Vu,Q. When the load partial factor is considered, the actual resistance can be represented as Equation 17,
Assuming the ratio of dead load to live load is k, and Equations 18, 19 can be obtained,
Therefore, Equation 17 can be rewritten as Equation 20.
In addition, due to the errors between the calculation model and the actual results, the errors generated by the calculation model need to be considered in the function, then the resistance equation of the structure can be expressed as Equation 21,
According to the reliability theory, the limit state function can be written as Equation 22,
When Z = 0, it is the equilibrium state; when Z > 0, it is safe; when Z < 0, it is unsafe, that is, it is failure. The resistance is uncertain, and the load effect is deterministic. Since the resistance model contains uncertainties such as material, size, shear span ratio and calculation model, the limit state function is also uncertain, and the failure probability of the limit state equation can be written as Equation 23,
The calculation of failure probability can be carried out using the Monte Carlo simulation method. Monte Carlo simulation is a method of calculating a large number of samples to make the probability results tend to be. When the sample size is infinite, the simulated probability results are accurate solutions, while when the sample size is large enough, the simulated probability results are close to the exact solutions. Through trial calculations, it can be concluded that the calculation results are very stable when the simulated sample size is 100,000, and in subsequent calculations, the sample size will be positioned at 100,000. The reliability index can be calculated by Equation 24,
4.2 Uncertain parameter
As can be seen from Equation 12, the calculation of shear capacity of R-ECC beam is affected by factors such as reinforcement ratio, shear span ratio, concrete strength, stirrup ratio and stirrup strength, etc., and these factors also have uncertainties, which result in the uncertainty of R-ECC beam resistance. In addition to the above factors, the load also has great uncertainty, including dead load and live load, and the uncertainty of load will cause the effect to have uncertainty. In order to fully consider these uncertainties, the corresponding deviation, COV and distribution mode were collected from the literature, as shown in Table 4, which contains nine member parameters and two load parameters in total.
5 Discussion
5.1 Reliability index
The primary focus of structural design is to determine the material partial factor and load partial factor in order to guarantee the dependability of the R-ECC members. The primary distinction between an R-ECC beam and a standard RC beam is the replacement of concrete with ECC. As a result, in order to construct a structure based on the limit state, the ECC material partial factor that corresponds to the dependability index must be found. Equation 12 indicates that the material partial factor of ECC strength is the ECC material partial factor.
According to the finding in the literature, the ratio k of dead load and live load has a great influence on the reliability index. Therefore, the influence of the ratio k on the reliability index of the shear capacity of R-ECC beams will be discussed below. The member parameter values are as follows: b = 200 mm, h0 = 400 mm, As = 628 mm2, Av = 100 mm2, s = 200, fy = 400 MPa, fc = 54 MPa, fty = 6.1 MPa, ftu = 7.5 MPa, shear span ratio = 2.5. In addition, the guidelines including GB 50068-2018 (2018), ACI 440.2R (2017), CSA S806 (2012), CIDAR (2006), FIB TG 9.3 (2001), UK TR 55 (2004) from different countries have different considerations for load partial factors, as shown in Table 5. Generally, the greater the load partial factor, the greater the reliability index, that is, the load partial factor has a great impact on the reliability index.
The range of ECC material partial factors that were taken into consideration was 1.0–1.60, with a 0.05 interval. The values of 0.5, 1.0, 1.5, 2.0, and 2.5 represent the dead load to live load ratio, or k. Figure 9 displays the reliability index results that were computed.
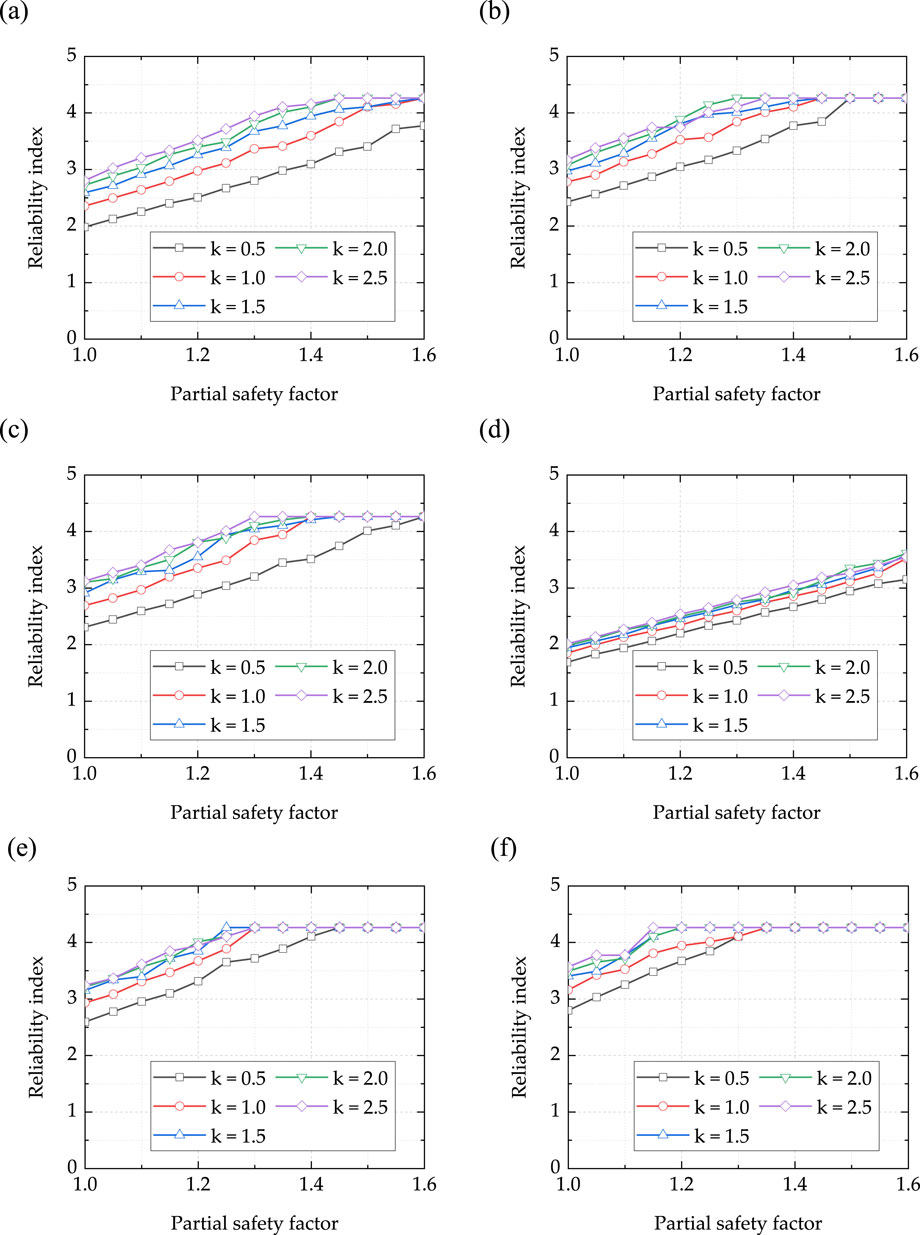
Figure 9. Reliability index: (A) GB model; (B) CSA model; (C) ACI model; (D) CIDAR model; (E) FIB model; (F) TR model.
The following conclusions can be drawn: (1) When the material partial factors are equal, the reliability index increases with the increase of the ratio k of dead load to live load because the dispersion of dead load is smaller than that of live load. However, it stops increasing after it reaches 4.26. This does not imply that the structure’s reliability will not increase further. This is primarily because the reliability index is derived from the failure probability and the function Φ(·) cannot obtain a greater reliability index when the failure probability is very small. The reliability index rises as the ratio k grows because the load effect’s dispersion is reduced; (3) Due to the biggest partial factors of both live load and dead load, guideline TR has the largest reliability index, whereas guideline CIDAR has the smallest reliability index. Numerous other dependability criteria are nearby.
5.2 Calibration of material partial factor
When the design parameters are different, the reliability index obtained by calculation is also different. In order to obtain the ECC material partial factor more reasonably, the reliability index of the shear bearing capacity of R-ECC beams under different parameters was calculated. The specific parameters are shown in Table 6, which is including five kinds of section width, five kinds of effective height of section, nine kinds of longitudinal reinforcement rate, five kinds of stirrup rate, five kinds of shear span ratio, five kinds of stirrup strength and five kinds of ECC strength, a total of 5*5*9*5*5*5*5 *5 = 140,625 kinds of design parameters. There were five kinds of ratio k of dead load to live load, including 0.5, 1.0, 1.5, 2.0 and 2.5. The ECC material partial factor considered range from 1.0 to 1.60, with an interval of 0.05.
According to the guide of GB 50068-2018 (2018) when the safety level of ductile members and brittle members is level II, the corresponding reliability index should be greater than 2.70 and 3.20, while the shear failure of R-ECC beam is brittle failure. Therefore, 3.20 was taken as the target reliability index in the subsequent discussion.
When the reliability index corresponding to the material partial factor is closer to the target reliability index, it indicates that the material partial factor is more reasonable. However, the reliability index obtained by different design parameters is different, which makes it difficult to accurately judge the rationality of the material partial factor. Therefore, the following methods was considered to calibrate the material partial factor, as shown in Equation 25,
where H is the deviation; βT is the target reliability index, which is 3.20; βi is the reliability index calculated under different cases, n is the number of cases calculated. Subsequently, the deviation values under different k values will be calculated and the deviation values corresponding to all k values will be calculated. According to the formula, the closer the calculation reliability index is to the target reliability index, the smaller the deviation value. In other words, the smaller the deviation value, the more reasonable the material partial factor.
Figure 10 shows the calibration of reliability indexes corresponding to different guidelines. Figure 10A shows the calibration results corresponding to GB 50068–2018. It can be seen that the deviation value decreases first and then increases with the increase of the material partial factor. The calibration value of the material partial factor (that is, the value of the material partial factor corresponding to the minimum deviation value) decreases with the increase of the k value, and the corresponding material partial factors for k = 0.5, 1.0, 1.5, 2.0 and 2.5 are 1.45, 1.30, 1.20, 1.15 and 1.10, respectively. The calibration material partial factor value for all k values is 1.20.
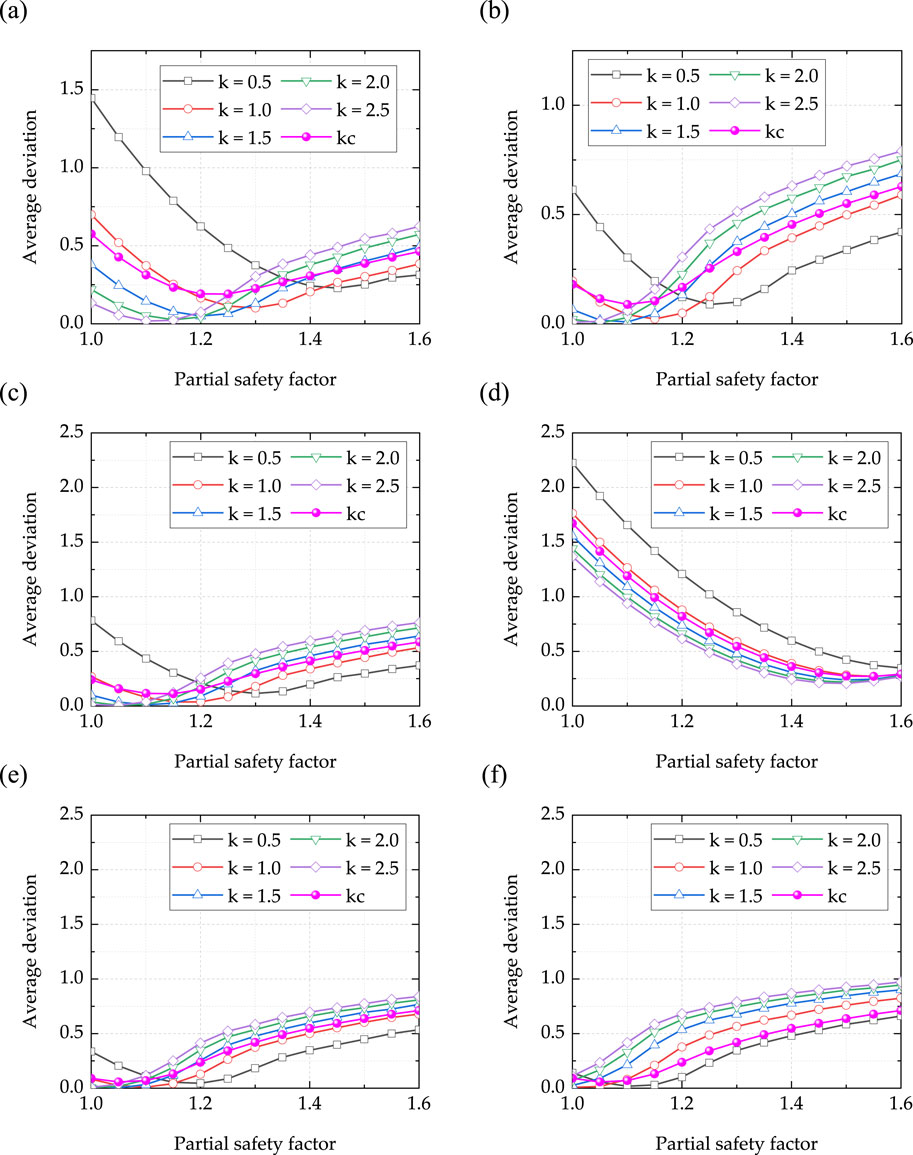
Figure 10. Calibration of material partial factor: (A) GB; (B) CSA; (C) ACI; (D) CIDAR; (E) FIB; (F) TRK.
Figure 10B shows the calibration results corresponding to guideline CSA. Similarly, the deviation value decreases first and then increases with the increase of the material partial factor. The calibrated material partial factor values decrease as k value increases, and the corresponding material partial factors for k = 0.5, 1.0, 1.5, 2.0 and 2.5 are 1.25, 1.15, 1.10, 1.05 and 1.00, respectively. The calibration material partial factor value for all k values is 1.10.
Figure 10C shows the calibration result corresponding to guideline ACI. Similarly, the deviation value decreases first and then increases with the increase of the material partial factor. The value of the calibrated material partial factor decreases with the increase of k value, and the corresponding material partial factors for k = 0.5, 1.0, 1.5, 2.0 and 2.5 are 1.30, 1.20, 1.15, 1.10 and 1.05, respectively. The calibration material partial factor value for all k values is 1.15.
Figure 10D shows the calibration result corresponding to guideline CIDAR. Similarly, the deviation value decreases first and then increases with the increase of the material partial factor, but the material partial factor corresponding to the minimum deviation value is larger. The value of the calibrated material partial factor decreases with the increase of k value, and the corresponding material partial factors for k = 0.5, 1.0, 1.5, 2.0 and 2.5 are 1.60, 1.55, 1.50, 1.45 and 1.45, respectively. The calibration material partial factor value for all k values is 1.55.
Figure 10E shows the calibration result corresponding to the guideline fib. The deviation value decreases first and then increases with the increase of the material partial factor. Obviously, the calibration material partial factor corresponding to fib is lower than the previous guideline. The value of the calibrated material partial factor decreases with the increase of k value, and the corresponding material partial factors for k = 0.5, 1.0, 1.5, 2.0 and 2.5 are 1.20, 1.10, 1.05, 1.00 and 1.00, respectively. The calibration material partial factor value for all k values is 1.05.
Figure 10F shows the calibration result corresponding to the guideline TRK, which is similar to the guideline fib. The calibrated material partial factor values decrease as k value increases, and the corresponding material partial factors for k = 0.5, 1.0, 1.5, 2.0 and 2.5 are 1.10, 1.00, 1.00, 1.00 and 1.00, respectively. The calibration material partial factor value for all k values is 1.05.
In the design, it is usually rare to distinguish the material partial factor corresponding to the ratio k of dead load and live load, but to comprehensively consider the calibration material partial factor under each ratio k, so as to facilitate the design. Therefore, it is recommended to adopt the corresponding calibration material partial factors for all k values in the shear capacity design of R-ECC beams, and the results are summarized as shown in Table 7.
It should be noted that the summarized partial factors were obtained in the shear failure state of R-ECC members. However, R-ECC members also have flexural failure, axial compression failure, compression-bending failure and other failure modes, and the partial factors obtained under these failure modes may be different. In future research, further discussion and comparison are needed.
6 Conclusion
In order to obtain the reasonable values of material partial coefficients for ECC materials in R-ECC shear members, experimental research was conducted on the strength statistical characteristics of ECC materials. Multiple shear performance test results of R-ECC beams were collected, and four capacity calculation models were evaluated. Subsequently, the expression of the limit state equation was derived, and a large number of calculations were conducted based on the Monte Carlo simulation method. Finally, the reasonable values of the material partial coefficients were calibrated based on the target reliability index. The main conclusions obtained are as follows.
(1) Compared GB50010-2010 model, JCSE 08 model, Hou model and Gu model, JCSE-08 model was the most conservative, its model error was 0.8233, the COV was 0.04; the errors of other models were all around 1.0, and the error of Gu model was 1.0 and the COV was the smallest (0.0200). Therefore, Gu model was recommended for reliability analysis. The error distribution of Gu model did not obey the conventional distribution, and the linear moment was used to simulate the random sample, which was in good agreement with the actual PDF.
(2) The reliability index of R-ECC increased with the increase of the material partial factor of ECC strength. When the ratio k of dead load and live load was the same, the reliability index increased with the increase of k value. This was because the uncertainty of the partial factor of dead load was smaller than that of live load, and the divergence of load effect was reduced by increasing the ratio k.
(3) In the range of material partial factor from 1.0 to 1.6, the deviation results of reliability of each guideline showed a trend of first decreasing and then increasing with the increase of the material partial factor. In general, the minimum deviation value decreased with the increase of the ratio k.
(4) Finally, the calibration results of the material partial factors corresponding to all k values were used, and the material partial factors of GB, CSA, ACI, CIDAR, fib and TRK were 1.20, 1.10, 1.15, 1.55, 1.05 and 1.05, respectively.
Data availability statement
The original contributions presented in the study are included in the article/Supplementary Material, further inquiries can be directed to the corresponding author.
Author contributions
SY: Data curation, Investigation, Writing–original draft. ZT: Conceptualization, Funding acquisition, Methodology, Supervision, Writing–original draft. WS: Data curation, Methodology, Validation, Writing–original draft. FF: Conceptualization, Data curation, Investigation, Writing–original draft. XL: Conceptualization, Methodology, Writing–review and editing.
Funding
The author(s) declare that financial support was received for the research, authorship, and/or publication of this article. This research was funded by 2022 Construction Research Project (self-funded) of Zhejiang department of housing and urban rural construction, grant number No.2022K040. Special project of Ningbo Polytechnic, grant number No.NZ24RC003 and Open Fund Project of National Engineering Laborator for Applied Technology of Forestry and Ecology in South China, grant number No.2022NFLY01.
Conflict of interest
The authors declare that the research was conducted in the absence of any commercial or financial relationships that could be construed as a potential conflict of interest.
Generative AI statement
The authors declare that no Generative AI was used in the creation of this manuscript.
Publisher’s note
All claims expressed in this article are solely those of the authors and do not necessarily represent those of their affiliated organizations, or those of the publisher, the editors and the reviewers. Any product that may be evaluated in this article, or claim that may be made by its manufacturer, is not guaranteed or endorsed by the publisher.
Supplementary material
The Supplementary Material for this article can be found online at: https://www.frontiersin.org/articles/10.3389/fmats.2024.1534658/full#supplementary-material
References
ACI 440.2R (2017). Guide for the design and construction of externally bonded FRP systems for strengthening concrete structures. Am. Concr. Inst.
Arulanandam, P. M., Sivasubramnaian, M. V., Chellapandian, M., Murali, G., and Vatin, N. I. (2022). Analytical and numerical investigation of the behavior of engineered cementitious composite members under shear loads. Materials 15, 4640. doi:10.3390/ma15134640
CIDAR (2006). Design Guideline for RC structures retrofitted with FRP and metal plates: beams and slabs. Sydney, Australia: University of Technology Sydney.
CSA S806 (2012). Design and construction of building structures with fibre-reinforced polymers. Can. Stand. Assoc.
Feng, J., Shao, X., Qiu, M., Li, H., Gao, X., and Huang, Z. (2024). Reliability evaluation of flexural capacity design provision for UHPC beams reinforced with steel rebars/prestressing tendons. Eng. Struct. 300, 117160. doi:10.1016/j.engstruct.2023.117160
FIB TG 9.3. Externally bonded FRP reinforcement for RC structures. fe&dacite;eration ́ internationale du betoń Bulleti. 2001.
GB 50068-2018 (2018). Unified standard for reliability design of building structures. Beijing, China: China Standard Press.
Gu, D., Pan, J., Mustafa, S., Huang, Y., and Luković, M. (2022). Shear transfer mechanism in reinforced engineered cementitious composite (ECC) beams: quantification of V s and V c. Eng. Struct. 261, 114282. doi:10.1016/j.engstruct.2022.114282
Hossain, K. M. A., Alam, S., Anwar, M. S., and Julkarnine, K. M. Y. (2016). High performance composite slabs with profiled steel deck and Engineered Cementitious Composite – strength and shear bond characteristics. Constr. Build. Mater 125, 227–240. doi:10.1016/j.conbuildmat.2016.08.021
Hossain, K. M. A., Hasib, S., and Manzur, T. (2020). Shear behavior of novel hybrid composite beams made of self-consolidating concrete and engineered cementitious composites. Eng. Struct. 202, 109856. doi:10.1016/j.engstruct.2019.109856
Hou, L., Xu, S., Zhang, X., and Chen, D. (2014). Shear behaviors of reinforced ultrahigh toughness cementitious composite slender beams with stirrups. J. Mater Civ. Eng. 26, 466–475. doi:10.1061/(ASCE)MT.1943-5533.0000833
Huang, B.-T., Wu, J.-Q., Yu, J., Dai, J.-G., and Leung, C. K. (2020). High-strength seawater sea-sand Engineered Cementitious Composites (SS-ECC): mechanical performance and probabilistic modeling. Cem. Concr. Compos 114, 103740. doi:10.1016/j.cemconcomp.2020.103740
Huang, X., Zhou, Y., Li, W., Hu, B., and Zhang, J. (2023). Reliability-based design of FRP shear strengthened reinforced concrete Beams: guidelines assessment and calibration. Compos Struct. 323, 117421. doi:10.1016/j.compstruct.2023.117421
Ismail, M. K., and Hassan, A. A. A. (2021). Influence of fibre type on the shear behaviour of engineered cementitious composite beams. Mag. Concr. Res. 73, 464–475. doi:10.1680/jmacr.19.00172
JSCE (2008). Recommendations for design and construction of high performance fiber reinforced cement composites with multiple fine cracks. Tokyo: Japan Society of Civil Engineers.
JSCE (Japan Society of Civil Engineers) (2008). Recommendations for design and construction of highperformance fiber reinforced cement composites with multiple fine cracks (HPFRCC).
Kang, S.-B., Tan, K. H., Zhou, X.-H., and Yang, B. (2017). Experimental investigation on shear strength of engineered cementitious composites. Eng. Struct. 143, 141–151. doi:10.1016/j.engstruct.2017.04.019
Lu, R., Luo, Y., and Conte, J. P. (1994). Reliability evaluation of reinforced concrete beams. Struct. Saf. 14, 277–298. doi:10.1016/0167-4730(94)90016-7
Meng, D., Lee, C. K., and Zhang, Y. X. (2017). Flexural and shear behaviours of plain and reinforced polyvinyl alcohol-engineered cementitious composite beams. Eng. Struct. 151, 261–272. doi:10.1016/j.engstruct.2017.08.036
Paegle, I., and Fischer, G. (2016). Phenomenological interpretation of the shear behavior of reinforced Engineered Cementitious Composite beams. Cem. Concr. Compos 73, 213–225. doi:10.1016/j.cemconcomp.2016.07.018
Ribeiro, S. E. C., and Diniz, S. M. C. (2013). Reliability-based design recommendations for FRP-reinforced concrete beams. Eng. Struct. 52, 273–283. doi:10.1016/j.engstruct.2013.02.026
Rui, Z., Qingli, M., and Wei, H. (2017). Experimental investigation on shear behavior of PP-ECC beams by considering effect of stirrup. China J. Highw. Transp. 30, 234–241.
Tarawneh, A., Alajarmeh, O., Alawadi, R., Amirah, H., and Alramadeen, R. (2024). Database evaluation and reliability calibration for flexural strength of hybrid FRP/steel-RC Beams. Compos Struct. 329, 117758. doi:10.1016/j.compstruct.2023.117758
Tong, M.-N., Zhao, Y.-G., and Lu, Z.-H. (2021). Normal transformation for correlated random variables based on L-moments and its application in reliability engineering. Reliab Eng. Syst. Saf. 207, 107334. doi:10.1016/j.ress.2020.107334
UK TR 55 (2004). Design guidance for strengthening concrete structures using fibre composite materials. The Concrete Society, Crowthorne, UK.
Xu, S., Hou, L.-J., and Zhang, X.-F. (2012). Shear behavior of reinforced ultrahigh toughness cementitious composite beams without transverse reinforcement. J. Mater Civ. Eng. 24, 1283–1294. doi:10.1061/(ASCE)MT.1943-5533.0000505
Zhang, F., Feng, F., and Liu, X. (2022a). Reliability analysis of concrete beam with high-strength steel reinforcement. Materials 15, 8999. doi:10.3390/ma15248999
Zhang, W., Liu, X., Huang, Y., and Tong, M.-N. (2022b). Reliability-based analysis of the flexural strength of concrete beams reinforced with hybrid BFRP and steel rebars. Arch. Civ. Mech. Eng. 22, 171. doi:10.1007/s43452-022-00493-7
Keywords: reliability, engineered cementitious composite, material partial factor, limit state function, Monte Carlo simulation
Citation: Yi S, Tang Z, Shi W, Feng F and Liu X (2025) Statistical properties and material partial factors of ECC material based on shear failure member. Front. Mater. 11:1534658. doi: 10.3389/fmats.2024.1534658
Received: 26 November 2024; Accepted: 16 December 2024;
Published: 08 January 2025.
Edited by:
Annalisa Napoli, University of Salerno, ItalyReviewed by:
Amir Ali Shahmansouri, Washington State University, United StatesXiaodong Tan, Southwest University, China
Copyright © 2025 Yi, Tang, Shi, Feng and Liu. This is an open-access article distributed under the terms of the Creative Commons Attribution License (CC BY). The use, distribution or reproduction in other forums is permitted, provided the original author(s) and the copyright owner(s) are credited and that the original publication in this journal is cited, in accordance with accepted academic practice. No use, distribution or reproduction is permitted which does not comply with these terms.
*Correspondence: Xiang Liu, bGl1eGlhbmdAZmp1dC5lZHUuY24=
 Shixiang Yi1
 Xiang Liu

