- 1School of Civil Engineering and Architecture, Anhui University of Science and Technology, Huainan, China
- 2State Key Laboratory for Fine Exploration and Intelligent Development of Coal Resources, China University of Mining and Technology, Xuzhou, China
With the goal of examining the micromechanics damage characteristics of freeze-thaw red sandstone under the influence of cyclic loads, a model of freeze-thaw cyclic rock particles is developed based on Discrete Element Method numerical simulation in order to investigate and study the micromechanics response mechanism of rocks under the coupling effect of freeze-thaw and cyclic loads. The findings demonstrate that lower rock elastic modulus and higher irreversible strain are driven by longer loading/unloading durations and more frequent freeze-thaw cycles. Its bearing capacity and resistance to deformation are diminished by the damage brought on by freeze-thaw; Rock anisotropy and the spatial organisation of microcracks are significantly altered by different loading techniques; In freeze-thaw rocks, the frequency and intensity of acoustic emission breaking follow the law of normal distribution. Under cyclic stress, samples exposed to several freeze-thaw cycles exhibit an escalation in large-scale fractures, accompanied by a concentrated spatial distribution of acoustic emission events. Three phases may be distinguished in the energy evolution of red sandstone: the initial, accumulation, and release phases. The energy storage capacity is compromised by freeze-thaw degradation, resulting in an elevated conversion rate of dissipative energy and rendering the energy conversion mechanism more unstable. The previously described study results possess considerable relevance for rock engineering construction and catastrophe mitigation in cold climates.
1 Introduction
In colder parts of Europe, Russia, Canada, and Northeast and Northwest China, many infrastructure projects are underway (Zhang et al., 2022; Wang et al., 2024). The notable temperature differential is brought on by the changing of the seasons and the rotation of day and night. The liquid within the rock turns to ice as the temperature drops below 0°C, which results in a reduction in density and an increase in volume (Liu et al., 2020; Shen et al., 2020). As the temperature steadily lowers, the amount of unfrozen water in the rock decreases, suggesting that the volume of pore ice grows. This increases the pressure of frost heave and promotes the formation and spread of internal fractures (Zhang et al., 2019; Kolay, 2016; Huang et al., 2018). In colder climates, rock engineers are constantly subjected to prolonged freeze-thaw cycles, which severely weaken rocks and increase the risk of engineering mishaps like tunnel collapses and hazardous rock landslides (Park et al., 2020; Guo et al., 2020). Additionally, the rock mass is susceptible to periodic loads due to blasting, tunnel excavation support, traffic load, and mechanical vibration during construction (Zhang et al., 2018; Fu et al., 2024). Therefore, research on the microscopic damage characteristics of rocks under the combined influences of freeze-thaw cycles and cyclic loads might help clarify the degradation processes under complex natural and anthropogenic settings.
Numerous studies are carried out by both local and foreign researchers to elucidate how the mechanical and the freeze-thaw cycles effects alter the rocks physical properties. The porosity decreases with increasing rock density in relation to mass. Better cementation and reduced impact from freeze-thaw damage are associated with denser mineral particles. (Wang et al., 2020); From the standpoint of the external environment, the more freeze-thaw cycles, the more severe the deterioration of the rock’s frost resistance, the larger the plastic strain, and the lower the compressive strength and elastic modulus, the lower the freeze-thaw temperature limit, and the longer the freeze-thaw time (Wen et al., 2017; Argandoa et al., 1999); By doing many tests on rocks with varied freeze-thaw cycles, the research examines how various stresses affect the mechanical properties of freeze-thaw rocks. These studies include of triaxial compression, triaxial cyclic load, uniaxial compression, and uniaxial cyclic load testing. The aforementioned research primarily focusses on the macro level, but other researchers are using nuclear magnetic resonance, acoustic emission, scanning electron microscopy, and computed tomography (CT) to investigate the micromechanics of damage mechanisms of freeze-thaw rocks (Tan et al., 2022; Amitrano et al., 2012; Martínez-Martínez et al., 2013; Zhou et al., 2020). These studies demonstrate that the development of microcracks within rocks by the freeze-thaw pressure is what causes freeze-thaw damage (Yu et al., 2023). Nevertheless, this qualitative study places a great demand on experimental circumstances and is unable to capture the development and growth process of microcracks. In recent years, as computer technology has advanced, numerical simulation has gained popularity and recognition in scientific study. Numerous academics are doing research on freeze-thaw damage modelling because numerical simulation is less expensive and simpler to replicate than laborious and intricate indoor and outdoor trials. To simulate freeze-thaw damage and predict the temperature transfer and deformation behaviour of rocks, for example, a thermal-hydraulic-coupling model is developed using the Finite Element Method (FEM) (Duca et al., 2015). It is important to keep in mind that mesh division is the primary foundation of numerical models created using the finite element technique, and mesh distortion is common when examining situations involving substantial deformation and discontinuity. The nonlinear big deformation properties in rock masses may be more precisely simulated by the particle flow model using the Discrete Element Method (DEM) for discontinuous discrete media of rocks. The results demonstrate that this method can accurately simulate rock freeze-thaw damage. Tran et al. (2020) established the notion of “water” particles and used their shrinkage to model the drying process of clay, whereas Zhu et al. (2021) suggested a technique based on the discrete element approach, using pore ice particle expansion to simulate frost heave. The findings demonstrate that this approach may proficiently replicate freeze-thaw degradation in rock.
Furthermore, the investigation of cyclic loads is conducted using DEM numerical simulation. In order to shed light on the anisotropic mechanical behaviour of shale with varying bedding, Yin et al. (2023) examined the strength and deformation characteristics, strain energy, and damage development process throughout the loading and unloading process using numerical models and triaxial cyclic loading and unloading indoor tests. Song Y et al., 2023 used a damage model that included stiffness stiffening and weakening to correctly model how coal samples responded mechanically and acoustically to multiple stages of cycle loading at different rates of loading and unloading.
At now, several researchers are investigating tests and simulations of freeze-thaw rock behaviour under cyclic loading conditions. Song et al. (2019) performed indoor uniaxial compression tests and cyclic loading-unloading tests on red sandstone subjected to various freeze-thaw conditions, examining the alterations in peak strength, elastic modulus, hysteresis loop area, and dissipative energy of the freeze-thaw red sandstone under the two experimental scenarios. Nonetheless, research at the microscopic scale remained inadequate. Wang (2017) used parameter calibration in DEM to represent the damage caused by freeze-thaw and cyclic loads on fractured rock masses; nevertheless, this technique failed to adequately characterise the influence of freeze-thaw cycles on rocks. To investigate the microscopic damage characteristics of freeze-thaw sandstone under cyclic stress, the study uses DEM numerical simulation to construct a 3D particle model for freeze-thaw rocks. The findings of indoor test parameter calibration are then combined to assess the deformation characteristics, microscopic breaking evolution features, fabric distribution, acoustic emission moment tensor, and energy evolution laws of freeze-thaw red sandstone under cyclic loading.
2 Test of uniaxial compression and freeze-thaw cycle
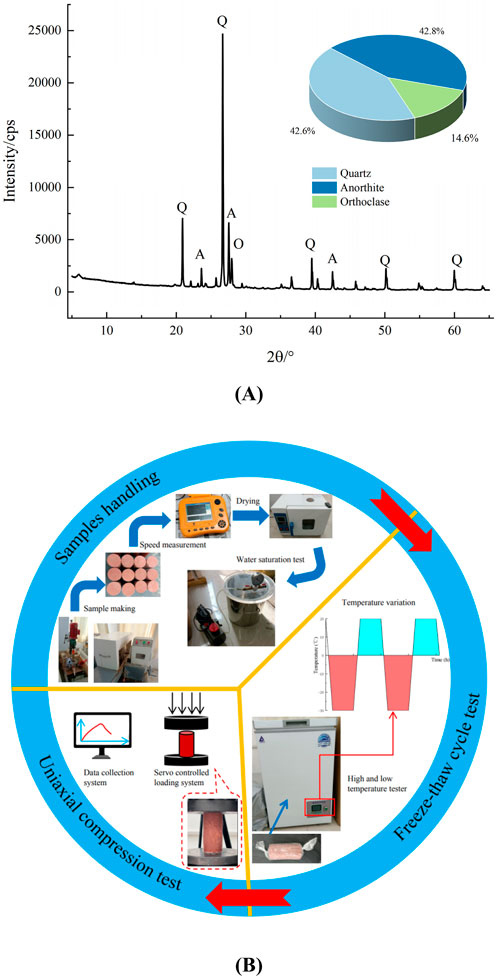
The red sandstone used in this study’s testing comes from a mining region in western China. Its primary minerals are potassium feldspar (14.6%), plagioclase (42.8%), and quartz (42.6%). It has a traditional granular structure. Figure 1A displays the XRD data.
Figure 1B provides an overview of the sample processing and testing procedure. The following are the specific steps. Taking the core red sandstone rock mass, cutting, polishing, and manufacturing the standard rock samples in Φ50 mm × 100 mm; Using the ultrasonic velocimeter to screen out samples with similar wave speeds; Drying them to a constant weight at 105°C for 24 h; Using the vacuum saturation device to extract air for 2 h under 0.1 MPa of negative pressure, and submerging the sample in water for 48 h until the weight remains unchanged in order to obtain the saturated samples; By using the operation procedures for freeze-thaw tests the Professional Standards Compilation Group of People’s Republic of China, 2001 and other researchers’ research, the saturated sandstone is sealed with cling wrap and conducted freeze-thaw cyclic tests in high and low temperature test chambers. Zhang et al. (2018) state that a WAW-600 servo testing device with a displacement loading rate of 0.06 mm/min is used to perform uniaxial compression tests on rocks. The temperature range for the freeze-thaw process is set between −30°C and 20°C, the cyclic period is set at 8 h (4 hours of freezing and 4 hours of thawing), and the number of freeze-thaw cycles is 0, 20, and 40, respectively. The physical properties of the acquired red sandstone samples are as follows: porosity of 8.66%, moisture content of 3.58%, and saturation density of 2.42 g/cm³.
3 Numerical simulation of freeze-thaw cycles
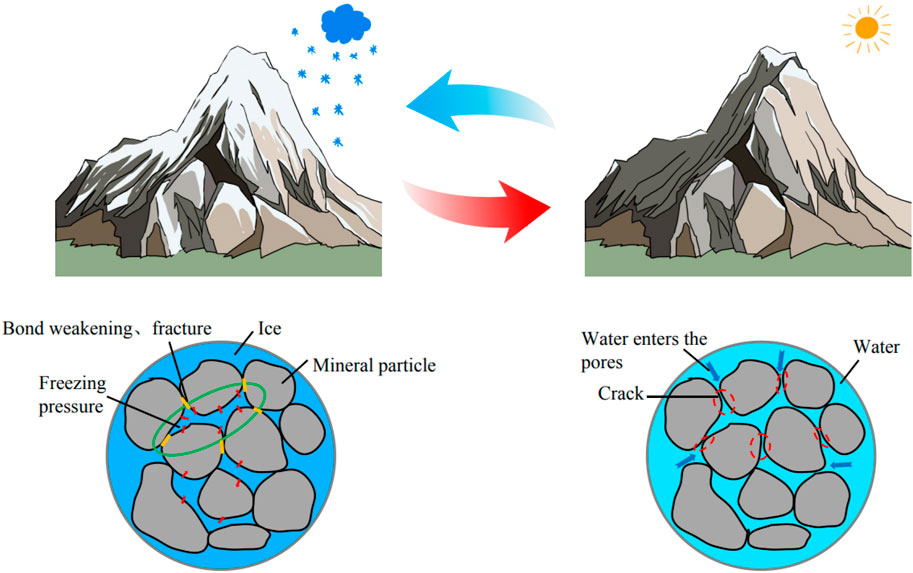
The fundamental cause of rock deterioration from freeze-thaw cycles is the volume alterations caused by the recurrent phase transitions of pore water between water and ice. When the temperature falls below 0°C, the water in the pores freezes, and the resultant expansion of ice volume generates frost heave pressure inside the rock. The adjacent rock mineral particles are compressed, resulting in diminished or entirely lost adhesion between particles, and an augmentation in pore volume. In the ensuing warming and thawing process, more water infiltrates the pores of the rock. Repeated freeze-thaw cycles will cause microstructural damage, worsen irreparable damage to the rock, and eventually lead to a decline in its mechanical qualities. The concept is shown in Figure 2.
In the Discrete Element Method (DEM), rock materials are seen as a collection of interacting particles, facilitating the modelling of fracture development in rock masses. This method provides considerable benefits in simulating the fracture mechanisms and granular movements of geotechnical materials. The Parallel Bond Model is used to represent the loaded behaviour of freeze-thaw rocks, since it is appropriate for granular bonded materials like rocks and concrete. This concept establishes bonded connections between particles, enabling the transmission of forces and moments. When the normal or tangential contact forces surpass the bond strength, tensile or shear failure ensues, resulting in bond rupture and the formation of microcracks, as seen schematically in Figure 3.
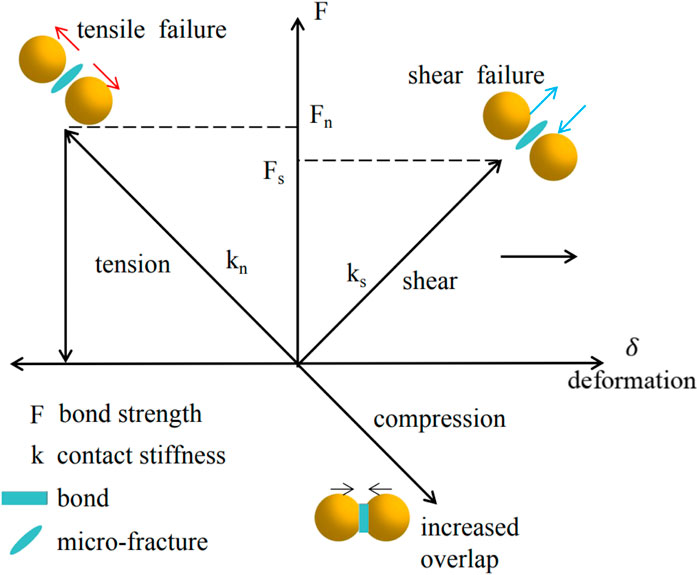
Figure 3. Schematic representation of the parallel bond model principle (Sun et al., 2024).
DEM is used to create a 3D particle model of freeze-thaw rocks by consulting earlier researchers’ work on numerical modelling of freeze-thaw cycles. Without accounting for the impact of pore water seepage, and performing temperature homogenisation (the temperature fluctuations within and outside the model are the same), saturated rocks are reduced to being made up of rock and water particles. Changes in the unfrozen water content are controlled using numerical simulations that use programming language to regulate particle temperatures. The following formula may be used to determine the unfrozen water content based on the findings of Liu et al. (2016).
Where, wu means the unfrozen water content inside the rock, and ΔT is the temperature change quantity.
We simulate the frost heave phenomenon when the water particles expanded into ice particles throughout the cooling and freezing process. In order to simulate continuous water entry into the widening pores underneath the water-rich environment, water is provided after each temperature rise (ignoring the volume changes of rock particles). According to Song Y et al., 2023 study methodology on the expansion mode of water particles, the DEM uses the radius expansion of water particles uv as a control. At a given temperature T, the volume Vof a single water particle is determined by Wu and uv. The exact equations are as follows, per Liu et al. (2016) and Song Z et al., 2023:
Where, r0, V0,ΔVW mean the initial radius, initial volume, and volume increment of water particles respectively; uv means the radius expansion of water particles under the frost heave force, and pi is the ice pressure; vm and Em mean the Poisson’s ratio of rocks and elastic modulus respectively; vi and Ei mean the Poisson’s ratio of ice and elastic modulus respectively; n is the porosity of the rock.
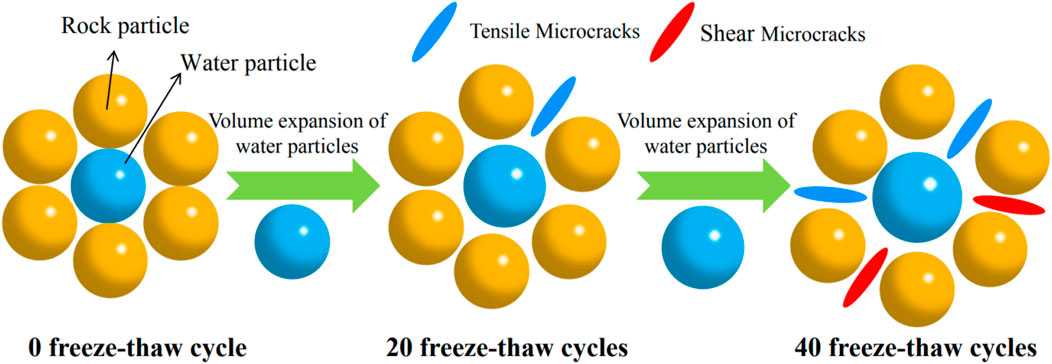
As the frequency of freeze-thaw cycles escalates, the volume of water particles perpetually expands, resulting in the compression of rock particles. When the stress among the particles surpasses their tensile or shear strength, the bonds fracture, leading to the formation of tensile or shear microcracks. This results in a reduction of the bonding force and strength of the rock, simulating freeze-thaw damage, as seen in Figure 4.
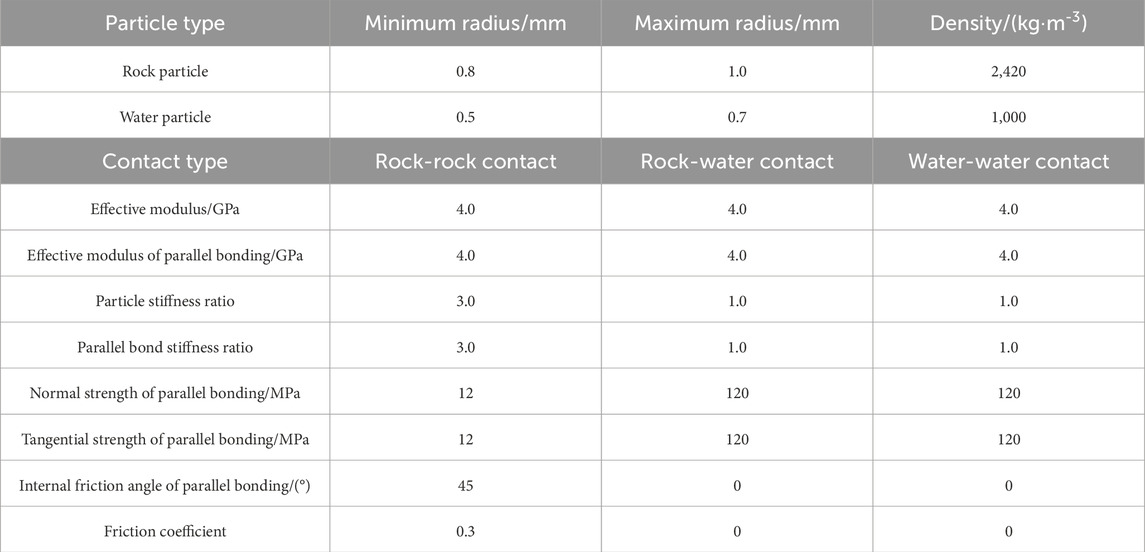
The model building, parameter assignment, and loading process of the DEM model are shown in Figure 5. Based on the volume ratio of rock particles and water particles generated by the porosity and moisture content of rocks, as well as the moisture content of saturated red sandstone samples, the research builds a numerical model that is similar in size to the indoor experiments, with 60,942 particles and 282,783 contact bonds. It does this by using the parallel bonding model to assign microscopic contact parameters, separating contact types into rock-rock contact, water-water contact, and rock-water contact. The bond strength parameters (parallel bond normal strength/shear strength) for the water-water contact and the rock-water contact are set sufficiently large to ensure that freeze-thaw damage occurs between the rock particles. The calibrated microscopic parameters are displayed in Table 1. Following freeze-thaw cycles, all water particles must be eliminated during the loading simulation of the numerical model to guarantee that the model strength is supplied by the rock particles.
To validate the rationale of the microscopic parameters, the laboratory and simulation outcomes of rocks exposed to various freeze-thaw cycles are compared with the uniaxial compression test findings of sandstone. This research examines the effects of freeze-thaw damage on the mechanical properties of rocks, rather than investigating the correlation between cycle number and rocks. Consequently, in DEM, with identical mesoscopic parameter calibration, the stress-strain curve of the rock subjected to 0 freeze-thaw cycles served as a reference to identify simulation results that closely match with those of 20 and 40 freeze-thaw cycles under laboratory circumstances, as seen in Figure 6A. Due of the bonding forces formed by particles in DEM via supplementary bonding parameters, replicating natural microcracks in rocks is exceedingly challenging; hence, the crack compaction stage is excluded (Shi et al., 2023). The comparative examination of peak stress and elastic modulus in Figure 6B indicates that the peak stress levels in both tests and simulations are comparable, and the failure modes exhibit similarities. The elastic modulus of the sample with 0 freeze-thaw cycle are almost similar. An escalation in freeze-thaw cycles leads to an increase in microcracks inside the rock, less deformation resistance, and a decline in the elastic modulus. The aforementioned calibrated microscopic parameters are rational and practicable.
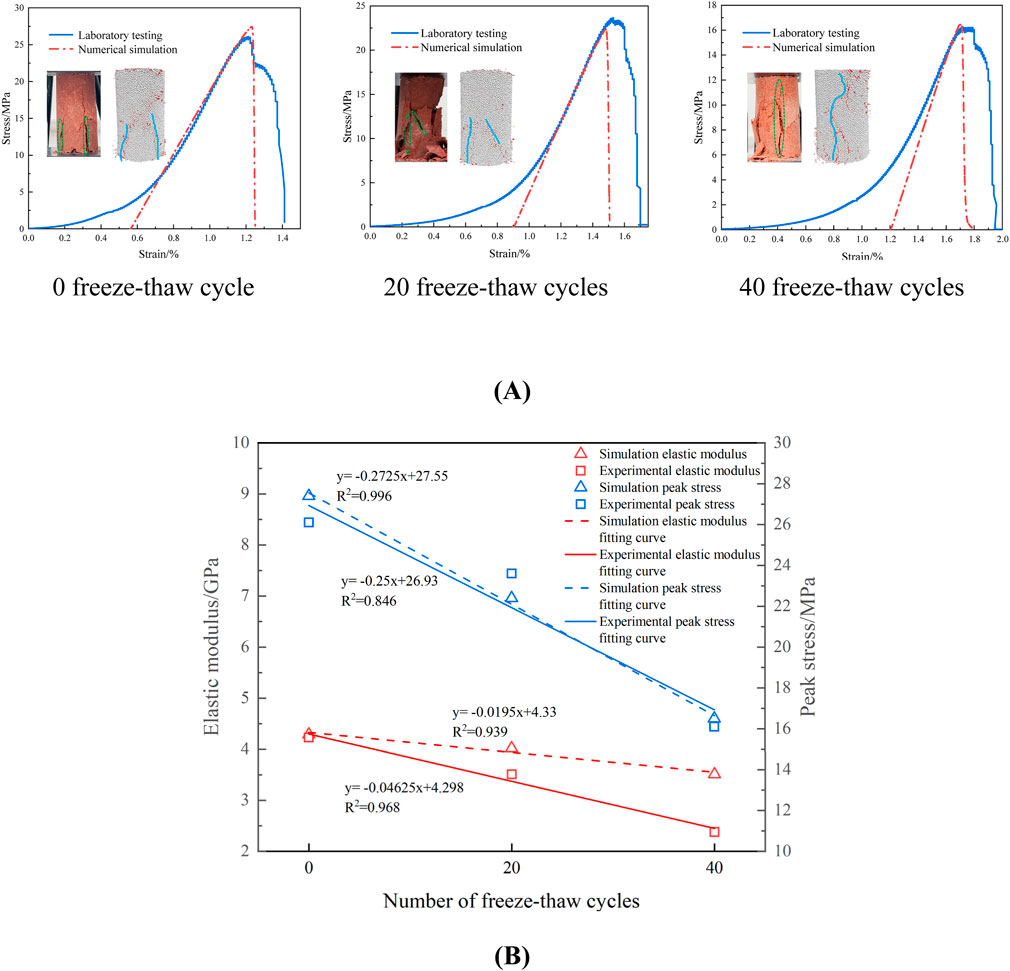
Figure 6. Comparison of Stress-Strain Curves and damage Modes of Samples Subjected to Different Freeze-Thaw Cycles: (A) 0 freeze-thaw cycle (B) A comparison between elastic modulus and peak strength of samples.
4 Numerical simulation of cyclic loading and unloading
Figure 7A schematically depicts the cyclic loading and unloading procedure used in numerical simulation. The movement of the wall element is controlled in the paper to simulate loading and unloading. The loading plate is driven to load steadily during the model loading process at a displacement loading rate of 0.01 m/s (the values chosen are quasi-static loading rates, and the loading rate in indoor tests and numerical simulations varies due to the different damping coefficients). When the force is released to the target lower limit stress, the wall unit reloads after moving in the opposite direction during the unloading process. With a total of nine loading and unloading cycles, the study uses a graded cyclic loading and unloading approach. The target upper limit stresses are 10%, 20%, 30%, 40%, 50%, 60%, 70%, 80%, and 90% of the peak stress observed during the monotonic loading simulation, whereas the target lower limit stress is 1 MPa. Figure 7B displays the loading and unloading routes. The external stress envelope of the cyclic loading unloading curve is almost the same as that of the monotonic loading curve, according to the findings of comparing the monotonic loading and cyclic loading unloading modes of the 0 freeze-thaw sample (Figure 7C). The reduction in peak stress and the transition of the loading-unloading curve from dense to sparse in the former case are primarily attributed to the progressive accumulation of damage during the cyclic loading-unloading process (Zhou et al., 2010).
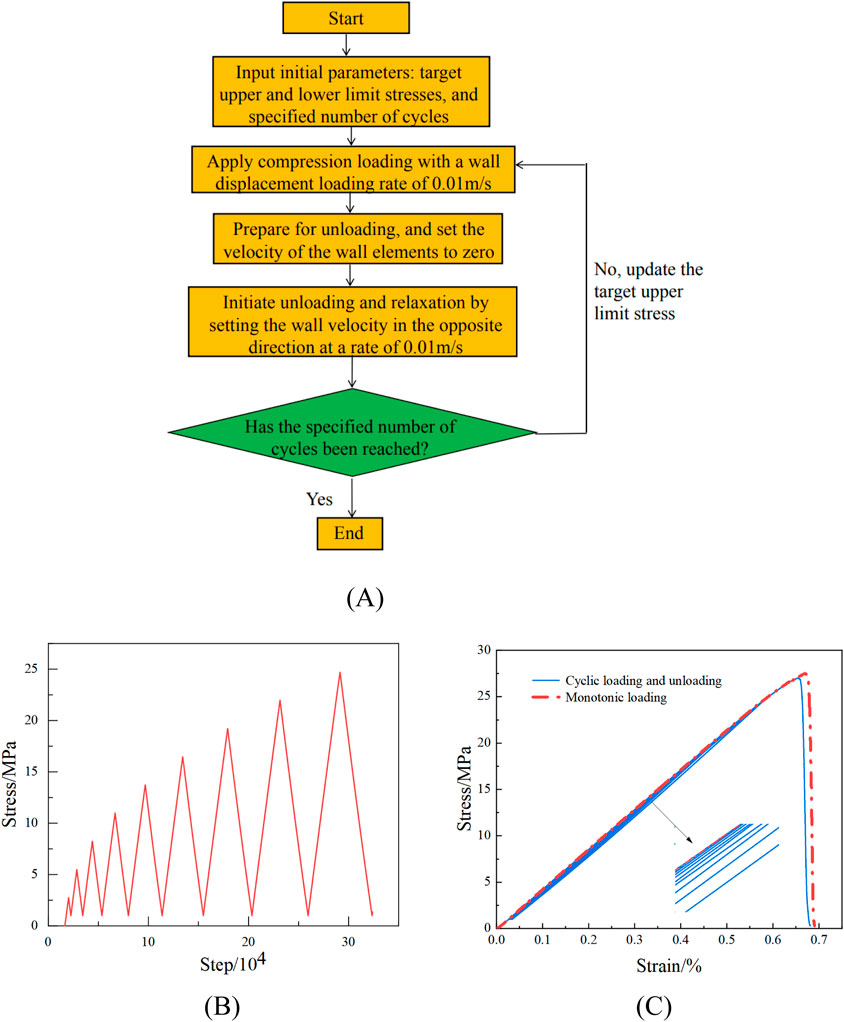
Figure 7. Cyclic loading and unloading simulation: (A) Schematic diagram of cyclic loading and unloading principle (B) Stress path of loading and unloading (C) Comparison of loading methods.
In this study, a step-wise cyclic loading and unloading method was employed, with a total of nine loading and unloading cycles conducted. The target lower stress limit was set at 1 MPa, while the target upper stress limits were set at 10%, 20%, 30%, 40%, 50%, 60%, 70%, 80%, and 90% of the peak stress observed in the monotonic loading simulation, respectively. The loading and unloading path is illustrated in Figure 7B.
5 Tests result and analysis
5.1 Analysis of deformation characteristics
The elastic modulus, a physical quantity that characterises the extent of material deformation, is used to quantify the strength of a rock’s resistance to deformation. A significant and permanent plastic deformation is brought on by the constant accumulation of rock damage throughout the loading and unloading procedure. To determine the elastic modulus in each cycle, we use the approach of Zhou et al. (2010), assuming that irreversible deformation happens in each cycle and accumulates with the increasing loading and unloading durations.
When the strain is loaded to the maximum axial stress (
Figure 8A illustrates how the elastic modulus of freeze-thaw rocks decreases with more loading and unloading cycles. The elastic modulus decreases from 3.714GPa to 3.551 GPa in sample subjected to 40 freeze-thaw cycles, mostly as a result of fatigue damage from cyclic loading. Furthermore, the propagation and extension of interior microcracks weaken the bonding force, which in turn decreased the mechanical properties of the rock. We can determine that more freeze-thaw cycles result in a lower rock’s elastic modulus by comparing the elastic modulus of three distinct types of freeze-thaw samples. This shows that freeze-thaw damage promotes the samples’ decreased stiffness. As seen in Figure 8B, the initial irreversible strain rises as the number of freeze-thaw cycles increases. The irreversible strain keeps increasing as loading and unloading cycles increase, and more frequent freeze-thaw cycles worsen the degree of the irreversible strain development in the rock. The irreversible strain of the 0, 20, and 40 test samples increase from the initial 0.0273%, 0.0293%, and 0.0342%–0.0338%, 0.0369%, and 0.0441%, respectively, with an increase of 0.0065%, 0.0076%, and 0.0099%. This indicates that the high freeze-thaw test samples have a greater accumulation of damage, a weaker ability to withstand deformation, and a severed ability to break and cause internal damage to the rock under cyclic loading.
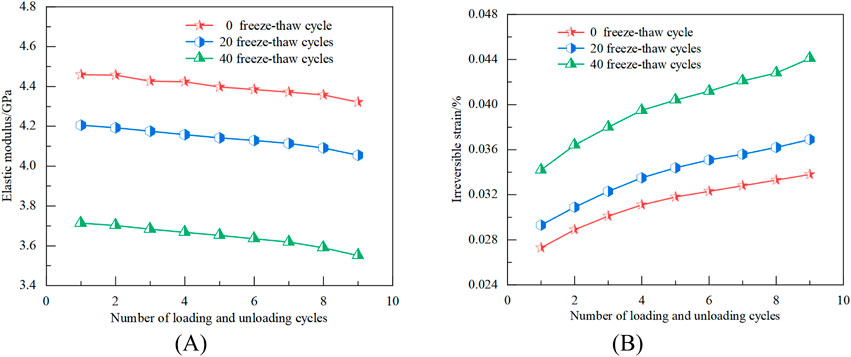
Figure 8. Changes of elastic modulus and irreversible strain under cyclic loading and unloading condition: (A) Change in elastic modulus (B) Irreversible strain change.
5.2 Analysis of microscopic breaking evolution characteristics
Freeze-thaw cycles promote damage in the rock, thereby influencing its fracture properties under strain. Freeze-thaw sandstone’s asymptotic cracking process under load is examined using samples from 0 to 40 freeze-thaw cycles as an example. The paper chooses the pre peak stage (roughly 50% of the peak stress), peak stage, post peak stage, and the stress field, velocity field, and block fragmentation characteristics of the fully destroyed sample for combined analysis during the unidirectional loading damage process after nine loading and unloading cycles. For the stress field and velocity field, negative values indicate the same direction as the external loading, meaning that the colder the colour, the higher the internal stress or velocity of the particle. Otherwise, the reverse is true.
Figure 9 displays the outcomes of the simulation. After achieving the maximal strength of the 0 freeze-thaw sample, the particle strain at the bottom of the sample is around 0 MPa from the strain field’s viewpoint, indicating the weak bonding between the particles there; The particle bonding force at the sample’s lower and higher right ends reduces as the strain drops to 14.42 MPa, indicating damage has occurred; A much reduced rock bearing capability during freeze-thaw cycles is shown by the 40 sample that are severely damaged in the pre-peak stage, as opposed to the former, with many particles dispersed throughout and broken bonding bonds; Particle peeling happened at the sample’s opposite end after it reached its peak intensity; Analysis of the fragmentation features of the blocks post-failure reveals the formation of an internal shear failure zone. When
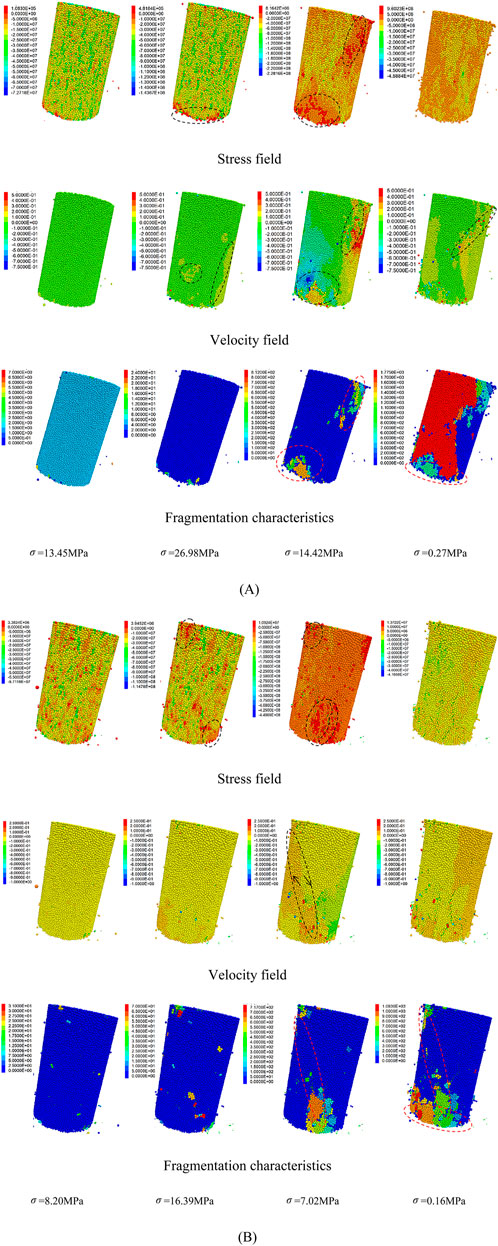
Figure 9. Stress field, velocity field, and fragmentation characteristics of Samples Under 0 and 40 freeze-thaw cycles: (A) zero freeze-thaw cycle (B) forty freeze-thaw cycles.
Particles move more after the peak stage when seen from the standpoint of the velocity field. The bottom and upper right ends of the velocity field, where breaking occurred, showed significant differences in the post-peak stage of the 0 freeze-thaw cycle sample. Some blocks are broken, and frictional movement under external force caused particle bonding strength to be weakened or even lost. With opposite particle velocities at both ends, the 40 freeze-thaw cycle sample in the post-peak stage demonstrated the formation of a separation zone from upper left to lower right. This shear fragmentation zone is further formed by the detachment tendency between the blocks and the friction and sliding between the particles at both ends of the separation zone.
5.3 Analysis of fabric distribution
Rock is a natural granular cohesive material. The bonding relationship is harmed in DEM because the external pressures are stronger than the bonding strength between the particles, which leads to fewer contacts and a lower contacting force. The fabric tensor is a crucial parameter for characterising fabric anisotropy. The rock fabric diagram enables a statistical analysis of the geographic distribution of contact numbers inside the three-dimensional model, therefore illustrating the anisotropic properties of the rock. Thornton’s (2000) fabric tensor calculation technique is used in this paper:
Where,
Figure 10 depicts the distribution of force chains and fabric in rocks subsequent to freeze-thaw cycles. The warmer colour tone of the power chain results in an increase in contact force. Based on their surface area, the fabric’s spheres are separated into triangular cylinders. Higher cylinders indicate more connections in that direction; The warmer the colour tone, the higher the cylinders. With the escalation of freeze-thaw cycles, the hue of the force chain progressively intensifies, and the quantity of contacts evenly rises in all directions, exhibiting no significant anisotropy. This phenomena results from the heightened cycles that cause water particles to perpetually expand and compress adjacent rock particles, disturbing the equilibrium state between particles and resulting in a constant rise in particle overlap. This effectively simulates the compressive impact of ice expansion on rock mineral particles during the freeze-thaw cycle (Zhou et al., 2013). Figure 11 illustrates the fabric distribution of the freeze-thaw specimen under stress. As freeze-thaw cycles grow, the quantity of horizontal contacts continues to rise. Conversely, the quantity of contacts in the vertical direction has a declining trend under monotonic loading, whereas it shows an ascending trend under cyclic loading. This suggests that the interplay of freeze-thaw cycles and various loading techniques modifies the spatial distribution of microcracks, leading to substantial alterations in rock anisotropy. The augmentation of horizontal contacts may, to a degree, modify the trajectory of force transmission, possibly resulting in the gradual failure of the sample and improving its ductility properties.
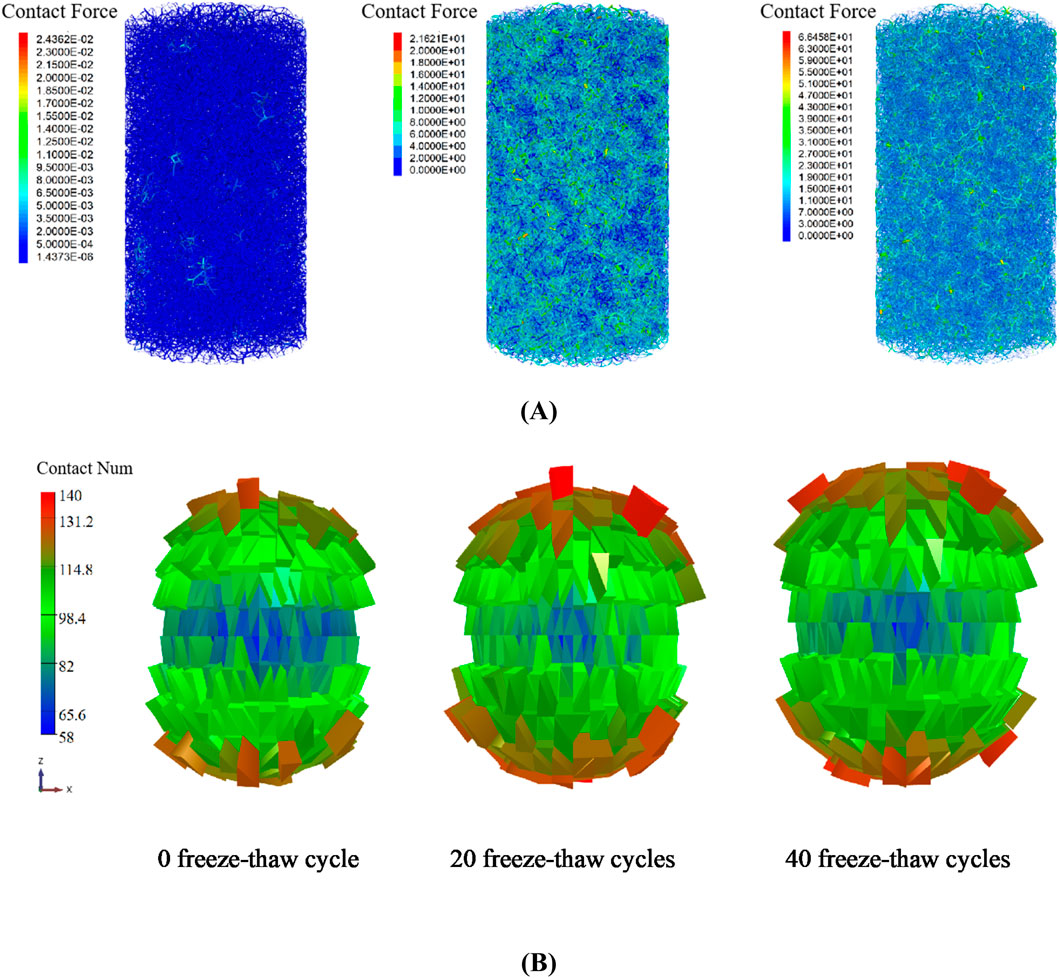
Figure 10. Distribution of force chains and fabric in samples after freezing and thawing cycles: (A) Distribution of force chain (B) Distribution of fabric.
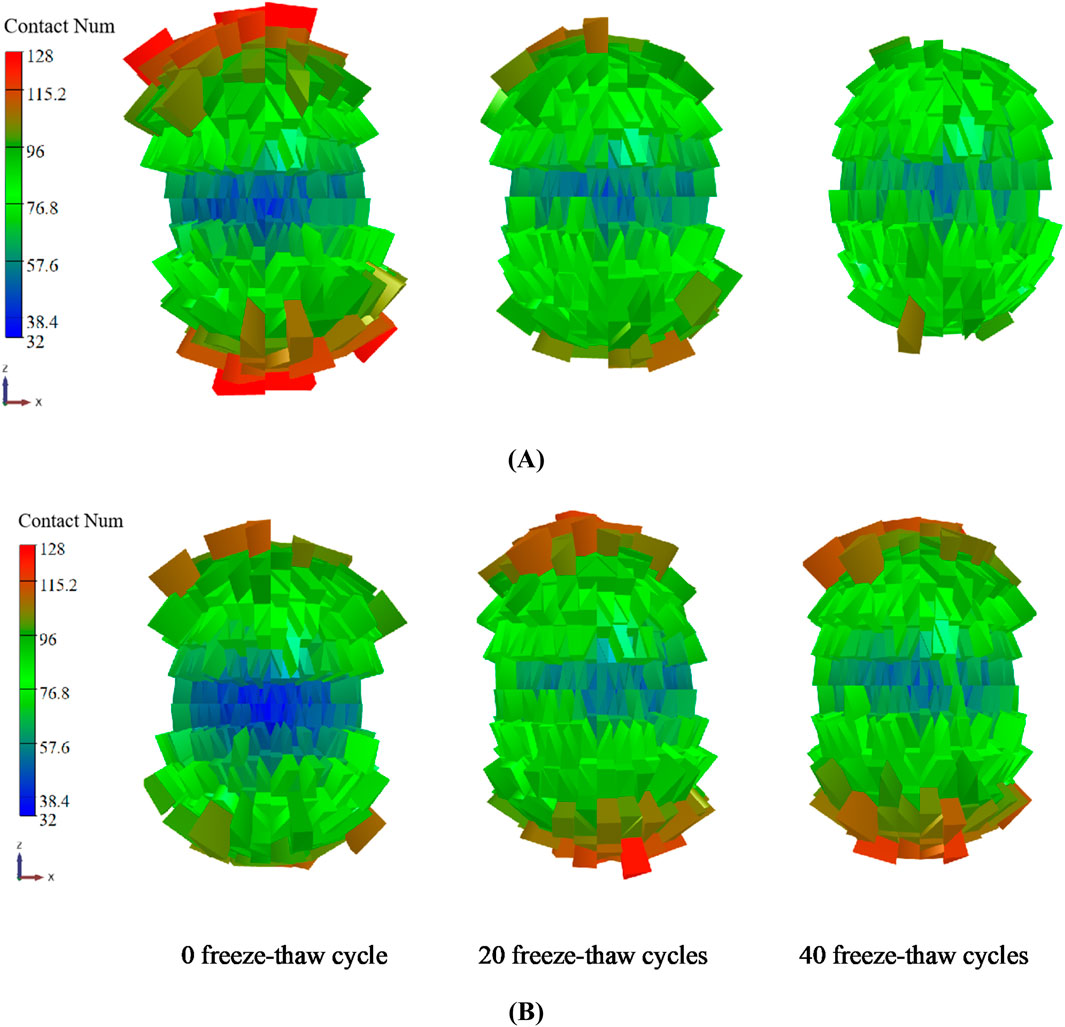
Figure 11. Fabric distribution in samples after loading: (A) Monotonic loading condition (B) Cyclic loading and unloading condition.
5.4 Acoustic emission moment tensor
Under the action of load, cracks within the rock propagate and extend until fracture occurs. This process is accompanied by the release of strain energy in the form of elastic waves to the outside, which is known as acoustic emission or microseismicity. This technique is commonly used in underground rock engineering for studying rock fracture mechanisms and monitoring and early warning purposes (Ishida et al., 2017). The moment tensor theory is used in DEM to analyse the mechanical properties of fracture development in acoustic emission events to ascertain the location, magnitude, and damage mechanism of cracks. Source particles are those that first made touch with both ends of the microcrack. The source particles move when contact breaking creates microcracks, and the altered particle overlap results in a modified contact force. If rapid fracture of the rock occurs within a short period of time, a large number of micro-cracks will be generated, and there will be significant changes in the forces and moments between particles in this area. These spatially and temporally close micro-cracks will cluster together to form a high-magnitude acoustic emission signal (Wang, 2021). The spatial location of an acoustic emission event is the geometric center of all microcracks, as seen in Figure 12.
The force change at the contact site is multiplied by the distance between the microcrack location and the contact point to get the moment tensor matrix component Mij (Zeng et al., 1995). The formula is as follows:
Where, ΔFi is the ith component of the changed contact force, and Rj is the jth component of the distance between the contact point and the center of the microcrack.
Calculating the scalar torque M0 by the moment tensor matrix, with the Formula as follows:
Where, mj is the jth eigenvalue of the moment tensor matrix.
Calculating the breaking strength (magnitude) M of the acoustic emission event by calculating the maximum value of scalar torque, with the Formula as follows:
There is physical relevance to the value b of acoustic emission, which is a characteristic parameter of acoustic emission occurrences. Seismological patterns of seismic activity are specifically described by the value b. The size and distribution of microcracks inside rocks may be better understood by analysing value b in rock mechanics study. According to Yao et al. (2024), a big value for b indicates that the sample has a large number of tiny and medium-sized cracks, whereas a small value for b indicates that the sample contains more large-scale fractures.
The value of b may be determined using the following formula, which accounts for the correlation between the frequency of acoustic emission events and the intensity of acoustic emission breaking:
Where, N is the frequency of acoustic emission events, and a and b are constants.
Figure 13 compares the acoustic emission events frequency with the breaking strength of freeze-thaw samples under various loading conditions. When looking at the scatter plot of acoustic emission buildup and breaking intensity in logarithmic coordinates, the nearly straight line’s absolute slope is represented by b value (rupture intensity −6.9 to −6.4).
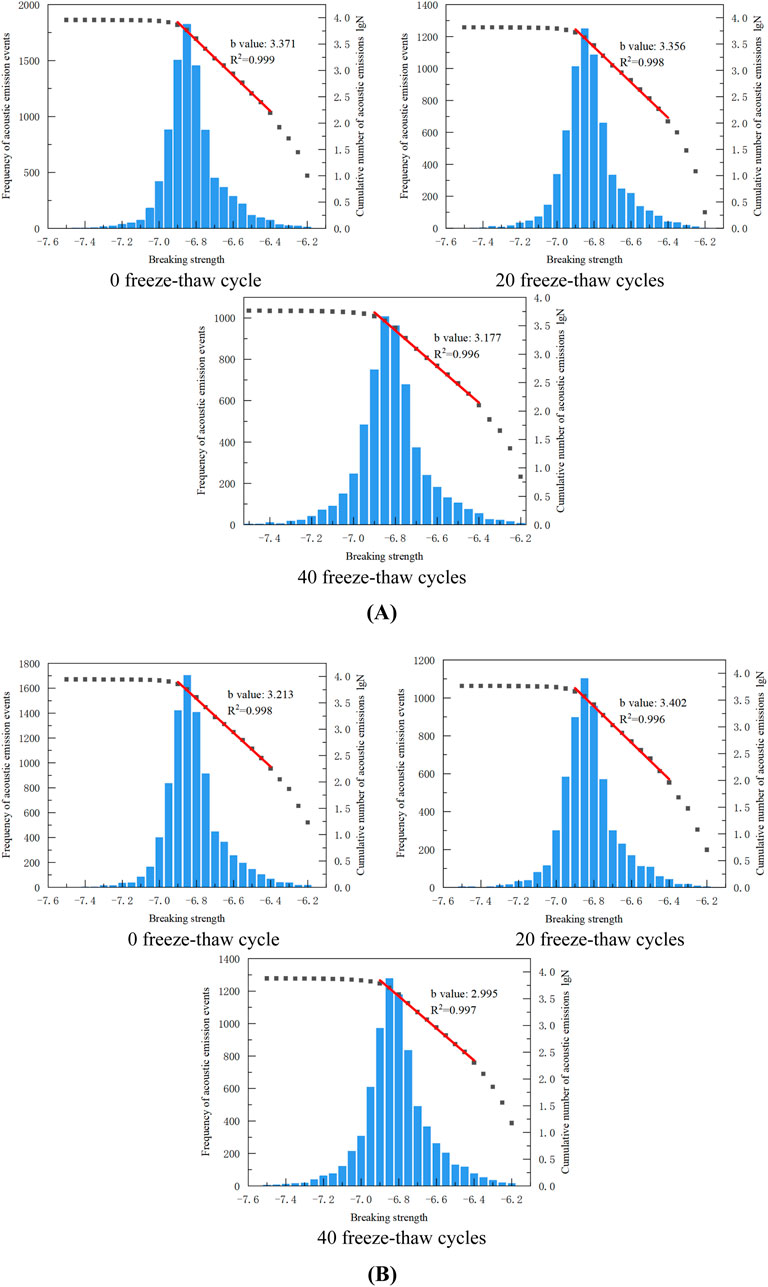
Figure 13. The relationship between the frequency of acoustic emission events and breaking strength of the sample: (A) Monotonic loading condition (B) Cyclic loading and unloading condition.
Figure 13 shows that the acoustic emission breaking intensity and the frequency of freeze-thaw red sandstone basically follow a normal distribution, with the breaking strength mainly ranging from −7.1 to −6.5. The maximum frequency of the 0 freeze-thaw sample at the breaking strength of −6.85 can reach 1,823 under monotonic loading conditions, with a value of 3.371, indicating a large number of small and medium-sized cracks; the sample’s b value after 20 freeze-thaw cycles is 3.356, indicating a greater proportion of medium to large-sized cracks. There are more large-scale cracks, as evidenced by the sample’s value b of 3.177 after 40 freeze-thaw cycles; Under cyclic unloading and loading, the maximum frequency of 0 freeze-thaw cycle sample can reach 1,705, with a value b of 3.213; The sample’s value b after 20 freeze-thaw cycles is 3.402, and the sample’s value b after 40 freeze-thaw cycles dropped to 2.995. Overall, the intensification of freeze-thaw damage promotes the formation of large-scale cracks in rocks. This is because the freeze-thaw action reduces the cohesive force between rock mineral particles, leading to the emergence of numerous micro-fractures. Under load, micro-cracks in a certain area are more likely to converge and form macroscopic cracks within a short period of time, releasing high-magnitude signals and resulting in large-scale cracks. The fatigue damage caused by cyclic loading facilitates the propagation and extension of micro-fractures as well as the frictional slip between crack surfaces, making the sample more prone to large-scale failure.
Figure 14 illustrates the microcracks, acoustic emission moment tensors, and magnitude distribution of red sandstone during 40 freeze-thaw cycles under cyclic stress. The graphic illustrates that the sample’s base has significant fragmentation, with a shear failure zone developed centrally, extending through the rock. The concentrated regions of the moment tensor and significant rupture events are mostly situated in the top left and lower right extremities of the rock. These findings suggest that, due to freeze-thaw damage, fractures at both ends of the laden rock propagate and nucleate, resulting in macroscopic damage that expands and converges towards the centre. The spatial distribution of acoustic emission events is more concentrated, exhibiting a greater frequency of large-scale ruptures, which eventually leads to instability and failure of the sample. This aligns with the findings derived from the acoustic emission b-value, indicating that the moment tensor theory is appropriate for examining the loading characteristics of freeze-thaw rocks.
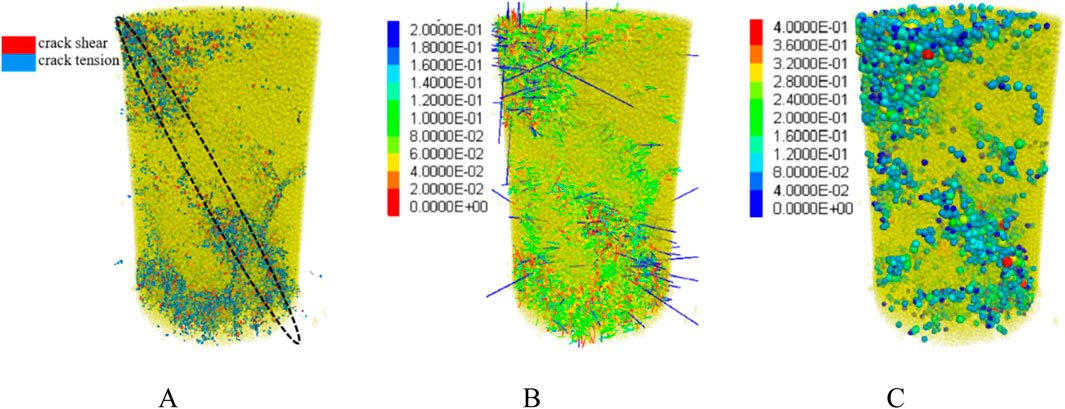
Figure 14. Distribution of microbreakings, moment tensors, and magnitudes in the sample: (A) Microbreakings (B) Moment tensor (C) Magnitude.
5.5 Analysis of energy evolution law
The deformation and damage process of loaded rocks exhibits the absorption and release of energy. The boundary energy U that the wall’s work inputs is transformed into strain energy Ue, which is then stored in the contact keys, and dissipative energy Ud, which is utilised for particle motion, assuming that there is no heat exchange in the DEM. From a microscopic standpoint, dissipated energy is made up of kinetic energy Ed, dashpot energy Eβ, and slip energy Eµ, while strain energy is made up of elastic strain energy Ek and bond strain energy
where,
The energy conversion connection between rock deformation and breaking may be characterised by applying the ratio of accumulated dissipative energy to input energy at every strain level. The following is the formula used to calculate the dissipative energy conversion rate:
To explore the energy evolution patterns of freeze-thaw sandstone under cyclic loading and analyze the microscopic energy changes in red sandstone subjected to different freeze-thaw cycles, refer to Figure 15.
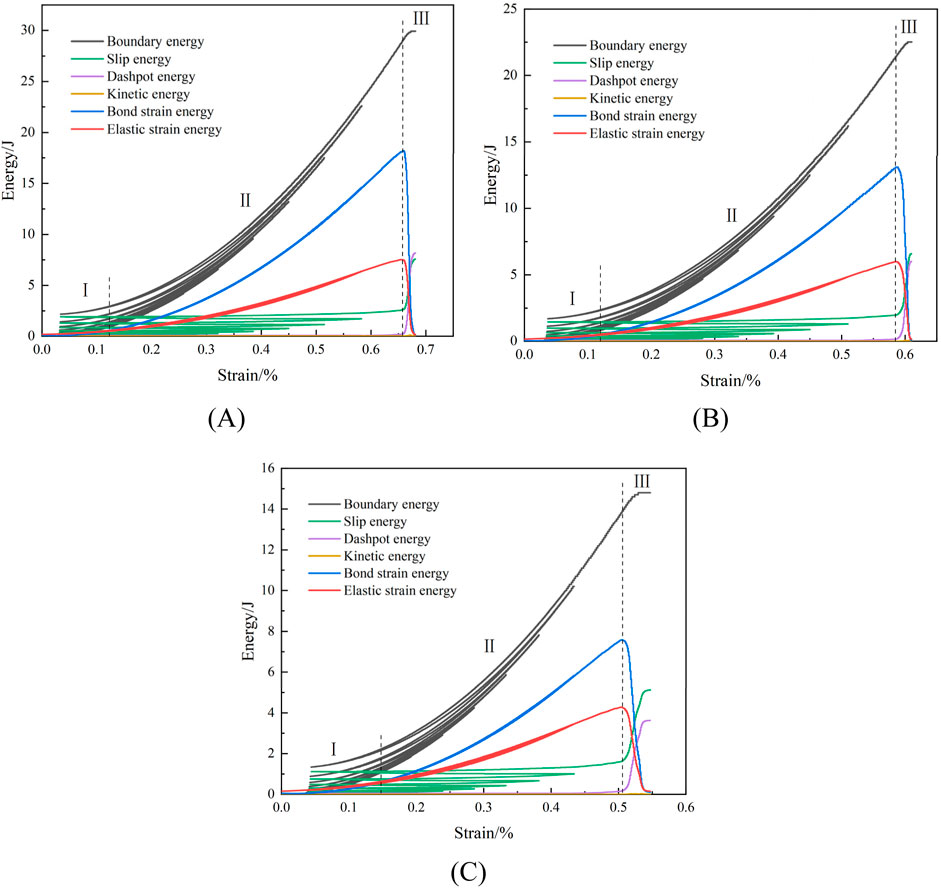
Figure 15. Energy evolution law at the mesoscale of sandstone under different freeze-thaw cycles: (A) 0 freeze-thaw cycle (B) 20 freeze-thaw cycles (C) 40 freeze-thaw cycles.
Figure 15 illustrates that the deformation and collapse of rock is a process characterised by energy intake, buildup, dissipation, and release. The energy development process of red sandstone exposed to various freeze-thaw cycles is delineated as follows: During the first stage (I), the boundary energy imparted by the external force (wall work) is mostly transformed into strain energy, with the elastic strain energy stored exceeding the bond strain energy. In the accumulation stage (II), the boundary energy is mostly converted into strain energy and slip energy. As the stress intensifies, the rate of accumulation of bond strain energy surpasses that of elastic strain energy, while slip energy also progressively builds. During the release phase (III), the elastic strain energy and bond strain energy attain their maximum storage capacities and thereafter dissipate or release as slip energy, dashpot energy, and a little quantity of kinetic energy. This dissipative energy is mostly used for the creation and advancement of macroscopic fractures, together with the frictional movement between crack surfaces, resulting in heightened rock damage and eventually unstable collapse. The ascending curve of energy alterations seen in stages I and II correlates with the fluctuations in stress and strain during the loading and unloading phases, demonstrating notable “memory” characteristics.
Figure 16A illustrates the development laws of the elastic strain energy and bond strain energy of red sandstone during various freeze-thaw cycles. As the degree of degradation from freeze-thaw damage increases, the sample’s energy storage limit significantly drops, and the bond strain energy and elastic strain energy fall to varying degrees. The sample from the 0 freeze-thaw cycle has elastic strain energy of 7.53J and bond strain energy of 18.2J. 40 freeze-thaw cycles sample has elastic strain energy of 4.28J and bond strain energy of 7.53J, respectively. These values are 43.2% and 58.5% lower than those from prior study, revealing that freeze-thaw cycles negatively impact the energy storage capacity of rocks, suggesting that the energy conversion process of the rocks becomes more unstable and susceptible to failure.
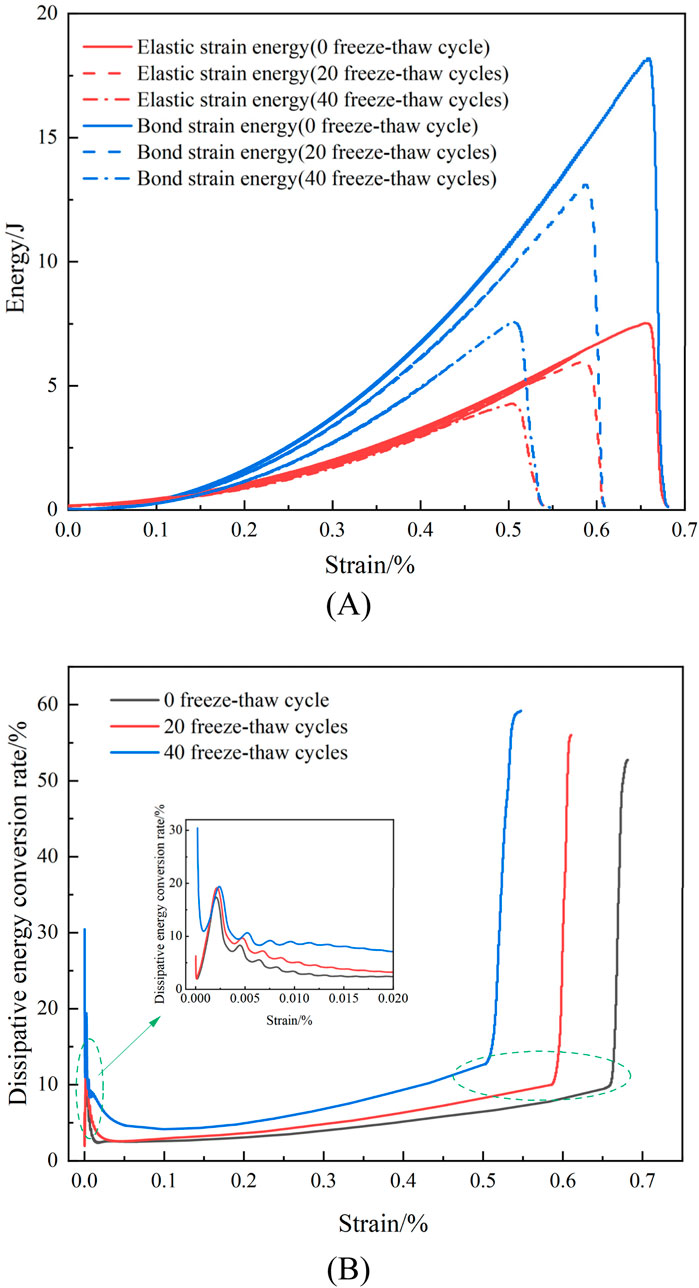
Figure 16. Laws of strain and dissipative energy evolution: (A) Laws of elastic and bond strain energy evolution (B) Dissipative energy conversion rate.
Figure 16B displays the red sandstone’s dissipative energy conversion rate with various freeze-thaw cycles. The data of each loading peak point is used to choose the energy dissipation rate of the cyclic load section in order to simplify the depiction. As seen in the picture, the energy dissipation rate can be separated into three stages with the increasing strain: fluctuation, steady growth, and rapid growth. Specifically, during the fluctuation stage, the sample’s initial energy dissipation rate increases with the number of freeze-thaw cycles. This is because the rock has been damaged under freeze-thaw pressure, and many particles experience frictional sliding between them after loading, resulting in energy dissipation; In the stable growth stage, the frequent freeze-thaw samples internal damage is more severe, and more energy is used for crack initiation and propagation, speeding up the degree of damage to rock energy storage structures and lowering the energy storage limit; In the accelerated growth stage, the maximum energy dissipation rates of the 0, 20, and 40 freeze-thaw cycles samples are 52.8%, 56.1%, and 59.2%, respectively. More severe energy dissipation in rocks is caused by the frictional sliding of fracture surfaces and the extensive expansion of many crack zones.
6 Discussion
In tunnel engineering, the effects of freeze-thaw cycles and cyclic loading cannot be ignored. After the tunnel is constructed, the original geothermal equilibrium of the strata is disrupted, and a new heat exchange system forms (Wang et al., 2024). As a result, the surrounding rock of the tunnel undergoes periodic freezing and thawing processes. During these processes, the freezing and thawing of water in the pores of the rock exacerbate rock weathering, damage its internal structure, and subsequently reduce the stability of the surrounding rock. Simultaneously, the frost heave force generated by freeze-thaw cycles imposes cyclic loading on the tunnel lining structure. This loading fluctuates periodically with seasonal changes, causing repeated loading and unloading on the lining structure, which can easily lead to fatigue effects in the lining materials and subsequently trigger local irreversible deformations (Ge et al., 2003). The combined effects of freeze-thaw cycles and cyclic loading exacerbate tunnel damage, shorten its service life, and directly threaten tunnel operational safety. The emergence of phenomena such as cracks, spalling, and collapses not only affects tunnel traffic capacity but also poses potential serious safety hazards. Furthermore, freeze-thaw action can also result in water accumulation and ice formation within the tunnel (Figure 17A) (Chen, 2023). In summary, these factors not only complicate the elastic-plastic damage evolution of the surrounding rock but also inevitably lead to increased maintenance and repair costs for the lining structure, posing significant economic pressures on the long-term operation of the tunnel. Similarly, many large open-pit coal mines in western China feature numerous high and steep slopes. Due to the unique climatic conditions in cold regions, slopes undergoing long-term freeze-thaw cycles often experience surface collapses as a primary form of failure (Figure 17B). Coupled with the vibrational loads from blasting, excavation, and traffic during mining operations, this not only affects slope stability but also poses a risk of more severe landslides and debris flows, threatening the safety of mining operations.
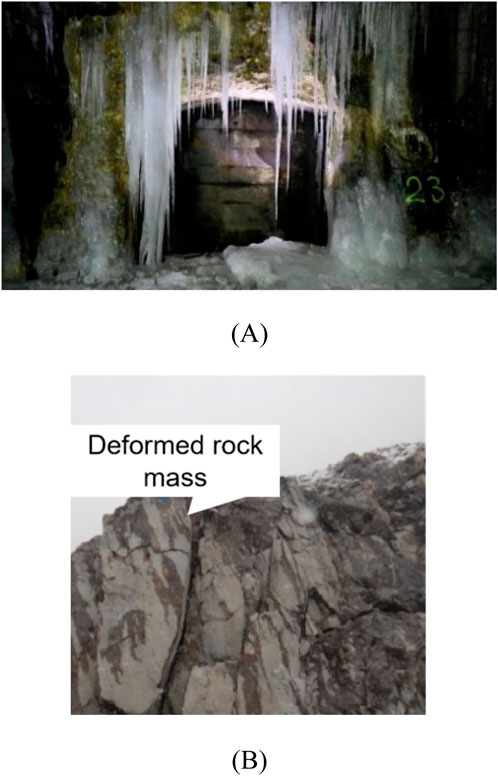
Figure 17. Freeze-thaw disasters in tunnel and slope engineering (Qiao, 2019): (A) Ice formation on tunnel lining (B) Unstable rock on slope.
In the present study, the freeze-thaw cycle process is simulated through water particle expansion in DEM numerical simulations, and an in-depth analysis is conducted on the micromechanical response characteristics of freeze-thawed rock under cyclic loading conditions, enriching the research field of freeze-thaw rock mechanics. For future tunnel excavation in cold regions, slope stability assessments, and the design of remediation schemes, by incorporating DEM numerical simulations, we can further consider developing more realistic three-dimensional models of tunnels and slopes with accurate geometric shapes and boundary conditions, providing a firmer scientific foundation for engineering projects in complex geological settings.
7 Conclusion
Using the results of indoor test parameter calibration and the numerical simulation of the DEM to create a 3D particle model of freeze-thaw rocks, this paper analyses the deformation characteristics, microscopic fracture evolution features, fabric distribution, acoustic emission moment tensor, and energy evolution laws of freeze-thaw red sandstones under cyclic loading. The following conclusions are drawn:
(1) Both augmented freeze-thaw cycles and loading-unloading cycles result in a reduction of the elastic modulus and an elevation of irreversible strain in the rock. The rock experiences cumulative plastic deformation under cyclic stress as a consequence of freeze-thaw damage, which also decreases the rock’s stiffness and anti-deformation ability. Analysis and comparison of the stress and velocity fields of samples from 0 to 40 freeze-thaw cycles show that the cycle significantly reduces the mechanical properties of the rock, resulting in looser particles, a greater degree of block breakage, and a decreased bearing capacity.
(2) An effective simulation of the compressive impact of ice expansion on mineral particles is provided by the freeze-thaw cycle. Rock anisotropy will vary significantly as a consequence of different loading techniques that alter the spatial arrangement of microcracks in the freeze-thaw samples. The freeze-thaw red sandstones have a normal distribution in both the frequency and intensity of acoustic emission breakdown. Microcracks may more easily spread and accumulate due to the intensification of freeze-thaw damage, while large-scale fractures are encouraged to grow by cyclic loads. The rock is pierced by shear breaking zones in sample after 40 freeze-thaw cycles, which also shows increased large-scale breaking and a concentrated spatial distribution of acoustic emission events.
(3) The energy development of red sandstone is categorised into three phases: initial phase, accumulation phase, and release phase. Freeze-thaw damage diminishes the energy storage capacity of the rock, resulting in a substantial reduction in both elastic strain energy and bond strain energy. The energy conversion process destabilises, and the dissipative energy conversion rate escalates with the frequency of freeze-thaw cycles. The extent of damage to the energy storage structure escalates in samples exposed to several freeze-thaw cycles, leading to increased energy dissipation in the rock.
(4) This work investigates the microscopic damage properties of freeze-thaw red sandstone subjected to cyclic stress, therefore improving our comprehension of the degradation processes of rocks in intricate freeze-thaw and engineering contexts. It offers substantial insights for rock engineering building and catastrophe mitigation in frigid locations. The DEM numerical simulation of freeze-thaw cycles used in this work simplifies the particle structure and neglects temperature inhomogeneity and variations in porosity. Future study will concentrate on resolving these challenges to more accurately depict the impact of freeze-thaw degradation in rocks.
Data availability statement
The original contributions presented in the study are included in the article/supplementary material, further inquiries can be directed to the corresponding author.
Author contributions
LS: Writing–original draft. PL: Funding acquisition, Supervision, Writing–review and editing. CP: Funding acquisition, Writing–review and editing. PJ: Writing–review and editing.
Funding
The author(s) declare that financial support was received for the research, authorship, and/or publication of this article. This research was funded by the Open Research Fund of The State Key Laboratory of Coal Resources and Safe Mining, CUMT (No. SKLCRSM22KF017), the Scientific Research Foundation for High-level Talents of Anhui University of Science and Technology (No. 2022yjrc80), the National Natural Science Foundation of China (No. 52074006), Natural Science Research Project of Anhui Educational Committee (No. 2023AH051227).
Conflict of interest
The authors declare that the research was conducted in the absence of any commercial or financial relationships that could be construed as a potential conflict of interest.
Generative AI statement
The author(s) declare that no Generative AI was used in the creation of this manuscript.
Publisher’s note
All claims expressed in this article are solely those of the authors and do not necessarily represent those of their affiliated organizations, or those of the publisher, the editors and the reviewers. Any product that may be evaluated in this article, or claim that may be made by its manufacturer, is not guaranteed or endorsed by the publisher.
References
Amitrano, D., Gruber, S., and Girard, L. (2012). Evidence of frost-cracking inferred from acoustic emissions in a high-alpine rock-wall. Earth Planet Sci. Lett. 341, 86–93. doi:10.1016/j.epsl.2012.06.014
Argandoa, V., Rey, A., Celorio, C., del Río, L., Calleja, L., and Llavona, J. (1999). Characterization by computed X-ray tomography of the evolution of the pore structure of a dolomite rock during freeze-thaw cyclic tests. Phys. Chem. Earth 24 (7), 633–637. doi:10.1016/s1464-1895(99)00092-7
Chen, S. (2023). Study on the damage characteristics and triaxial cyclic loading and unloading constitutive model of sandstone after freeze-thaw cycles. Guangxi University. [NanNing (GuangXi)]. Dissertation.
Cheng, H., Han, F., and Li, Y. (2023). Study on characteristics and influence factor of meso-energy transformation in rock based on discrete element. Met. Mine (04), 58–64. doi:10.19614/j.cnki.jsks.202304010
Duca, S., Alonso, E. E., and Scavia, C. (2015). A permafrost test on intact gneiss rock. Int. J. Rock Mech. Min. 77, 142–151. doi:10.1016/j.ijrmms.2015.02.003
Fu, H., Li, H., Li, J., and Hu, K. (2024). Research on freezing-dynamic combined damage characteristics of carbonaceous phyllite in cold region. J. China Coal Soc. 49 (S1), 274–284. doi:10.13225/j.cnki.jccs.2023.0643
Ge, X., Jiang, Y., Lu, Y., and Ren, J. (2003). Testing study on fatigue deformation law of rock under cyclic loading. Chin. J. Rock Mech. Eng. 22 (10), 1581–1585.
Guo, J., Zhang, Z., Tang, Y., and Ji, J. (2020). A simplified viscoelastic solution of the frost heaving force of cavity water behind tunnel linings. Adv. Civ. Eng. 2020, 1–8. doi:10.1155/2020/8857580
Huang, S., Liu, Q., Liu, Y., Ye, Z., and Cheng, A. (2018). Freezing strain model for estimating the unfrozen water content of saturated rock under low temperature. Int. J. Geomech. 18 (2), 04017137. doi:10.1061/(ASCE)GM.1943-5622.0001057
Ishida, T., Labuz, J. F., Manthei, G., Meredith, P. G., Nasseri, M. H. B., Shin, K., et al. (2017). ISRM suggested method for laboratory acoustic emission monitoring. Rock Mech. Rock Eng. 50 (3), 665–674. doi:10.1007/s00603-016-1165-z
Kolay, E. (2016). Modeling the effect of freezing and thawing for sedimentary rocks. Environ. Earth Sci. 75 (3), 210. doi:10.1007/s12665-015-5005-3
Liu, Q., Huang, S., Kang, Y., and Pan, Y. (2016). Study of unfrozen water content and frost heave model for saturated rock under low temperature. Chin. J. Rock Mech. Eng. 35 (10), 2000–2012. doi:10.13722/j.cnki.jrme.2015.1157
Liu, T., Xie, Y., Feng, Z., Luo, Y., Wang, K., and Xu, W. (2020). Better understanding the failure modes of tunnels excavated in the boulder-cobble mixed strata by distinct element method. Eng. Fail Anal. 116, 104712. doi:10.1016/j.engfailanal.2020.104712
Martínez-Martínez, J., Benavente, D., Gomez-Heras, M., Marco-Castano, L., and Angeles Garcia-del-Cura, M. (2013). Non-linear decay of building stones during freeze-thaw weathering processes. Constr. Build. Mater. 38, 443–454. doi:10.1016/j.conbuildmat.2012.07.059
Park, K., Kim, K., Lee, K., and Kim, D. (2020). Analysis of effects of rock physical properties changes from freeze-thaw weathering in Ny-Alesund Region:Part 1-Experimental Study. Appl. Sci. 10 (5), 1707. doi:10.3390/app10051707
Qiao, G. (2019). Study on the mechanism of the freeze-thaw slope and rock mass quality evaluation system in Tianshan Mountain area [master's thesis]. Chengdu University of Technology. [ChengDu (SiChuan)]. Dissertation.
Shen, Y., Wang, Y., Wei, X., Jia, H., and Yan, R. (2020). Investigation on meso-debonding process of the sandstone-concrete interface induced by freeze-thaw cycles using NMR technology. Constr. Build. Mater. 252, 118962. doi:10.1016/j.conbuildmat.2020.118962
Shi, Z., Li, J., Wang, J., Chen, J., Lin, H., and Cao, P. (2023). Experimental and numerical study on fracture characteristics and constitutive model of sandstone under freeze-thaw-fatigue. Int. J. Fatigue 166, 107236. doi:10.1016/j.ijfatigue.2022.107236
Song Y, Y., Sun, Y., Li, C., Yang, H., Zhang, L., and Xie, L. (2023). Study on meso-fracture evolution characteristics of sandstone after freeze-thaw cycles based on discrete element method simulation. Rock Soil Mech. 44 (12), 3602–3616. doi:10.16285/j.rsm.2023.0448
Song, Y., Zhang, L., Ren, J., and Zhang, K. (2019). Experimental study on mechanical properties of red sandstone under cyclic loading after freezing-thawing cycles. Coal Eng. 51 (02), 112–117. doi:10.11799/ce201902025
Song Z, Z., Wu, Y., Zhang, Y., Yang, Y., and Yang, Z. (2023). Mechanical responses and acoustic emission behaviors of coal under compressive differential cyclic loading (DCL): a numerical study via 3D heterogeneous particle model. Int. J. Coal Sci. Techn 10, 31. doi:10.1007/s40789-023-00589-2
Sun, L., Lou, P., Pan, C., and Ji, P. (2024). Mechanical properties and DEM-based simulation of double-fractured sandstone under cyclic loading and unloading. Sustainability 16, 9000. doi:10.3390/su16209000
Tan, H., Song, Y., Guo, X., Meng, F., Han, D., and Sun, Y. (2022). Research on meso-damage and strain localization of fractured sandstone after freeze-thaw cycles. Chin. J. Rock Mech. Eng. 41 (12), 2485–2496. doi:10.13722/j.cnki.jrme.2022.0126
The Professional Standards Compilation Group of People’s Republic of China (2001). SL264—2001 Specifications for rock tests in water conservancy and hydroelectric engineering. Beijing: China Water and Power Press.
Thornton, C. (2000). Numerical simulations of deviatoric shear deformation of granular media. Géotechnique. 50, 43–53. doi:10.1680/geot.2000.50.1.43
Tran, K., Bui, H., Sánchez, M., and Kodikara, J. (2020). A DEM approach to study desiccation processes in slurry soils. Comput. Geotech. 120, 103448. doi:10.1016/j.compgeo.2020.103448
Wang, F., Cao, P., Wang, Y., Hao, R., Meng, J., and Shang, J. (2020). Combined effects of cyclic load and temperature fluctuation on the mechanical behavior of porous sandstones. Eng. Geol. 266, 105466. doi:10.1016/j.enggeo.2019.105466
Wang, M. (2017). “Research on fatigue damage and fracture of solo-joint fissure rocks body under the freeze-thawing and loading-unloading cyclic condition master's thesis,” in XiAn (ShanXi): xian university of science and technology.
Wang, X. (2021). Study on the crack source mechanism from quantitative inversion and its mechanical behaviors during coal and rock fracture [master's thesis]. China University of Mining and Technology. [XuZhou (JiangSu)]. Dissertation.
Wang, Z., Yu, M., Wang, L., Xie, H., Xu, Y., and Wang, L. (2024). Strength degradation characteristics and damage constitutive model of sandstone under freeze-thaw cycles. Sci. Rep. 14, 22674. doi:10.1038/s41598-024-72974-z
Wen, L., Li, X., Tang, H., and Weng, L. (2017). Study of physico-mechanical characteristics of rock under different frozen-thawed circle temperature range and its engineering application. Eng. Mech. 34 (05), 247–256. doi:10.6052/j.issn.1000-4750.2015.11.0921
Yao, W., Liu, X., Liu, B., Fan, Y., Zhu, L., and Zheng, Z. (2024). Experimental and numerical simulation study on mechanical properties of coal-transition layer-rock composite structure. Chin. J. Rock Mech. Eng. 43 (01), 184–205. doi:10.13722/j.cnki.jrme.2023.0334
Yin, P., Yang, S., Gao, F., and Tian, W. (2023). Experiment and DEM simulation study on mechanical behaviors of shale under triaxial cyclic loading and unloading conditions. Geomech. Geophys. Geo-energ. Geo-resour. 9, 10. doi:10.1007/s40948-023-00554-y
Yu, J., Zhang, Q., Jia, C., Lei, M., Zhao, C., Pang, R., et al. (2023). Experimental and DEM simulations of the mechanical properties of rock under freeze-thaw cycles. Cold Reg. Sci. Technol. 211, 103866. doi:10.1016/j.coldregions.2023.103866
Zeng, Z., Ma, J., Liu, L., and Liu, T. (1995). Dynamic characteristics and significance of acoustic emission b-value during rock rupture extension. Seismlogy Geol. (01), 7–12.
Zhang, H., Xia, H., Yang, G., Zhang, M., Peng, C., Ye, W., et al. (2018). Experimental research of influences of freeze-thaw cycles and confining pressure on physical-mechanical characteristics of rocks. J. China Coal Soc. 43 (02), 441–448. doi:10.13225/j.cnki.jccs.2017.0098
Zhang, M., Zhang, X., Lu, J., Pei, W., and Wang, C. (2019). Analysis of volumetric unfrozen water contents in freezing soils. Exp. Heat. Transf. 32 (4/6), 426–438. doi:10.1080/08916152.2018.1535528
Zhang, X., Lai, Y., Yu, W., and Zhang, S. (2022). Non-linear analysis for the freezing–thawing situation of the rock surrounding the tunnel in cold regions under the conditions of different construction seasons, initial temperatures and insulations. Tunn. Undergr. Space Technol. 17, 315–325. doi:10.1016/S0886-7798(02)00030-5
Zhou, J., Yang, X., Fu, W., Xu, J., Li, H., Zhou, H., et al. (2010). Experimental test and fracture damage mechanical characteristics of brittle rock under uniaxial cyclic loading and unloading conditions. Chin. J. Rock Mech. Eng. 29 (06), 1172–1183.
Zhou, X., Li, C., and Zhou, L. (2020). The effect of microstructural evolution on the permeability of sandstone under freeze-thaw cycles. Cold Reg. Sci. Technol. 177, 103119. doi:10.1016/j.coldregions.2020.103119
Zhou, Y., Wu, S., Xu, X., Sun, W., and Zhang, X. (2013). Particle flow analysis of acoustic emission characteristics during rock failure process. Chin. J. Rock Mech. Eng. 32 (05), 951–959.
Keywords: DEM, freeze-thaw cycle, cyclic load, acoustic emission, energy evolution, microscopic damage
Citation: Sun L, Lou P, Pan C and Ji P (2024) A study on microscopic damage characteristics of freeze-thaw sandstone cyclic loading and unloading based on DEM. Front. Mater. 11:1521874. doi: 10.3389/fmats.2024.1521874
Received: 03 November 2024; Accepted: 26 November 2024;
Published: 13 December 2024.
Edited by:
Jiangyu Wu, China University of Mining and Technology, ChinaReviewed by:
Amir Ali Shahmansouri, Washington State University, United StatesZhenyu Zhang, Chongqing University, China
Xingkai Wang, Shaoxing University, China
Tongqiang Xiao, Henan Polytechnic University, China
Copyright © 2024 Sun, Lou, Pan and Ji. This is an open-access article distributed under the terms of the Creative Commons Attribution License (CC BY). The use, distribution or reproduction in other forums is permitted, provided the original author(s) and the copyright owner(s) are credited and that the original publication in this journal is cited, in accordance with accepted academic practice. No use, distribution or reproduction is permitted which does not comply with these terms.
*Correspondence: Peijie Lou, cGpsb3VAYXVzdC5lZHUuY24=
 Lichen Sun
 Peijie Lou1,2*
 Cheng Pan