- 1Comac Shanghai Aircraft Manufacturing Co., Ltd., Shanghai, China
- 2School of Mechanical Engineering, Nantong University, Nantong, China
To investigate the effect of power density on the residual stress distribution on the surface of 17-7 PH stainless steel welded joints during laser shock process, we utilized ABAQUS finite element software for analyzing its distribution under different laser shock power densities. The material was tested for residual stress using an X-ray stress diffractometer to verify the accuracy of the simulation results and lay the foundation for finding the optimal process parameters. The simulation results show that when the laser power density is 2.79 GW/cm2, the maximum residual compressive stress value on the surface of the sample after laser shock peening is −37.2 MPa; When the laser power density is 2.79 GW/cm2, the maximum residual compressive stress value on the surface of the sample is −94.1 MPa; When the power density reaches 5.17 GW/cm2, the maximum residual stress value on the surface of the laser shock peening sample is −144.8 MPa, and residual stress cavity is formed. The experimental results show that when the laser power density is 2.79 GW/cm2, the maximum residual compressive stress on the surface of the sample is −37.3 MPa; When the power density is 3.98 GW/cm2, the uniformity of compressive stress distribution on the surface of the sample is optimal, with a maximum residual compressive stress value of −99.0 MPa; When the power density is 5.17 GW/cm2, the maximum residual compressive stress value is −146.1 MPa, and residual stress cavity is formed on the material surface. The simulation results are close to the experimental results, and the model error ranges from 0.2% to 4.9%. The simulation results are accurate and reliable.
1 Introduction
Civil aviation components demand high safety, reliability, and balanced economic considerations. This is especially true for critical load-bearing structural components such as fuselage main beams, drive mechanisms, and landing gear, which require corrosion resistance. High-strength stainless steels, known for their excellent mechanical properties and corrosion resistance, have been widely utilized in the aerospace industry (Samaniego-Gamez et al., 2022). Stainless steels such as 17-7 PH are primarily used for corrosion-resistant load-bearing structural components, including various pipes, springs, fasteners, as well as engine parts and hydraulic systems (Berthe et al., 2011; Yip and Wang, 2003). The 17-7 PH stainless steel is a typical semi-austenitic precipitation-hardening stainless steel that can achieve high strength and good toughness through heat treatment (Xu and Yu, 2008). However, some weld joints of 17-7 PH are susceptible to stress corrosion which significantly impacts aircraft safety. Therefore addressing this issue is imperative.
Laser shock peening (LSP) is an advanced surface treatment technology that utilizes high-energy laser pulses to generate intense shock waves on the material surface, creating a layer of residual compressive stress (Lu et al., 2019; Schwab et al., 2021). This process can significantly enhance the material’s fatigue resistance and stress corrosion resistance (Gu et al., 2023; Nasab et al., 2023). The effect of laser shock peening is closely related to the residual compressive stress at the welding joint. Wen et al. (2023) studied the effect of laser shock peening on the very high cycle fatigue life of welded joints. The results showed that LSP achieved grain refinement effect, introduced residual compressive stress on the sample surface, and thus improved the fatigue performance of the material. Wang et al. (2023) used laser shock peening technology on HC420LA low-alloy high-strength steel weldments, and the results showed that laser shock peening can effectively refine the microstructure of the welded joint, improve the microhardness of the impact area, and convert the residual tensile stress of welding into residual compressive stress. Li et al. (2022) examined the effect of LSP treatment on residual stress, surface microstructure, and surface morphology of the rail base of U75VG flash-butt welding joints. The results indicate that LSP treatment generates a residual compressive stress layer on the surface, and the surface hardness increases, leading to an increase in fatigue life. In order to better understand the improvement effect of laser shock peening on welded joints, finite element analysis can be used to simulate the stress state of welded joints under pre applied tensile stress conditions, and further study the influence of different laser shock peening parameters on the evolution of residual stress. Cai et al. (2024) studied the influence of different laser parameters on the residual stress distribution of 316L stainless steel through numerical simulation and conducted experimental verification. The results indicate that with the increase of laser energy, the residual stresses on the material surface and depth direction first increase and then gradually decrease (Sun et al., 2023) established a single-point laser shock model using the finite element method (FEM) and validated the model through experiments to determine the optimal shock parameters. Chen et al. (2024) combined experimental and simulation methods to investigate the factors affecting the uniformity of laser shock peening and its impact on the bending fatigue life of samples. Currently, Researchers have made remarkable progress in the study of the propagation law of laser shock wave and the dynamic plastic strain law. However, there is limited research on the simulation of residual tensile stresses in welded joints by pre-applying tensile stresses to the model, followed by investigating the evolution of surface residual stresses under various laser shock peening parameters.
This study investigates the impact of laser shock peening at three different power densities (2.79 GW/cm2, 3.98 GW/cm2, and 5.17 GW/cm2) on welded joints of 17-7 PH stainless steel. A numerical model was developed using ABAQUS simulation software to simulate the laser shock process on the welded joints pre-applied with tensile stresses. By analyzing the equivalent stress contour maps of the laser loading model, this study explores the constitutive relationship between shock wave power density and the distribution of surface residual stresses. The distribution of residual stress on the surface of the peened welded joints was measured using X-ray diffraction stress analyzers to validate the reliability of the simulation results. This provides technical support and a theoretical foundation for subsequent research on material microstructure evolution and stress corrosion performance.
2 Experiment preparation
2.1 Sample preparation
The 17-7 PH stainless steel used in this study has its chemical composition and some mechanical properties listed in Table 1. The 17-7 PH stainless steel was cut into samples measuring 4 mm × 20 mm × 45 mm using wire cutting. A double-sided argon arc welding method was employed, with the experimental equipment being a WSE-500 AC/DC pulsed argon arc welding machine manufactured by Nantong Fuli Electromechanical Equipment Co., Ltd. The TIG welding parameters are shown in Table 2.

Table 1. Chemical composition (mass fraction/%) and mechanical properties of 17-7 PH stainless steel.
After welding, both the front and back surfaces of the samples were milled by 0.5mm, resulting in samples measuring 3 mm × 20 mm × 93 mm, with a center weld width of 5.5–6.5 mm. As shown in Figure 1. Polish both sides of the welded sample with 240–1,200 grit sandpaper, clean with anhydrous ethanol, and blow dry.
2.2 Experimental instrument
(1) Laser shock device
Xi ’an Tianruida YS100-R200A solid-state laser was used in the experiment. Select deionized water as the constraint layer and 0.1 mm thick black tape as the absorption layer. The conditions for laser shock on the surface of the sample are: spot diameter of 2 mm, wavelength of 1,064 nm, and pulse width of 20 ns. Using energies of 7 J, 10 J, and 13, the corresponding laser power densities are 2.79 GW/cm2, 3.98 GW/cm2, and 5.17 GW/cm2, respectively. The overlap rate is 50% and the impact frequency is 3 times.
(2) Residual stress detection equipment
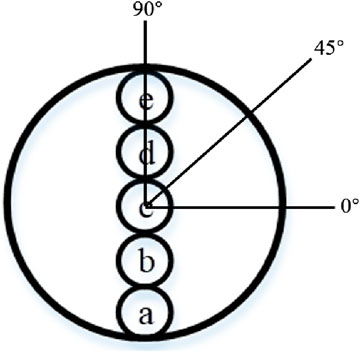
The X-ray stress diffractometer (Proto, Canada, LXRD type) was utilized to measure the residual stress distribution on the inner surface of the spot. The test parameters were as follows: colorimetric tube diameter of 1 mm, Cr target material, Bragg Angle of 156°, crystal face type (211), tube voltage of 30 kV, tube current of 25 mA, and exposure time of 15 s. Five measuring points are positioned along the same diameter of the laser shock spot, as illustrated in Figure 2. Each measuring point is assessed once in three directions: 0°, 45° and 90°.
3 Numerical modeling
3.1 Geometric modeling
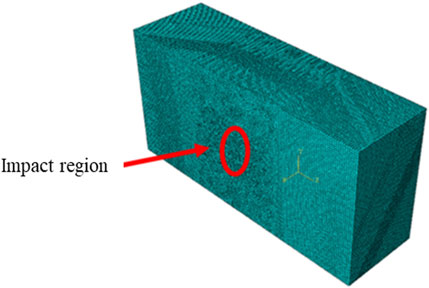
In order to improve the calculation accuracy and efficiency, a 3D finite element model of 10 mm × 5 mm × 3 mm was established in ABAQUS software. In the depth direction, the mesh size is set to 0.05 mm, the surface mesh size of the impact area is set to 0.05mm, the other mesh sizes are unified to 0.08 mm, and the mesh cell type is C3D8R, as shown in Figure 3. Two sides of the model were set as symmetric constraints, the bottom was set as full constraints, and the radial path was set on the surface of the impact region, and the shock wave transmission data was extracted every 10 ns.
3.2 Construction of material constitutive model
Using Johnson-Cook model, the expression of Von-mises yield stress
In this context, parameters A represent the initial yield strength, parameters B represent the strain hardening index, parameters C represent the strain hardening factor; parameters
In the Johnson-Cook model, it is assumed that the effects of strain, strain rate, and temperature on flow stress are relatively independent, and the thermal effects during the laser shock loading process of the specimen can be neglected. Based on these assumptions, the Johnson-Cook model can be simplified as follows (Johnson and Cook, 1985):
In Equation 2, the parameters involved in the J-C model are listed in Table 3. These parameters were obtained through Split Hopkinson Pressure Bar and dynamic shear experiments, where ρ represents density and E represents Young’s modulus.
To study the distribution characteristics of residual stress in the laser shock peening region, three mutually perpendicular forces in the principal stress space at that point are used to represent the stress in any direction. Based on the bi-axial stress analytical method and the stress-strain model of the unit body, the calculation formula for the principal stress vector can be derived (Cao et al., 2022).
Where α is the principal stress direction Angle,
3.3 Shock wave pressure model
When the shock wave pressure is greater than the Hugoniot elastic limit σHEL, the material surface will respond dynamically. The relationship model between laser energy and shock wave pressure is shown in Equation 6 (Fabbro et al., 1990), where the internal energy conversion coefficient α is set to 0.2 (Li et al., 2023). Z represents the equivalent acoustic impedance of the substrate and the confinement layer, taken as
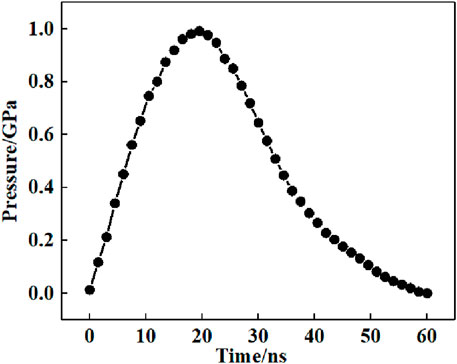
Considering the interaction mechanism of laser shock and materials, the analysis steps are divided into dynamic shock analysis and static rebound analysis. The time setting for the dynamic analysis step is 4,000 ns, which is much larger than the shock wave loading time. The action time of the laser-induced shock wave is approximately 2–3 times the pulse width, with the laser pulse width being 20 ns. The simulated shock wave action time is set to 60 ns. The impact pressure adopts the Fabbro model, with the side and bottom of the model set as reflection boundary conditions. Stress waves can freely reflect and transmit on the side of the model, and the reflected stress waves will be re injected into the model and affect the calculation results. The pressure curve for the laser shock peening wave loading is shown in Figure 4 (Qiao et al., 2019).
4 Experimental results and discussion
4.1 Model simulation results
In order to reduce the calculation time and ensure the accuracy of the calculation results, and due to the symmetry of the geometric features of micro-modeling, a quarter-symmetrical geometric model is used in the modeling process. In this paper, first of all, the model surface longitudinal tensile force, through the tensile force makes the specimen surface and welding tensile stress value approximate stress, at this time the specimen surface there is a large amount of stress and strain, the stress field data derived from the re-attached to the new specimen, at this time 17-7 PH stainless steel welded joints on the surface of the surface of the approximate weld stress value of the stress and almost zero strain, can be initially used as a welded equivalent Stress field. That is, the model of the surface residual tensile stress of 248.3 MPa, 17-7 PH stainless steel welded joints surface residual tensile stress actually measured value of 246.3 MPa, the two are approximately equal, the simulation results shown in Figure 5. Additionally, as seen in Figure 5B, the model has undergone deformation in the longitudinal direction, with a deformation value of 5 × 10⁻³ mm.

Figure 5. Application of welding tensile stress. (A) S11 Stress nephogram, (B) U3 Deformation pattern.
The propagation of the longitudinal wave of the laser shock wave within the 17-7 PH stainless steel specimen is illustrated in Figure 6. At t = 10 ns, at the surface of the material, the laser shock wave exerts an instantaneous pressure, forming an initial stress field. The surface of the material is loaded by the laser shock wave, and the longitudinal wave of the shock wave begins to propagate from the surface of the material to the bottom surface of the material, whereas at the bottom surface of the material, the longitudinal wave undergoes transmittance when it arrives. At t = 490 ns, the longitudinal wave reaches the bottom surface of the material and undergoes transmission at this interface. By measuring the time difference and knowing the thickness of the plate, the propagation speed of the longitudinal wave of the laser shock wave in 17-7 PH stainless steel is determined to be 6.25 × 10³ m/s.
When the pulsed laser is loaded on the surface of the specimen, a shock wave perpendicular to the surface and a surface Rayleigh wave characterized by radial expansion and contraction parallel to the surface are generated sequentially. The propagation of the surface wave on the surface of the 17-7 PH stainless steel specimen is shown in Figure 7. This surface stress wave is generated at the edge of the laser spot and propagates radially outward, forming a surface Rayleigh wave. To calculate the propagation speed of the surface Rayleigh wave, two arbitrary time points are selected during the wave’s propagation. At t = 150 ns, the surface Rayleigh wave propagating outward from the laser spot can be observed, and during propagation, the amplitude of the stress wave gradually diminishes; at t = 300 ns, the surface Rayleigh wave is nearly attenuated to zero. Between 120 ns and 270 ns, the wavefront of the surface Rayleigh wave propagates outward by 0.46611 mm, which allows us to infer that the wave speed of the surface Rayleigh wave is 3.11 × 10³ m/s.

Figure 7. Surface Rayleigh wave propagation on the surface of 17-7 PH stainless steel welded joint. (A) 150 ns; (B) 300 ns.
After multiple reflections of the stress wave, a stable residual stress field is formed within the model. Following the rebound analysis, the equivalent stress cloud diagrams for the 17-7 PH stainless steel model under different laser power densities are shown in Figure 8. As seen in Figure 8A, when the laser power density is 2.79 GW/cm2, the peak pressure of the laser shock is approximately 940 MPa, which is 1.55 times the Hugoniot elastic limit of 17-7 PH stainless steel. At this time, there is no residual stress cavity phenomenon observed on the shock surface, and the residual compressive stress at the spot is −35.2 MPa. In Figure 8B, it can be observed that when the laser power density increases to 3.98 GW/cm2, the peak pressure is about 1.9 times the Hugoniot elastic limit of 17-7 PH stainless steel, and no residual stress cavity phenomenon appears at the center of the spot; at this time, the residual compressive stress at the spot is −99.0 MPa. In Figure 8C, when the laser power density increases to 5.17 GW/cm2, the peak pressure of the laser shock is approximately 2 times the Hugoniot elastic limit of 17-7 PH stainless steel. With the increase of laser power density, the dynamic stress response occurs on the surface of the model, and the reverse loading of reflected waves occurs at the edge of the impact spot, causing reverse plastic deformation. The residual stress in the center area of the laser impact spot is missing, and its value is significantly lower than that in the surrounding area, and the residual stress cavity phenomenon occurs inside the model. This shows that the shock wave at high power density can effectively penetrate the material and produce large plastic deformation, which is not conducive to uniform modification of the material (Li et al., 2020). The residual stress at the center of the spot is −135.1 MPa.
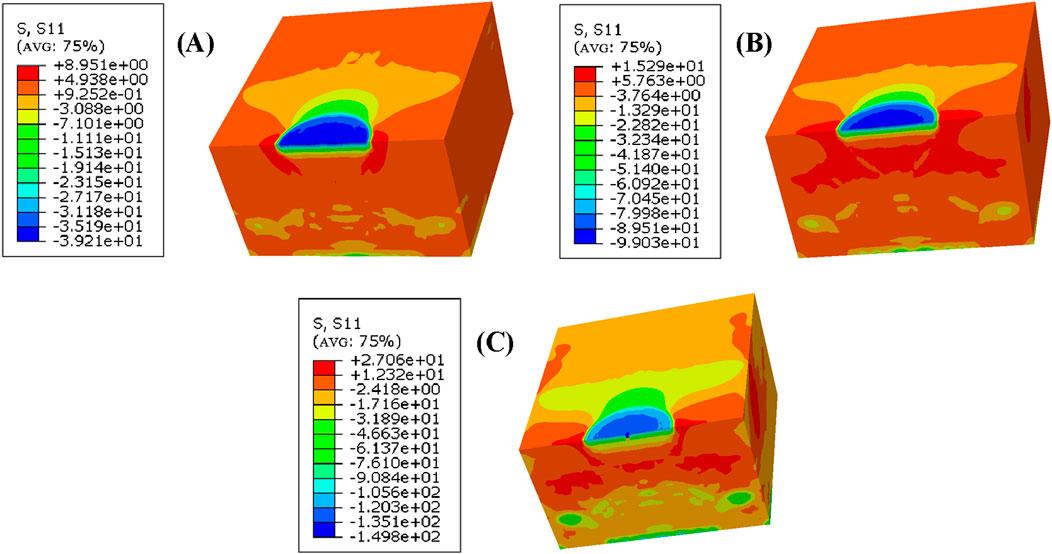
Figure 8. Equivalent stress cloud image of 17-7 PH stainless steel model under laser loading with different power densities (A) 2.79 GW/cm2; (B) 3.98 GW/cm2; (C) 5.17 GW/cm2.
4.2 Experimental test results
Using an X-ray stress diffractometer, the surface residual stresses at five measurement points along the same diameter of the laser shock area were measured in the 0°, 45°, and 90° directions. Based on the test results and combined with Equations 3–5, the values of the residual principal stresses and their direction angles under different laser power densities, namely σmax, σmin and α0 were obtained. The distribution of residual principal stresses and direction angles along the same diameter in the shock area under different laser power densities is shown in Figure 9. When the laser power density is 2.79 GW/cm2, the curve for the maximum surface residual principal stress shows little variation, while the curve for the residual principal stress direction angle varies significantly, indicating that the distribution of the residual principal stress direction angle is quite dispersed, making it difficult to form stress concentrations. When the laser power density increases to 3.98 GW/cm2, the surface residual stress in the laser shock area becomes residual compressive stress, and the residual compressive stress at the spot increases compared to that at 2.79 GW/cm2; the residual principal stress direction angle curve also varies significantly, making it less likely to produce stress concentration phenomena. When the laser power density rises to 5.17 GW/cm2, the residual compressive stress at the center of the spot further increases, and the maximum residual compressive stress does not occur at the center of the spot, leading to the formation of a residual stress cavity.
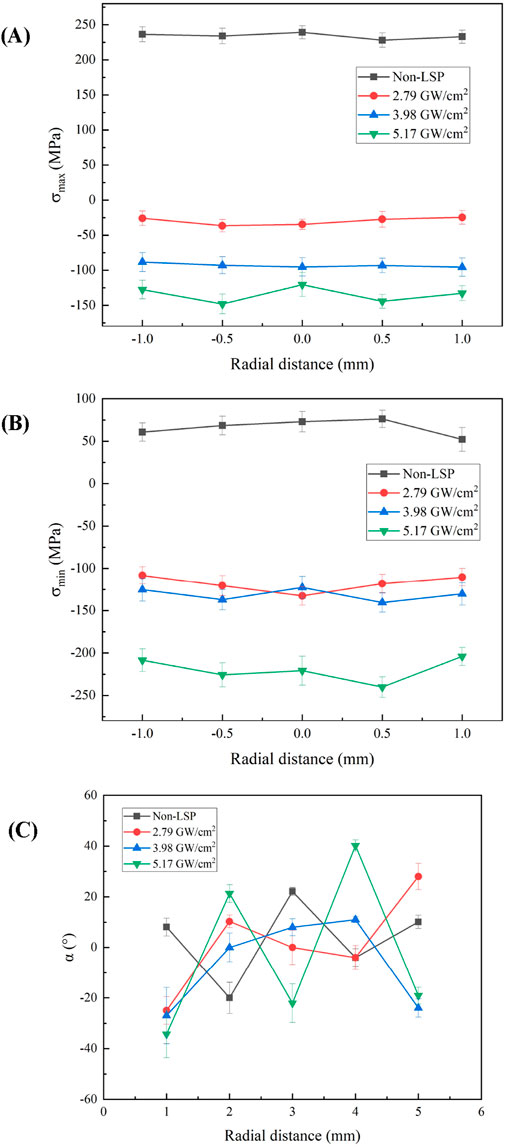
Figure 9. Residual principal stress distribution and direction Angle induced by different laser power densities (A) Maximum residual principal stress distribution; (B) Minimum residual principal stress distribution; (C) Residual principal stress direction angular distribution.
Figure 10 illustrates the comparison between experimental and simulated results of maximum surface residual stress following impacts at varying laser power densities. As shown in Figure 10, without any laser shock treatment, the maximum simulated residual stress is measured at 246.8 MPa. At a laser power density of 2.79 GW/cm2, the maximum simulated residual stress at the center of the spot drops to −37.2 MPa; this further decreases to −94.1 MPa when the power density reaches 3.98 GW/cm2. Upon reaching a power density of 5.17 GW/cm2, a phenomenon known as a residual stress cavity emerges at the center, with simulation yielding a maximum residual stress of −144.8 MPa.
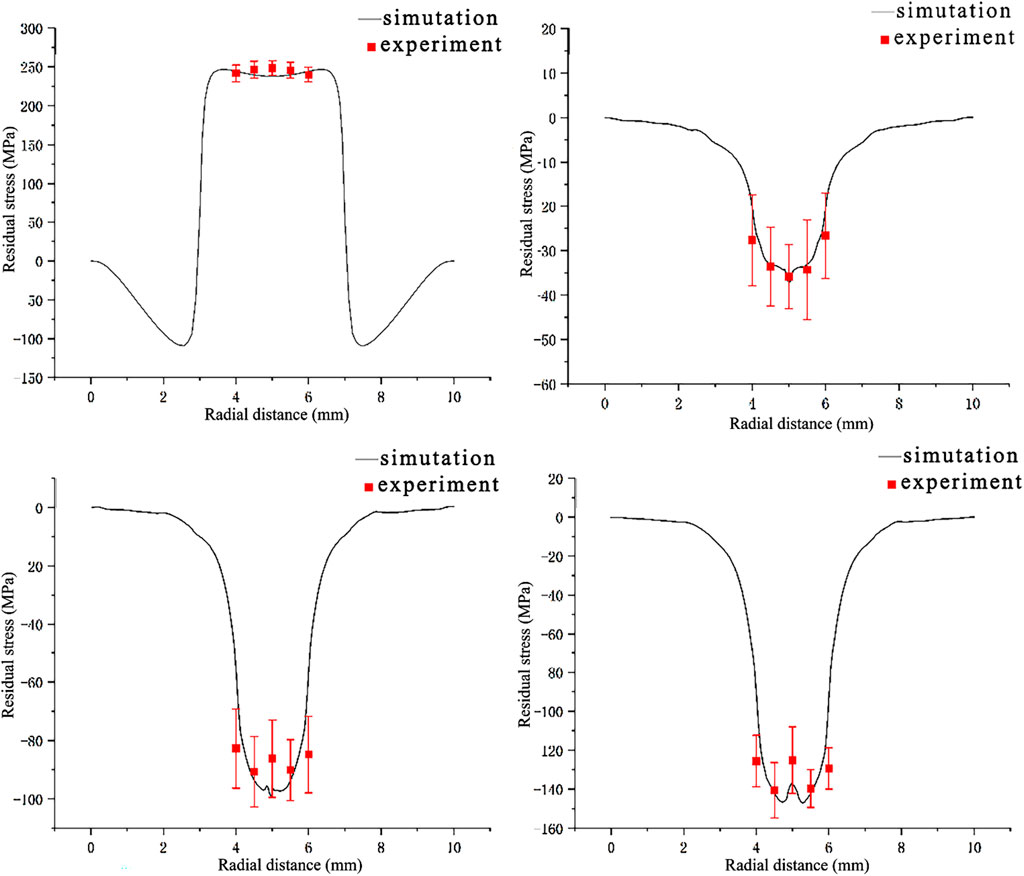
Figure 10. Comparison of experimental and simulation results of maximum residual stress on the surface of laser impact specimens with different power densities (A) Non-LSP; (B) 2.79 GW/cm2; (C) 3.98 GW/cm2; (D) 5.17 GW/cm2.
The experimental findings align closely with those from simulations: without laser shock treatment, experiments yield a maximum residual stress measurement of 238.3 MPa—comparable to its simulated counterpart—with an error rate of only 3.6%. At a power density of 2.79 GW/cm2, experimental measurements indicate a maximum residual stress value of −37.3 MPa, which closely matches simulation results and reflects an error margin around just 0.2%. For a power density set at 3.98 GW/cm2, experimental data show peak values near −99 MPa with an associated model error rate of approximately 4.9%. When the laser power density reached 5.17 GW/cm2, the residual compressive stress value at the spot obtained from the experiment further increased compared to the residual compressive stress value of the spot after 3.98 GW/cm2 laser impact. The maximum residual stress value measured in the experiment was −146.1 MPa, and the residual stress value obtained from the experiment was in good agreement with the simulated value, with a model error of about 0.8%.
The laser shock peening continuously increases the surface residual compressive stress in 17-7 PH stainless steel, and the higher the laser power density, the greater the value of the surface residual compressive stress. In addition, when the power density is relatively high at 3.98 GW/cm2, the residual stress on the surface of 17-7 PH stainless steel has the same direction and similar values, and the distribution uniformity is improved, which is related to the formation of numerous small, uniformly distributed grains in the surface material under strong laser loading (Luo et al., 2013). The increase in surface residual compressive stress in 17-7 PH stainless steel can slow down the initiation and propagation speed of surface cracks, thereby extending its service life.
5 Conclusion
(1) The simulation results show that under the laser shock with a power density of 2.79 GW/cm2, the residual tensile stress on the surface of the specimen changes to residual compressive stress, with the residual stress value decreasing from 248.3 MPa to −37.2 MPa. Under the laser shock at a power density of 3.98 GW/cm2, the distribution of residual compressive stress on the surface of the specimen becomes more uniform, and the residual compressive stress further increases to −99.0 MPa. Under the laser shock with a power density of 5.17 GW/cm2, the residual compressive stress increases to −144.8 MPa, at which point the residual stress in the center area is lower than that in the surrounding area, forming a residual stress cavity.
(2) The experimental results show that under the laser shock with a power density of 2.79 GW/cm2, the measured residual compressive stress values exhibit a Gaussian distribution, with a maximum value of −37.3 MPa. Under the laser shock at a power density of 3.98 GW/cm2, the uniformity of the residual compressive stress improves, with a maximum measured value of −99.0 MPa. When the laser power density increases to 5.17 GW/cm2, the maximum residual compressive stress measured experimentally after laser shock is −146.1 MPa, and the maximum residual compressive stress does not occur at the center of the spot, forming a residual stress cavity.
(3) The accuracy of the simulation model is validated through experiments, and comparative analysis shows that the simulation results are very close to the experimental values, with a maximum error of 4.9%, indicating that the simulation results are accurate and reliable. However, the mechanism of the effect of laser shock on the refinement of material microstructures remains unclear, and further in-depth research will be conducted in the future to investigate the impact of laser shock on the microstructural properties of materials.
Data availability statement
The original contributions presented in the study are included in the article/supplementary material, further inquiries can be directed to the corresponding author.
Author contributions
WY: Conceptualization, Formal Analysis, Funding acquisition, Project administration, Resources, Software, Writing–original draft, Writing–review and editing. YL: Methodology, Writing–original draft, Writing–review and editing. GG: Investigation, Supervision, Visualization, Writing–original draft. KL: Data curation, Validation, Writing–original draft.
Funding
The author(s) declare that financial support was received for the research, authorship, and/or publication of this article. Innovation Fund of National Commercial Aircraft Manufacturing Engineering Technology Research Center (COMAC-SFGS-2022-1972), National Key Research and Development Project of China (No.2019YFB2005300), Nantong Municipal People’s Livelihood Project (MS22022040).
Conflict of interest
Authors WY and YL were employed by Comac Shanghai Aircraft Manufacturing Co., Ltd.
The remaining authors declare that the research was conducted in the absence of any commercial or financial relationships that could be construed as a potential conflict of interest.
Publisher’s note
All claims expressed in this article are solely those of the authors and do not necessarily represent those of their affiliated organizations, or those of the publisher, the editors and the reviewers. Any product that may be evaluated in this article, or claim that may be made by its manufacturer, is not guaranteed or endorsed by the publisher.
References
Aghdami, A. M., and Davoodi, B. (2020). An inverse analysis to identify the Johnson-Cook constitutive model parameters for cold wire drawing process. Mech. Ind. 21, 527. doi:10.1051/meca/2020070
Berthe, L., Bezaeva, N. S., Gattaceca, J., Boustie, M., de Resseguier, T., and Rochette, P. (2011). Behavior of basalt under laser-induced shock-wave application to the planetary hypervelocity impact effect. J. Laser Appl. 23, 012006. doi:10.2351/1.3556591
Cai, Y., Cao, C., Xu, Q., Ge, J., Chen, M., Ding, Z., et al. (2024). Experimental and numerical investigation on residual stress of 316L SS treated by different laser shock peening parameters. Opt. Lasers Eng. 183, 108531. doi:10.1016/j.optlaseng.2024.108531
Cao, Y., Wang, Z., Shi, W., Hua, G., and Qiu, M. (2022). Formation mechanism and weights analysis of residual stress holes in E690 high-strength steel by laser shock peening. Coatings 12, 285. doi:10.3390/coatings12020285
Chen, X., Li, K., Lin, Y., Xu, Z., Guo, B., Chen, J., et al. (2024). Effect of laser shock peening uniformity on bending fatigue life of 20CrNiMo. Opt. Laser Technol. 175, 110704. doi:10.1016/j.optlastec.2024.110704
Fabbro, R., Fournier, J., Ballard, P., Devaux, D., and Virmont, J. (1990). Physical study of laser-produced plasma in confined geometry. J. Appl. Phys. 68, 775–784. doi:10.1063/1.346783
Gu, C., Su, M., Tian, Z., Zhao, J., and Wang, Y. (2023). Multi-scale simulation study on the evolution of stress waves and dislocations in Ti alloy during laser shock peening processing. Opt. Laser Technol. 165, 109629. doi:10.1016/j.optlastec.2023.109629
Johnson, G. R., and Cook, W. H. (1985). Fracture characteristics of three metals subjected to various strains, strain rates, temperatures and pressures. Eng. Fract. Mech. 21, 31–48. doi:10.1016/0013-7944(85)90052-9
Li, K., Cai, Y., Yu, Z., and Hu, J. (2020). Formation mechanism of residual stress hole under different pulse durations and shock pressure distributions in Ti6Al4V alloy during laser peen texturing. Opt. Laser Technol. 130, 106361. doi:10.1016/j.optlastec.2020.106361
Li, L., Guo, S., Guo, Y., Ren, J., Hou, W., Wang, X., et al. (2023). Effect of laser shock processing on residual stress evolution in martensitic stainless steel multi-pass butt-welded joints. Mater. Res. Express 10, 034003. doi:10.1088/2053-1591/acc63c
Li, X., Ma, R., Liu, X., Lv, Q., Wang, X., and Tian, Z. (2022). Effect of laser shock peening on fatigue properties of U75VG rail flash-butt welding joints. Opt. Laser Technol. 149, 107889. doi:10.1016/j.optlastec.2022.107889
Lu, G., Li, J., Zhang, Y., and Sokol, D. W. (2019). Effect of initial surface roughness on the actual intensity of laser shock processing. Surf. Topogr.-Metrol. Prop. 7, 015025. doi:10.1088/2051-672X/ab0d9d
Luo, X., Chen, K., Zhang, J., Lu, J., Ren, X., Luo, K., et al. (2013). Dislocation mechanism of surface modification for commercial purity aluminum and aluminum alloy by laser shock processing. Acta Metall. Sin. 49, 667–674. doi:10.3724/SP.J.1037.2013.00035
Nasab, M. H., Vedani, M., Loge, R. E., Sohrabi, N., Jamili, A. M., du Plessis, A., et al. (2023). An investigation on the fatigue behavior of additively manufactured laser shock peened AlSi7Mg alloy surfaces. Mater. Charact. 200, 112907. doi:10.1016/j.matchar.2023.112907
Qiao, H., Sun, B., Zhao, J., Lu, Y., and Cao, Z. (2019). Numerical modeling of residual stress field for linear polarized laser oblique shock peening. Optik 186, 52–62. doi:10.1016/j.ijleo.2019.04.083
Samaniego-Gamez, O., Almeraya-Calderon, F., Chacon-Nava, J., Maldonado-Bandala, E., Nieves-Mendoza, D., Pablo Flores-De los Rios, J., et al. (2022). Corrosion behavior of passivated CUSTOM450 and AM350 stainless steels for aeronautical applications. Metals 12, 666. doi:10.3390/met12040666
Schwab, K.-C., Keller, S., Kashaev, N., and Klusemann, B. (2021). Tailoring of residual stresses by specific use of defined prestress during laser shock peening. J. Mater. Process. Technol. 295, 117154. doi:10.1016/j.jmatprotec.2021.117154
Sun, J., Li, J., Chen, X., Xu, Z., Lin, Y., Jiang, Q., et al. (2023). Optimizing parameters with FEM model for 20CrMnTi laser shocking. Materials 16, 328. doi:10.3390/ma16010328
Wang, Y., Feng, A., Pan, X., Chen, C., Wei, Y., and Wang, J. (2023). Study on the microstructure and properties of welded joints of laser shock peening on HC420LA low-alloy high-tensile steel. Materials 16, 4238. doi:10.3390/ma16124238
Wen, F., Long, Z., Xing, Z., Liu, X., Huang, X., and Zhou, L. (2023). The effect of laser shock peening on very high cycle fatigue properties of laser welded 2A60 aluminum alloy joints. Eng. Fract. Mech. 290, 109537. doi:10.1016/j.engfracmech.2023.109537
Xu, X. L., and Yu, Z. W. (2008). Metallurgical analysis on a bending failed pump-shaft made of 17-7PH precipitation-hardening stainless steel. J. Mater. Process. Technol. 198, 254–259. doi:10.1016/j.jmatprotec.2007.06.085
Yip, T. H., and Wang, Z. R. (2003). “Cyclic plasticity of precipitation-hardenable stainless steel,” in Engineering plasticity from macroscale to nanoscale pts 1 and 2, Key engineering materials. Presented at the 6th asia-pacific symposium on engineering plasticity and its applications (AEPA2002). Editors L. C. Zhang, and G. Lu (Zurich-Uetikon: Trans Tech Publications Ltd), 275–280. doi:10.4028/www.scientific.net/KEM.233-236.275
Keywords: laser shock peening, residual stress, simulation, power density, error
Citation: Yu W, Li Y, Guo G and Li K (2024) Simulation and analysis of residual stress in 17-7 PH stainless steel welded joints using laser shock peening technology. Front. Mater. 11:1484792. doi: 10.3389/fmats.2024.1484792
Received: 22 August 2024; Accepted: 14 November 2024;
Published: 27 November 2024.
Edited by:
Erkan Oterkus, University of Strathclyde, United KingdomReviewed by:
Enrico Troiani, University of Bologna, ItalyAamir Hassan, National Institute of Technology, Srinagar, India
Copyright © 2024 Yu, Li, Guo and Li. This is an open-access article distributed under the terms of the Creative Commons Attribution License (CC BY). The use, distribution or reproduction in other forums is permitted, provided the original author(s) and the copyright owner(s) are credited and that the original publication in this journal is cited, in accordance with accepted academic practice. No use, distribution or reproduction is permitted which does not comply with these terms.
*Correspondence: Guicang Guo, MTg5OTM0NDQxMzBAMTYzLmNvbQ==
 Weichen Yu
 Yaping Li1
 Guicang Guo

