 Ruizhuo Wan1†
 Liang Huang
- 1School of Civil Engineering, Zhengzhou University, Zhengzhou, China
- 2School of Finance, Lanzhou University of Finance and Economics, Lanzhou, China
In the solidification of plasters, promptly identifying layering defects is vital to reduce later inspection and maintenance expenses. Traditional tapping methods for defect detection, while widespread, are inefficient and can damage walls. This study proposes an innovative method utilizing Infrared Thermal Imaging (IRT) for semi real-time detection of layering defects during the solidification phase. The method was applied within the first 48 h following the application of two different plasters (Cement and Gypsum, mixed on-site as needed, not pre-dosed, and applied in a single layer), systematically examining the effects of plaster composition and environmental temperature conditions. The results showed that all preset defects were successfully identified. It was observed that larger defects are more readily detectable at a given thickness, and conversely, thicker defects are more discernible at a fixed size, with the dimension of the defect having a more pronounced impact on absolute contrast than its thickness. Notably, cement plaster exhibited two distinct temporal windows for defect detection, primarily influenced by environmental temperatures. In contrast, gypsum mortar presented two detection phases, with the initial phase being predominantly governed by the heat of hydration and the latter by ambient temperature conditions. The application of IRT technology in this research demonstrates its efficacy in accurately detecting layering defects during the solidification of plasters. This method offers valuable insights and guidance for the application of plaster layers in real-world engineering scenarios, potentially reducing maintenance costs and improving construction quality.
1 Introduction
Layered defects are a common problem in building structures, primarily manifesting as poor adhesion, incomplete integration, or misalignment between the building surface and the internal structure (Lourenço et al., 2016; Lublasser et al., 2017; Bingol et al., 2019). Such defects can lead to further deterioration of the building’s surface coating, such as crack formation and component detachment, posing a potential threat to the normal use and structural stability of the building. Layered defects are particularly common on building facades, usually occurring at the interface between the finishing layer (such as tiles or decorative paint) and the underlying substrate (such as concrete or brick) (Chew, 1992; Chew and De Silva, 2004; Chew et al., 2004; Chew et al., 2005). Since these defects are located below the surface, non-destructive testing (NDT) techniques are required for their detection (Zhao, 2021; Gupta et al., 2022; Shaloo et al., 2022; Silva et al., 2023). Although various NDT techniques, including tapping tests, hammer sound tests, and ground-penetrating radar, have been widely used in the study of facade layering (Deterioration, 2009; Edis et al., 2015; Watase et al., 2015), these methods often require direct contact with the structure, are time-consuming, inefficient in detection, and difficult to combine with automated equipment (such as drones) to alleviate the issues associated with manual testing.
Infrared thermal imaging technology (IRT) as a non-destructive testing method, due to its advantages of non-contact measurement, large area detection, fast scanning speed, high accuracy, and intuitive results, has been used to detect internal layered defects in concrete structures (Tomita and Chew, 2022). This technology relies on the temperature gradient differences between intact surface areas and delaminated areas due to their different thermal properties (Madding, 1983; Cheng et al., 2019). The thermal imaging camera measures the infrared radiation emitted by objects, converts it into temperature values, and further transforms it into visualized thermal images, making defect detection intuitive (Madding, 1983; Raja et al., 2022). Layered defects in wall plaster affect surface thermal transfer, producing detectable thermal contrasts in thermal images, helping to identify damaged areas at risk of potential detachment in advance, thus determining the priority and plan for detailed inspection, or repairs in more severe cases (Washer, 2012). Depending on whether additional thermal energy is provided, IRT technology is divided into active thermal imaging and passive thermal imaging (Dabous and Feroz, 2020). Active thermal imaging uses artificial heat sources (such as halogen lamps, flashlights, or lasers) to heat the object during the heating or cooling phase, while passive thermal imaging utilizes natural heat sources for heat exchange (Zhang et al., 2021; Raja et al., 2022). Although active thermal imaging can reveal smaller subsurface defects, the need for additional heating equipment leads to increased costs and reduced work efficiency, making passive thermal imaging a more economical choice (Washer et al., 2010; Raja et al., 2020). Passive IRT technology has been widely applied in concrete structure detection, such as studies demonstrating IRT detection of surface and internal temperature differences during the cement hydration process, identification of underground voids through hydration heat, and detection of grouting defects in external rear pipes, all reflecting the effectiveness of combining IRT with thermal sensors (Tran et al., 2018a; Mac et al., 2019; Cheng and Shen, 2021; Li et al., 2023; Živanović et al., 2023). Moreover, research has emphasized the importance of the width-depth ratio (WTDRs) in effectively detecting deeper delamination and explored determining the optimal timing window for IRT detection, highlighting the significant impact of defect depth on detection timing (Watase et al., 2015; Huh et al., 2023).
Despite the widespread use of passive infrared thermography (IRT) for detecting defects in concrete, there remains insufficient focus on real-time detection of layered defects in concrete during the curing process, particularly in indoor settings. Since concrete used indoors cannot directly harness solar radiation for excitation, undetected layered defects during construction can later damage decorative layers, resulting in increased inspection and repair costs after renovation. Therefore, it is particularly important to develop passive infrared thermography (IRT) detection technology specifically tailored for gypsum and similar plasters to detect indoor plaster layering defects. The new method introduced in this article utilizes defect size, thickness, and material type to facilitate semi-real-time indoor IRT detection during the early stages of plaster curing. It incorporates absolute contrast analysis to evaluate its effectiveness, examines the influence of material type and ambient temperature on detection outcomes, and defines the detection time window and optimal timing for applying IRT detection. This approach aims to enhance the methodology for detecting defects in plasters and to explore broader applications of IRT technology in building material assessment.
2 Materials and methods
2.1 Test specimens
To comprehensively assess the effectiveness of infrared thermal imaging technology in detecting delamination defects in indoor wall plaster layers, this study designed specimens with varying defect sizes, thicknesses, and plasters. These specimens were divided into two main categories: one using cement mortar and the other using gypsum mortar as the plastering material. To ensure that the number and area of defects met the research requirements, each specimen had dimensions set at a length of 1,240 mm, a width of 1,220 mm, and a thickness of 220 mm, and they were constructed using aerated concrete blocks. To closely simulate real-world application scenarios, the delamination defects were intentionally placed between the plastering layer and the wall. Detasils regarding the size, thickness, and quantity of these defects are provided in Figure 1. Polyurethane foam, with a thermal conductivity coefficient close to that of air (0.022 W/m·°C), was chosen as the simulated material for the defects.

Figure 1. Schematic diagram of specimen parameters and defect parameters.
2.2 Preparation work before plastering
To simulate wall construction in actual engineering as closely as possible, the specimens were constructed using staggered masonry, following the relevant construction standards outlined in “Technical Specification for Acceptance of Construction Quality of Masonry Structures” GB 50203–2011. Initially, a utility knife was used to cut the polyurethane foam boards to the designed dimensions. Subsequently, they were sanded with sandpaper to achieve the precise dimensions of polyurethane foam required to simulate the form of plaster delamination defects. According to the specimen’s design requirements, the polyurethane foam was fixed to the front of the masonry specimen before plastering, as shown in Figure 2. These steps were taken to ensure that the construction of the specimen closely resembled wall construction in actual engineering.
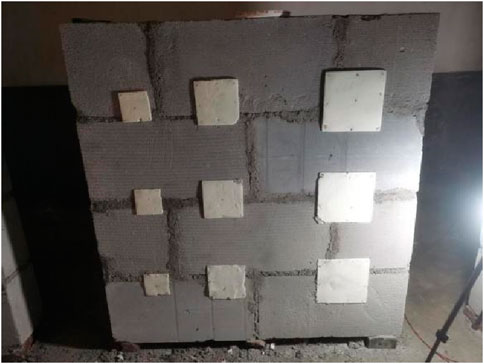
Figure 2. Distribution diagram of polyurethane foam on the front of the masonry specimen.
2.3 Plastering of the specimen
The plasters used in this study include cement mortar and gypsum mortar, both of which are widely used in actual engineering. The proportion of cement mortar consists of cement, sand, and water in a ratio of 1:3:0.6, with ordinary Portland cement used as the cement type. On the other hand, the gypsum mortar proportion consists of gypsum, sand, and water in a ratio of 1:2.5:0.5. When plastering the specimens, the front side of each specimen was designed to have plastered surfaces with delamination defects, while the reverse side had standard plastered surfaces, as shown in Figure 3. Figure 3A displays the cement mortar plastered surface, while Figure 3B shows the gypsum mortar plastered surface. To ensure a plaster layer thickness of 10mm, 10 mm steel nails were inserted into the masonry structure before plastering, and the plaster thickness was determined with reference to these steel nails during the plastering process. The selection of a 10 mm thickness for plaster layers in the work is justified by its ability to adequately cover wall imperfections, enhance structural durability, and improve insulation and soundproofing. This thickness is ideal for providing protection and increasing comfort. The quality of plastering complies with the requirements of “Code for Acceptance of Construction Quality of Building Decoration Engineering” GB50210-2018.2. In the preparation of gypsum mortar, use ordinary fine sand and construction-grade gypsum powder, mixing them in a ratio of gypsum to sand to water of 1:2.5:0.5. This should be done quickly and evenly with an electric mixer to prevent premature hardening and lumps. The mixture must be applied immediately and evenly. The process for cement mortar is similar, involving a mix of cement and sand added to water and blended for immediate application on a prepared surface.
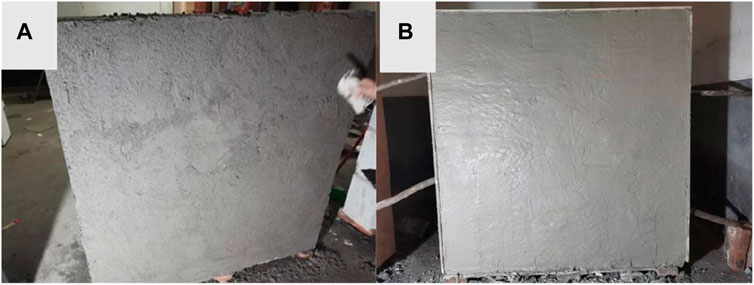
Figure 3. (A) The cement mortar plastered surface; (B) the gypsum mortar plastered surface.
2.4 Experiment procedure
To simulate a typical indoor environment of a building, this experiment was conducted inside a civilian building located in Yinying Village, Zhenping County, Nanyang City, Henan Province, China. The specific arrangement of the experiment is shown in Figure 4A. Data collection was performed using the TI395 infrared thermal imager (Figure 4B), whose performance specifications are presented in Table 1. Considering the impact of the indoor environment on imaging, the infrared thermal imager was placed at a distance of 4.5 m directly in front of the specimen (Figure 4A). This placement ensures the integrity of the specimen’s imaging in both the vertical and horizontal directions.
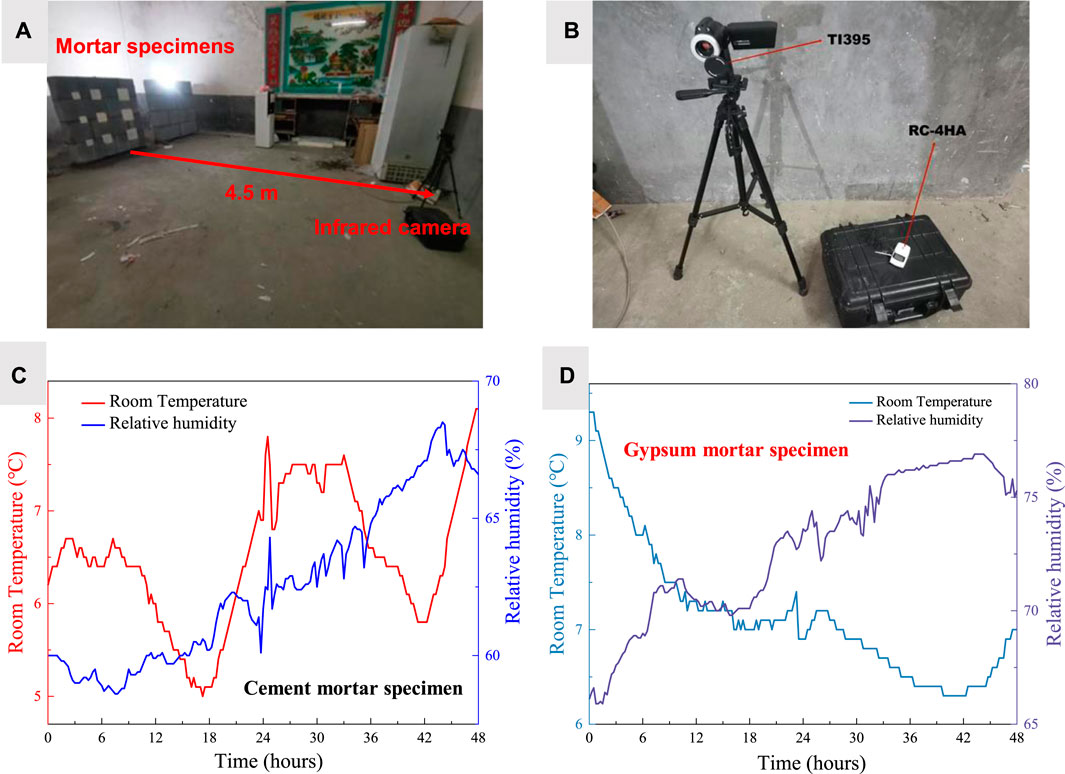
Figure 4. (A) Infrared thermal imaging camera and its layout diagram; (B) Picture of infrared camera and Temperature and Humidity Meter; (C) Corresponding environmental monitoring data for cement mortar specimens; (D) Corresponding environmental monitoring data for gypsum mortar specimens.
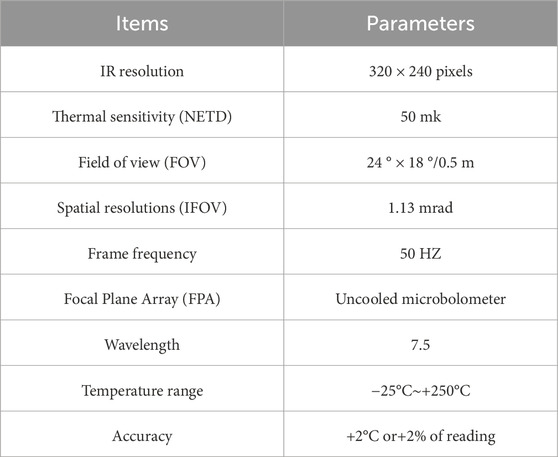
Table 1. Detailed parameters of the thermal imaging camera.
This study consisted of two rounds of experiments, each lasting for 48 h and commencing upon completion of plastering work on the specimens to collect data. The infrared thermal imager used was configured to automatically capture thermal images every 45 s, resulting in a cumulative total of 3,840 thermal images for each round of the experiment. Simultaneously, the temperature and humidity data logger RC-4HA was set to record environmental temperature and humidity data every 15 min, starting after the plastering was completed and continuing for 48 h. The equipment setup used in the experiment and the trends in environmental temperature and humidity can be observed in Figures 4C, D.
To calculate the surface temperature of the specimens using radiometry, initial parameters needed to be set in the infrared camera before data collection. These parameters included ambient temperature, ambient humidity, emissivity of the plaster surface, and the distance from the camera to the test object. Based on these parameters, the camera automatically calculated the atmospheric transmittance. According to ASTM standards (Tran et al., 2017), it is not recommended to conduct such tests when wind speeds exceed 24 km/h (American Society for Testing and Materials, 2007). Given that the indoor wind speed was close to zero, the conditions for this experiment were suitable. Furthermore, as this experiment was not influenced by direct solar radiation, heat transfer primarily occurred through convection with the surrounding air, making environmental temperature a critical factor. To focus on analyzing delamination defects in the plaster layer, wooden boards were placed in the experiment to minimize the interference of edge effects.
3 Results and discussion
3.1 Analysis of detectability
Despite the inherent challenges in selecting reference and defect areas, the absolute contrast method, also known as thermal or absolute thermal contrast, continues to be the predominant approach for the analysis of thermal image sequences (Kretzmann et al., 2016; Tran et al., 2018b). This method is particularly valued for its straightforward and effective means of quantitatively evaluating the defect detection capabilities of infrared thermography (IRT) technology, as well as for analyzing the optimal time window for defect detection. Despite the ASTM D4788-03 standard stating that defects are detectable only when the absolute contrast between the defect and healthy areas exceeds 0.5°C, practical evidence indicates that lower temperature differences are also sufficient for defect identification (Huh et al., 2016; Kretzmann et al., 2016; Hiasa et al., 2017; Rocha and Póvoas, 2017; Mac et al., 2019). Hence, considering practical outcomes and the need for higher precision in certain applications, the work has chosen ±0.2°C as our threshold for detecting defects.
Figure 5 delineates the patterns of absolute contrast variations within layered defect regions across various specimens. Specifically, Figure 5A illustrates the behavior in cement mortar specimens, while Figure 5B focuses on gypsum mortar specimens (Defects are represented by capital letters in Figure 5B). In the case of cement mortar, Figure 5C demonstrates that layered defects were successfully identified using IRT, a success attributed to the absolute contrast in these defect areas exceeding the 0.2°C threshold within a predetermined timeframe. It is important to note that the absolute contrast within the cement mortar’s stratified defect regions displayed a complex pattern characterized by an initial decrease, followed by an increase, and then a series of decreases and increases, culminating in a final decrease. Additionally, variations were observed in the absolute contrast across different defect areas. Conversely, Figure 5D presents the detection of various stratified defect regions within gypsum mortar specimens, showcasing an absolute contrast trend that diverges from that observed in cement mortar specimens. This trend is characterized by an initial decrease followed by an increase, with notable differences in the absolute contrast among different defect areas being observed as well.
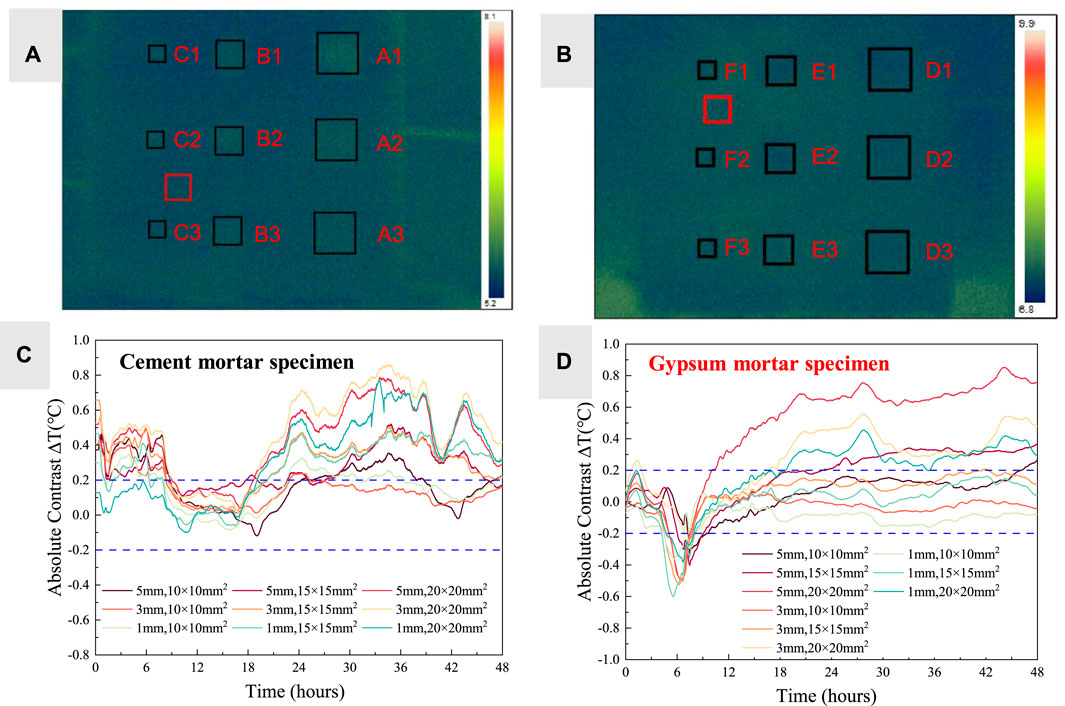
Figure 5. (A) Thermal imaging of cement mortar specimen; (B) Thermal imaging of gypsum mortar; (C) Trend chart of absolute contrast change for delamination defects in cement mortar specimens; (D) trend chart of absolute contrast change for delamination defects in gypsum mortar specimens.
To delve deeper into the relationship between the absolute contrast of layered defect areas and the size and thickness of defects, and thereby analyze the threshold conditions for detecting plaster layer defects using infrared thermography, it was observed that the absolute contrast in the defect areas of both cement and gypsum mortar specimens showed irregular patterns within the initial 17 and 14 h, respectively. Hence, the latter, more regular half of the experiment was chosen for analysis, selecting the time frames of 34 h for cement mortar specimens and 26 h for gypsum mortar specimens, to curve-fit the relationship between absolute contrast and defect size and thickness, as shown in Figure 6. Figures 6A, B reveal that for cement mortar specimens, the relationship between absolute contrast and thickness for defects of sizes 20 cm, 15 cm, and 10 cm, as well as the relationship between absolute contrast and the square of the size for defects of thicknesses 5 mm, 3 mm, and 1mm, approximate a linear relationship, as indicated by the R-Square fitting evaluation indices. For gypsum mortar materials, Figures 6C, D demonstrate that the absolute contrast for defects of thicknesses 5, 3, and 1 mm, and the size to the fourth power, as well as the absolute contrast for defects of sizes 20, 15, and 10 cm and the square of their thickness, also exhibit a linear relationship, with R-Square values very close to 1. These analyses indicate that, under the conditions of this experiment, for cement mortar materials, the increase in absolute contrast gradually grows with the increase in defect size under the same thickness conditions; similarly, under the same size conditions, the absolute contrast uniformly increases with the increase in defect thickness. The same patterns apply to gypsum mortar materials: with the increase in size under the same thickness conditions, the increase in absolute contrast gradually grows; likewise, under the same size conditions, the increase in defect thickness leads to a gradual increase in absolute contrast. These findings provide a significant quantitative basis for detecting plaster layer defects using infrared thermography technology.
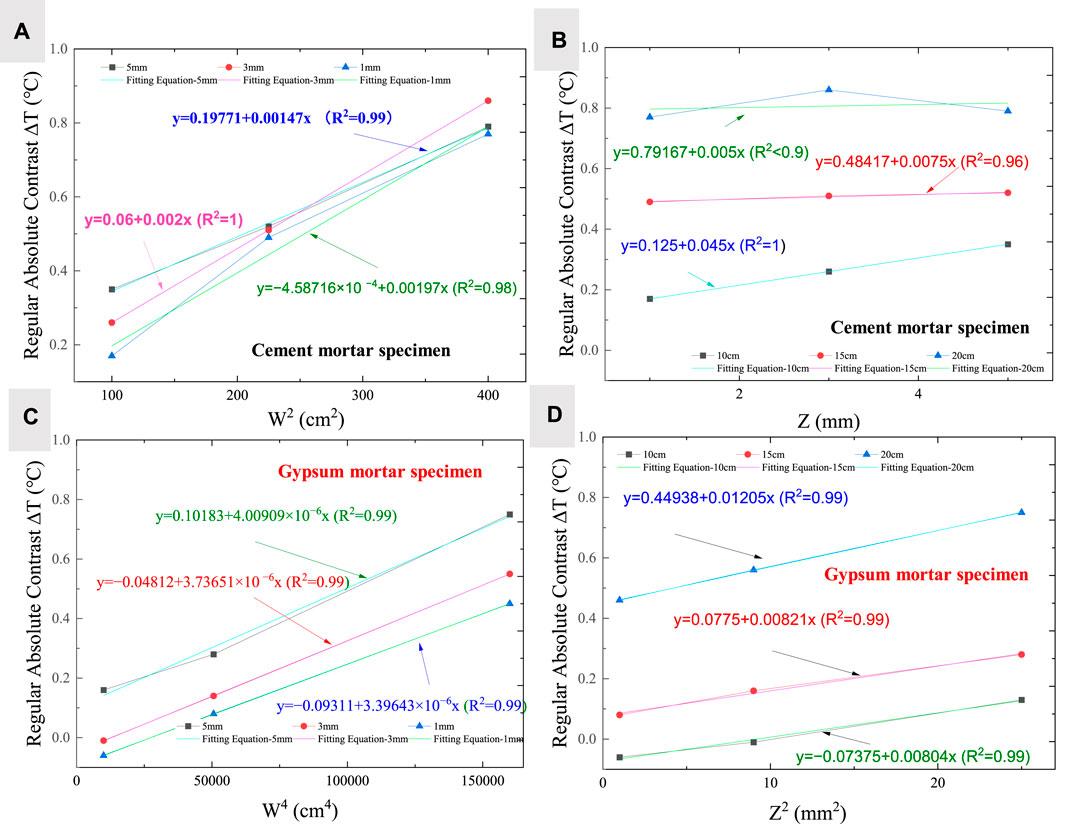
Figure 6. Curve fitting of the absolute contrast versus (A) size squared for cement mortar; (B) thickness for cement mortar; (C) size to the fourth power for gypsum mortar; (D) thickness squared for gypsum mortar.
3.2 The detectability of delamination
Considering the relatively fixed thickness of indoor plastering, there exists a certain linear relationship between the depth of defects and their thickness. This allows for the depth factor to be considered secondary in the detection of indoor plastering delamination defects, focusing instead on thickness and size as the primary detection metrics. This study introduces the concept of Width-to-Thickness Ratios (WTTRs)—the ratio between the size of the delamination and its thickness—as a measure for analyzing the detectability of delamination defects. This concept has been widely applied in the implementation of infrared thermal imaging technology for concrete bridge decks, as well as in exploring the impact of solar radiation on imaging subsurface features in concrete, to analyze the detectability of layered defects.
Figure 7 presents the detectability analysis of delamination defects. Based on the approximate linear relationship between the thickness and size of the plastering (cement and gypsum) delamination defects and their absolute contrast discussed in the previous section, a certain detection range has been confirmed. In this experimental setup, all nine defects were effectively detected within this range. Given the findings that larger delamination defect thickness and size result in higher absolute contrast, thus favoring defect detection, it can be reasonably inferred that within 48 h post-plastering, as long as the delamination defects exceed a thickness of 1 mm, size of 100 mm, and have a width-to-thickness ratio between 20 and 200, these defects can be effectively detected.
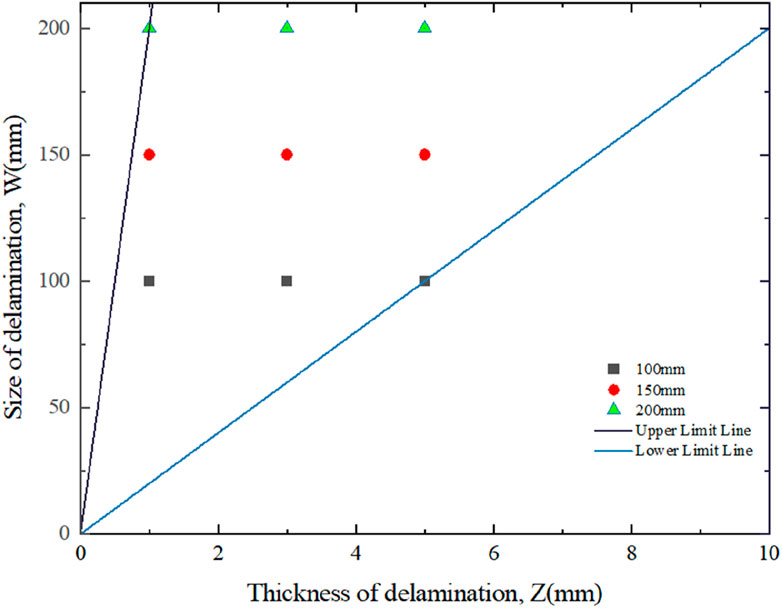
Figure 7. Detectability range for delamination defects.
3.3 Effective time window for delamination detection
Determining an effective detection time window is crucial for the application of passive infrared thermography technology in on-site structural inspections. By analyzing the time-domain absolute contrast curves of layered defects caused by hydration reactions and environmental temperature changes, this study identifies the corresponding detection time windows, as illustrated in Figure 8.
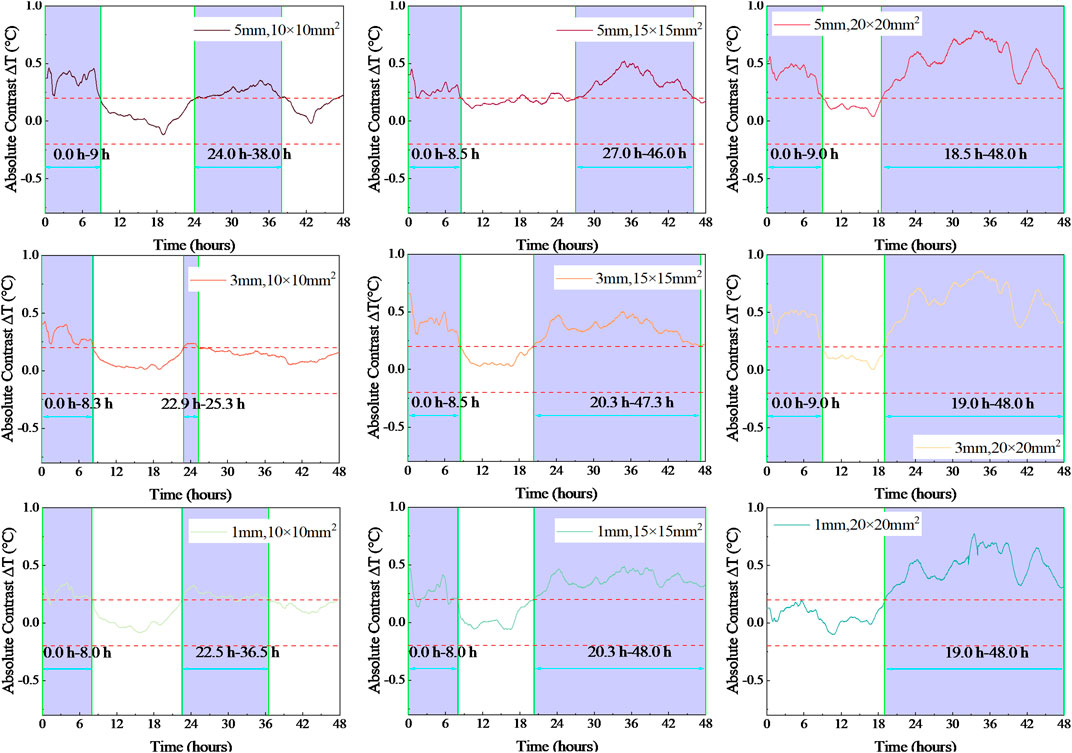
Figure 8. Effective detection time window for delamination defects in cement mortar specimens.
Figure 8 reveals two detection time windows for layered defects in cement mortar plasters. The first window, lasting from 8 to 9 h, allows for the observation of defects immediately after the start of data collection. This could be attributed to the rise in environmental temperature causing the plaster surface to heat up and enabling early detection of layered defects. The second detection window extends from 14 to 29 h, with 3 mm and 15 × 15 mm2 defects first observed at 20.3 h. Defects measuring 1 mm and 10 × 10 mm2 are no longer observable after 36.5 h, yet defects such as 5 mm and 20 × 20 mm2, 3 mm and 20 × 20 mm2, 1mm and 20 × 20 mm2, and 1 mm and 15 × 15 mm2 remain detectable at 48 h. Notably, the 3 mm and 10 × 10 mm2 defect deviates from this pattern, lasting only 2.4 h, but the absolute contrast approaches the threshold between 22.9 and 36 h.
For gypsum mortar plasters, as shown in Figure 9, two detection time windows are also observed. The first window is shorter, lasting between 2 and 3.9 h, with 1 mm and 15 × 15 mm2 defects initially observed at 4.2 h and 5 mm and 10 × 10 mm2 defects becoming undetectable after 9.5 h. The second window, lasting from 25 to 38 h, allows for the observation of defects such as 5 mm and 15 × 15 mm2, 5 mm and 20 × 20 mm2, 3 mm and 20 × 20 mm2, and 5 mm and 15 × 15 mm2, all of which remain detectable at 48 h.
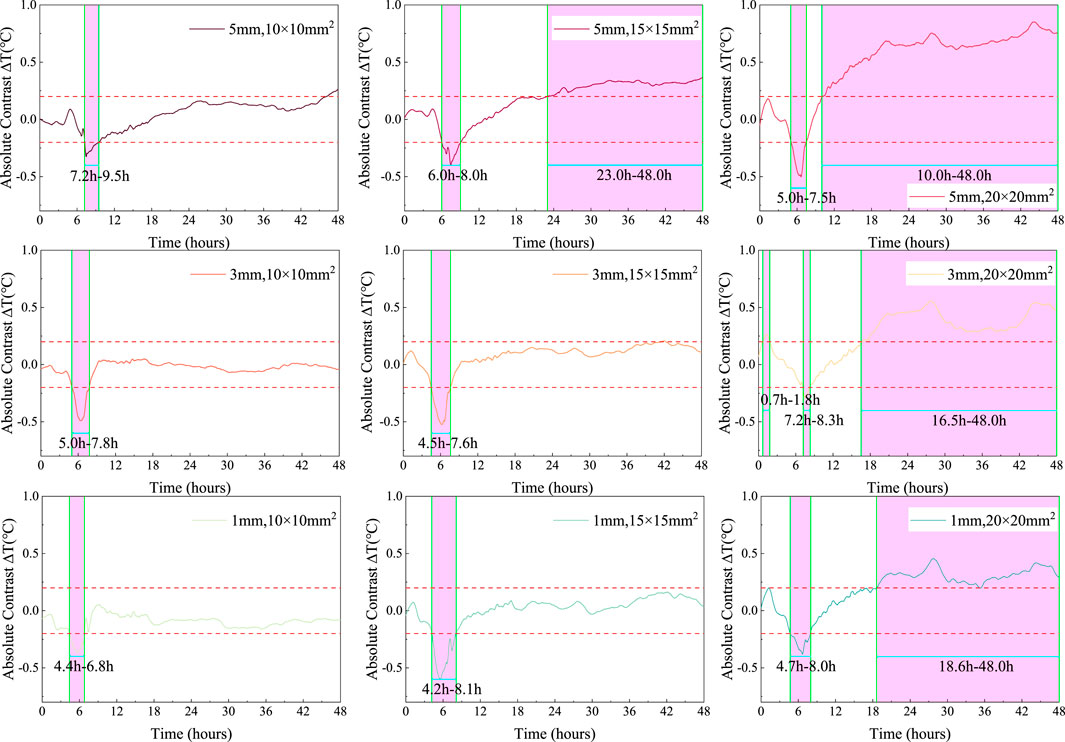
Figure 9. Effective detection time window for delamination defects in gypsum mortar specimens.
Given the significant impact of plastering material on the detection time windows, this study sets the detection window for cement mortar plasters from 22 to 42 h, with the optimal detection time point at 34 h. For gypsum mortar plasters, the detection window is set from 6 to 8 h, with 7 h as the optimal detection time point. These periods not only enable the detection of all layered defects but also encompass the time points where the absolute contrast peaks.
3.4 Analysis of influencing factors
The impact of ambient temperature on infrared thermographic detection results is significant, especially when detecting delamination defects in cement and gypsum mortar specimens. In Figure 9, This work observed the changes in absolute contrast of the delamination defect areas measuring 5mm, 200 × 200mm2, along with the variations in ambient temperature, through the data collection process for specimens of two different materials.
For cement mortar specimens, Figure 10A clearly reveals the consistency between the trend of absolute contrast changes in the delamination defect areas and the trend of ambient temperature changes. Notably, the peak values of absolute contrast for delamination defects within two detection time windows almost perfectly align with the peak areas of ambient temperature, underscoring the critical role of ambient temperature in the detection of delamination defects in cement mortar specimens during the curing stage.
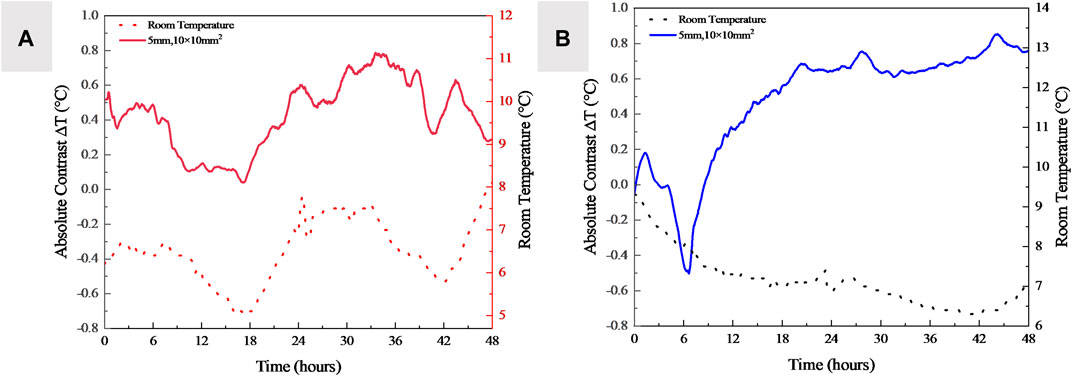
Figure 10. (A) Absolute contrast and ambient temperature changes for 5 mm, 200 × 200 mm2delamination in cement mortar; (B) Absolute contrast and ambient temperature changes for 5 mm, 200 × 200 mm2delamination in gypsum mortar.
However, the situation is slightly different for gypsum mortar specimens, as shown in Figure 10B. Initially, there is a lack of consistency between the changes in absolute contrast of the delamination defect areas and the changes in ambient temperature, and the peak values of absolute contrast for delamination defects in the initial detection window do not align with the peak values of ambient temperature. This indicates that ambient temperature is not the dominant factor affecting the detection of delamination defects in gypsum mortar specimens in the early stages. During the 0–6 h of temperature decline, the hydration heat of the gypsum mortar partially offset by the environmental cooling is detrimental to the detection of delamination defects. However, in the later stages, as the release of hydration heat decreases, ambient temperature becomes a facilitating factor, allowing the detection of some delamination defects, thereby indicating that ambient temperature plays a leading role in the detection of delamination defects in gypsum mortar specimens during the curing stage in the later phases.
4 Conclusion
In this study, we developed and evaluated a method based on Infrared Thermal Imaging Technology (IRT) for detecting delamination defects in the plastering of cement and gypsum mortar during construction. By conducting IRT tests on specimens prepared with two different plasters over a span of 48 h post-grouting, This work arrived at the following key findings:
1. The application of IRT technology successfully identified delamination defects in plasters with a thickness of 10mm, characterized by a thickness greater than 1mm, size exceeding 100mm, and a width-to-thickness ratio between 20 and 200.
2. The experimental results indicated that for cement mortar, the absolute contrast increases with the size of the defect, and more significantly so under consistent thickness conditions; similarly, under consistent size conditions, the absolute contrast uniformly increases with the thickness of the defect. The impact of size on absolute contrast was greater than that of thickness. A similar pattern was observed for gypsum mortar, where the effect of size on absolute contrast also exceeded that of thickness.
3. For cement mortar specimens, two optimal detection time windows were identified within 48 h post-construction: 0–8 h and 20.3–36.5 h. Environmental factors played a key role in these windows, with the latter showing a greater peak in absolute contrast and a longer duration, making it more suitable for defect detection. Accordingly, the optimal detection time point was determined to be 34 h.
4. Similarly, for gypsum mortar specimens, two detection time windows were identified within 48 h post-construction: 0–8.3 h and 22–42 h. Hydration heat stimulation mainly affected the first window, while environmental stimulation primarily influenced the second window. All defects were detectable within the first window, with the maximum absolute contrast, making it more favorable for defect detection. Therefore, the optimal detection time point for gypsum mortar specimens was established at 7 h.
Data availability statement
The original contributions presented in the study are included in the article/Supplementary material, further inquiries can be directed to the corresponding author.
Author contributions
RW: Formal Analysis, Writing–original draft. HZ: Data curation, Writing–original draft. QZ: Conceptualization, Writing–original draft. PZ: Supervision, Writing–original draft. ZZ: Data curation, Methodology, Supervision, Writing–original draft. CX: Conceptualization, Writing–original draft. LH: Writing–original draft, Writing–review and editing.
Funding
The author(s) declare that financial support was received for the research, authorship, and/or publication of this article. This research was funded by the College Students’ Innovation and Entrepreneurship Training Program (2022cxcy321) and the National Natural Science Foundation of China (52079128).
Conflict of interest
The authors declare that the research was conducted in the absence of any commercial or financial relationships that could be construed as a potential conflict of interest.
Publisher’s note
All claims expressed in this article are solely those of the authors and do not necessarily represent those of their affiliated organizations, or those of the publisher, the editors and the reviewers. Any product that may be evaluated in this article, or claim that may be made by its manufacturer, is not guaranteed or endorsed by the publisher.
References
American Society for Testing and Materials (2007) Standard test method for detecting delaminations in bridge decks using infrared thermography. United States: ASTM International.
Bingol, O. R., Schiefelbein, B., Grandin, R. J., Holland, S. D., and Krishnamurthy, A. (2019). An integrated framework for solid modeling and structural analysis of layered composites with defects. Computer-Aided Des. 106, 1–12. doi:10.1016/j.cad.2018.07.006
Cheng, C., Na, R., and Shen, Z. (2019). Thermographic Laplacian-pyramid filtering to enhance delamination detection in concrete structure. Infrared Phys. Technol. 97, 162–176. doi:10.1016/j.infrared.2018.12.039
Cheng, C., and Shen, Z. (2021). Semi real-time detection of subsurface consolidation defects during concrete curing stage. Constr. Build. Mater. 270, 121489. doi:10.1016/j.conbuildmat.2020.121489
Chew, M. Y. L. (1992). The study of adhesion failure of wall tiles. Build. Environ. 27 (4), 493–499. doi:10.1016/0360-1323(92)90047-s
Chew, M. Y. L., and De Silva, N. (2004). Factorial method for performance assessment of building facades. J. Constr. Eng. Manag. 130 (4), 525–533. doi:10.1061/(asce)0733-9364(2004)130:4(525)
Chew, M. Y. L., Tan, S. S., and Kang, K. H. (2004). A technical evaluation index for curtain wall and cladding facades. Struct. Surv. 22 (4), 210–227. doi:10.1108/02630800410563750
Chew, M. Y. L., Tan, S. S., and Kang, K. H. (2005). Contribution analysis of maintainability factors for cladding facades. Archit. Sci. Rev. 48 (3), 215–227. doi:10.3763/asre.2005.4828
Dabous, S. A., and Feroz, S. (2020). Condition monitoring of bridges with non-contact testing technologies. Automation Constr. 116, 103224. doi:10.1016/j.autcon.2020.103224
Edis, E., Flores-Colen, I., and De Brito, J. (2015). Building thermography: detection of delamination of adhered ceramic claddings using the passive approach. J. Nondestruct. Eval. 34, 268–313. doi:10.1007/s10921-014-0268-2
Gupta, M., Khan, M. A., Butola, R., and Singari, R. M. (2022). Advances in applications of non-destructive testing (NDT): a review. Adv. Mater. Process. Technol. 8 (2), 2286–2307. doi:10.1080/2374068x.2021.1909332
Hiasa, S., Birgul, R., and Catbas, F. N. (2017). Effect of defect size on subsurface defect detectability and defect depth estimation for concrete structures by infrared thermography. J. Nondestruct. Eval. 36 (3), 57. doi:10.1007/s10921-017-0435-3
Huh, J., Doan, N. S., Ta, Q. T., and Haldar, A. (2023). Detection of deteriorations in both bottom and top of concrete bridge decks during blind time windows from thermographic inspections of shaded side. NDT E Int. 138, 102871. doi:10.1016/j.ndteint.2023.102871
Huh, J., Tran, Q. H., Lee, J.-H., Han, D., Ahn, J.-H., and Yim, S. (2016). Experimental study on detection of deterioration in concrete using infrared thermography technique. Adv. Mater. Sci. Eng. 2016, 1–12. doi:10.1155/2016/1053856
Kretzmann, J. E., Venter, G., and Schreve, K. (2016). Non-destructive testing with transient thermography on composite materials. R D J. South Afr. Institution Mech. Eng. 32, 35–43.
Li, S., Han, S., Wang, J., Han, X., Zheng, P., Cui, C., et al. (2023). Infrared thermography detection of grouting defects in external post-tensioned tendon ducts under construction hydration heat excitation. NDT E Int. 134, 102785. doi:10.1016/j.ndteint.2022.102785
Lourenço, T., Matias, L., and Faria, P. (2016). “Anomaly diagnosis in ceramic claddings by thermography—a review,” in Proceedings of the 7th International Conference on Safety and Durability of Structures (ICOSADOS 2016), Vila Real, Portugal, May 10 - 12, 2016, 10–12.
Lublasser, E., Hildebrand, L., Vollpracht, A., and Brell-Cokcan, S. (2017). Robot assisted deconstruction of multi-layered façade constructions on the example of external thermal insulation composite systems. Constr. Robot. 1, 39–47. doi:10.1007/s41693-017-0001-7
Mac, V. H., Tran, Q. H., Huh, J., Doan, N. S., Kang, C., and Han, D. (2019). Detection of delamination with various width-to-depth ratios in concrete bridge deck using passive IRT: limits and applicability. Materials 12 (23), 3996. doi:10.3390/ma12233996
Raja, B. N. K., Miramini, S., Duffield, C., Sofi, M., Mendis, P., and Zhang, L. (2020). The influence of ambient environmental conditions in detecting bridge concrete deck delamination using infrared thermography (IRT). Struct. Control Health Monit. 27 (4), e2506. doi:10.1002/stc.2506
Raja, B. N. K., Miramini, S., Duffield, C., Sofi, M., and Zhang, L. (2022). Infrared thermography detection of delamination in bottom of concrete bridge decks. Struct. Control Health Monit. 29 (3), e2886. doi:10.1002/stc.2886
Rocha, J. H. A., and Póvoas, Y. V. (2017). Infrared thermography as a non-destructive test for the inspection of reinforced concrete bridges: a review of the state of the art. Rev. Alconpat 7 (3), 200–214. doi:10.21041/ra.v7i3.223
Shaloo, M., Schnall, M., Klein, T., Huber, N., and Reitinger, B. (2022). A review of non-destructive testing (NDT) techniques for defect detection: application to fusion welding and future wire arc additive manufacturing processes. Materials 15 (10), 3697. doi:10.3390/ma15103697
Silva, M. I., Malitckii, E., Santos, T. G., and Vilaça, P. (2023). Review of conventional and advanced non-destructive testing techniques for detection and characterization of small-scale defects. Prog. Mater. Sci. 138, 101155. doi:10.1016/j.pmatsci.2023.101155
Tomita, K., and Chew, M. Y. L. (2022). A review of infrared thermography for delamination detection on infrastructures and buildings. Sensors 22 (2), 423. doi:10.3390/s22020423
Tran, Q. H., Han, D., Kang, C., Haldar, A., and Huh, J. (2017). Effects of ambient temperature and relative humidity on subsurface defect detection in concrete structures by active thermal imaging. Sensors 17 (8), 1718. doi:10.3390/s17081718
Tran, Q. H., Huh, J., Kang, C., and Han, D. (2018b). Effects of rebars on the detectability of subsurface defects in concrete bridges using square pulse thermography. NDT E Int. 100, 92–100. doi:10.1016/j.ndteint.2018.09.001
Tran, Q. H., Huh, J., Kang, C., Lee, B. Y., Kim, I.-T., and Ahn, J.-H. (2018a). Detectability of subsurface defects with different width-to-depth ratios in concrete structures using pulsed thermography. J. Nondestruct. Eval. 37, 32–11. doi:10.1007/s10921-018-0489-x
Washer, G. (2012). Advances in the use of thermographic imaging for the condition assessment of bridges. Bridge Struct. 8 (2), 81–90. doi:10.3233/brs-2012-0041
Washer, G., Fenwick, R., and Bolleni, N. (2010). Effects of solar loading on infrared imaging of subsurface features in concrete. J. Bridge Eng. 15 (4), 384–390. doi:10.1061/(asce)be.1943-5592.0000117
Watase, A., Birgul, R., Hiasa, S., Matsumoto, M., Mitani, K., and Catbas, F. N. (2015). Practical identification of favorable time windows for infrared thermography for concrete bridge evaluation. Constr. Build. Mater. 101, 1016–1030. doi:10.1016/j.conbuildmat.2015.10.156
Zhang, S., Li, X., Zhang, X., and Zhang, S. (2021). Infrared and visible image fusion based on saliency detection and two-scale transform decomposition. Infrared Phys. Technol. 114, 103626. doi:10.1016/j.infrared.2020.103626
Zhao, Z. (2021). Review of non-destructive testing methods for defect detection of ceramics. Ceram. Int. 47 (4), 4389–4397. doi:10.1016/j.ceramint.2020.10.065
Keywords: layering defects, infrared thermal imaging, non-destructive testing, hydration heat, environmental temperature
Citation: Wan R, Zhao H, Zhang Q, Zheng P, Zhong Z, Xue C and Huang L (2024) Semi-real-time infrared thermography for detecting layering defects in plasters solidification within indoor environments. Front. Mater. 11:1405745. doi: 10.3389/fmats.2024.1405745
Received: 23 March 2024; Accepted: 06 May 2024;
Published: 14 June 2024.
Edited by:
Paulina Faria, NOVA University of Lisbon, PortugalReviewed by:
Luis Matias, National Laboratory for Civil Engineering, PortugalLucio Nobile, University of Bologna, Italy
Copyright © 2024 Wan, Zhao, Zhang, Zheng, Zhong, Xue and Huang. This is an open-access article distributed under the terms of the Creative Commons Attribution License (CC BY). The use, distribution or reproduction in other forums is permitted, provided the original author(s) and the copyright owner(s) are credited and that the original publication in this journal is cited, in accordance with accepted academic practice. No use, distribution or reproduction is permitted which does not comply with these terms.
*Correspondence: Liang Huang, aHVhbmdsaWFuZ0B6enUuZWR1LmNu
†These authors have contributed equally to this work