 Anomitra Chakraborty1
 Rania Saadeh2
 Ahmad Qazza2
 Naser Zomot2Pranitha Janapatla1
 Umair Khan3,4*Mohammad Qraywi5
 Taseer Muhammad6
- 1Department of Mathematics, National Institute of Technology Warangal, Warangal, India
- 2Faculty of Science, Zarqa University, Zarqa, Jordan
- 3Department of Mathematics, Faculty of Science, Sakarya University, Sakarya, Türkiye
- 4Department of Computer Science and Mathematics, Lebanese American University, Byblos, Lebanon
- 5Department of Civil Engineering, Faculty of Engineering and Built Environment, Universiti Kebangsaan Malaysia, Bangi, Selangor, Malaysia
- 6Department of Mathematics, College of Science, King Khalid University, Abha, Saudi Arabia
The present article aims to examine the thermal performance and the sensitivity analysis of a
1 Introduction
Nanotechnology is the field of science that deals with nanometer-sized particles with a size range of 1–100 nm. Nanofluids have a higher thermal conductivity than ordinary fluids due to the addition of nanoparticles. They are mostly used in the smart computing and medical fields. In 1995, Choi and Eastman (1995) first revealed the presence of nanofluids to the scientific world. The Tiwari–Das and Buongiorno models (Buongiorno, 2005; Tiwari and Das, 2007) are the two types of nanofluid models used widely in current academic research. Hatami and Safari (2016) and Makinde and Aziz (2011) completed extensive studies on the nature of nanofluid flows over various geometries. Kumari et al. (2001), Chakraborty and Janapatla (2023) and Gorla et al. (2010) used vertical wedge geometry to study the steady and mixed convective flows of nanofluids.
With a structure mimicking a honeycomb, graphene (Gr) comprises single-layered
The study of the radiation effect is one of the most important effects studies in academia for its wide range of applications in science and technology concerning heat and mass transfer of flows. Being implemented in nuclear waste extraction and separation processes, the study of convective heat transfer within fluid flow has gained importance among researchers. Some extensive and comprehensive studies were performed on the convective nature of the flows (Sivakumar et al., 2017). One study examined a magnetohydrodynamics (MHD) flow of ferro-liquid in the presence of two types of external effects, viz, viscous dissipative radiation effects with slip and convective boundary conditions along with the thermal radiation effect (Cheng, 1979). TiO2 is a non-toxic, economical, stable ceramic material with a relatively high thermal conductivity (4.0–11.8 W m–1 K−1). The thermal behavior was studied in the presence of a heat source/sink for a copper-titanium oxide (Cu–TiO2) hybrid nanofluid (Leong et al., 2018), and the results were concurrently compared to a conventional (Cu and TiO2) nanofluid. The mathematical model of a nanofluid with based fluid (engine oil) and titanium dioxide nanoparticles (Vasheghani et al., 2013).
The tool used by the present researchers to examine the extent of the effect of any parameter is the sensitivity analysis, which gained its importance for the wide range of applications in control theory and nuclear industries. Empirical relationships are formed to correlate the input and the output responses with the help of ANOVA using the response surface methodology (RSM). The primary focus of the study was to implement a sensitivity analysis for the Newtonian nanofluid study. In this context, using triangle-shaped obstacles, Rashidi et al. (2015) conducted a sensitivity analysis using the RSM. It was observed that the wedge angle parameter proved to be more sensitive to the Nusselt number than the skin friction coefficient. Darbari et al. (2016) studied the flow through a channel and evaluated the sensitivity analysis of the nanofluid flow properties. Reynold’s number was found to be most sensitive to the entropy generation. The RSM was utilized to investigate the Casson fluid flow, and, as expected, Abdelmalek et al. (2020) found that positive sensitivity prevails for a Nusselt number with increasing magnetic parameters.
The combined effects of magnetic effects, the Falkner–Skan parameter
2 Problem formulation
A steady, laminar, and 2D incompressible flow is considered in the present study with an aqueous solution of the
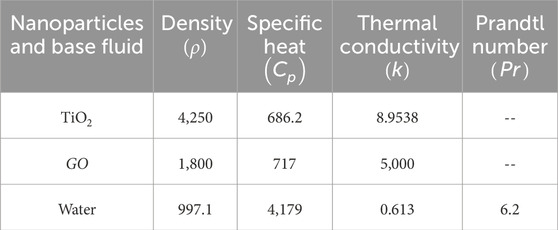
Table 1. Thermophysical properties of nanoparticles and base fluids.
Figure 1 shows the schematic representation of the problem considered for our study. The x-axis is taken along the wedge surface, and the free stream velocity is considered
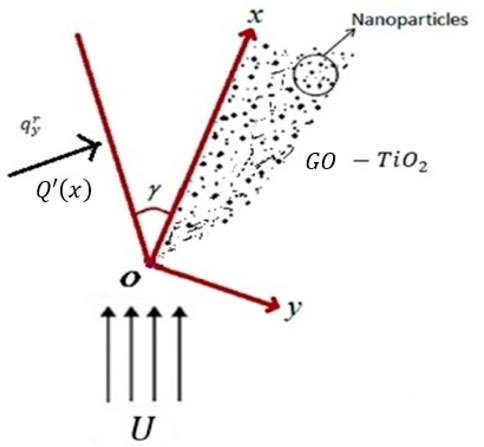
Figure 1. Schematic model of the problem.
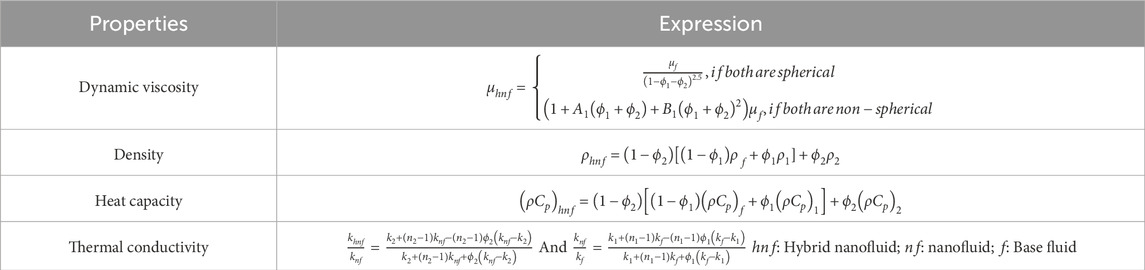
Table 2. Thermophysical properties of hybrid nanofluids (Maïga et al., 2004).
The assumptions considered for our problem are as follows:
• We see a variable surface temperature of the wedge as
• The free stream velocity is given by
• We have
• Complete thermal equilibrium is maintained between the nanoparticles and the base fluids, and no slips occur between them.
• In preparing the hybrid nanofluid, graphene oxide was first added to the base fluid (water), and later, titanium was added to the mixture, now a mono nanofluid, as the second nanoparticle.
In Table 2, we have computed the thermal conductivity of the nanofluids
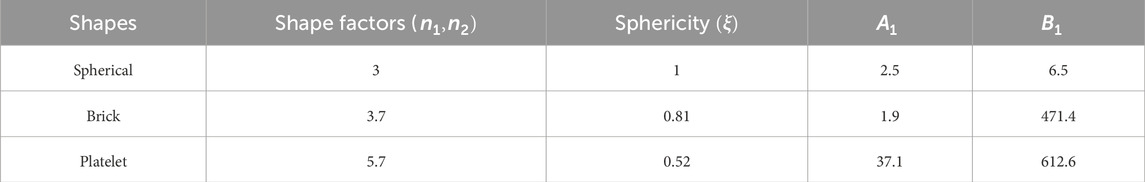
Table 3. Empirical shape factor values [(Dinarvand et al., 2019), (Hassan et al., 2022)].
The equations governing the flow are as follows:
The boundary conditions are as follows (Dinarvand et al., 2019;Maïga et al., 2004):
Using Rosseland’s approximation,
Here,
The set of nondimensional similarity transformations is given by Kock and Herwig (2004) and Madhu et al. (2024):
The stream function
On incorporating Eqs 11, 13 into Eqs 5–9, we obtain
along with the boundary conditions
The quantities can be defined as
Here,
In addition, we have
The drag coefficient
In this context,
Now, using the similarity transformation (8) into Eq. 16, we get the following reduced form as follows:
3 Numerical method
The governing set of Eqs 1–3 is converted to a set of coupled nonlinear ordinary differential equations (ODEs) Eqs 10, 11 using the similarity transformations and the theory concerning the boundary layer. The MATLAB bvp4c method implements the Lobatto IIIA method as the base method used to obtain
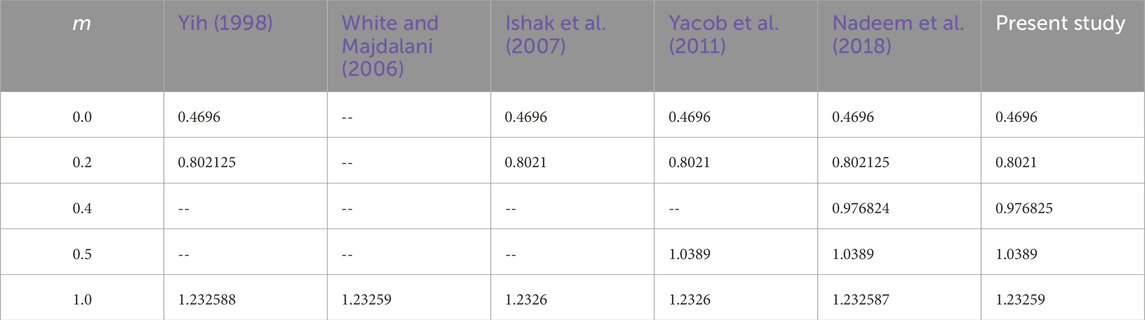
Table 4. Comparison of
4 Results and discussion
The present study has been conducted in the presence of a magnetic field and thermal radiation for a
In Figure 2A, the effects of the Falkner–Skan parameter and the nanoparticle volume fraction values on the velocity profiles for a static wedge have been upheld. In the presence of spherical-shaped nanoparticles
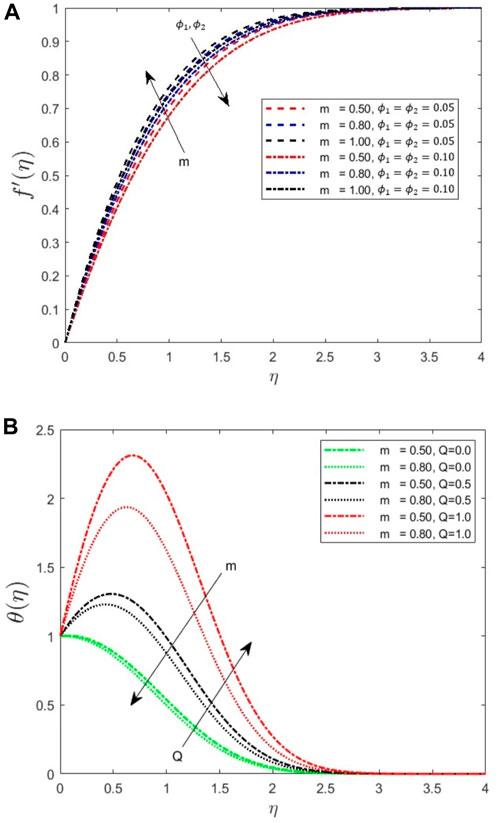
Figure 2. (A) Impact on the velocity profile for increasing
Increasing the values of the Falkner–Skan parameter causes an increase in the thermal boundary layer thickness, which, in turn, causes the temperature of the fluid to decrease, and this phenomenon has been upheld in Figure 2B. Increased heat generation parameter values cause more thermal energy to dissipate in the fluid, and this causes the thickness of the thermal boundary layer to decrease. This results in an increase in the temperature profile of the fluid; the validation of this fact is shown in Figure 2B.
In our study
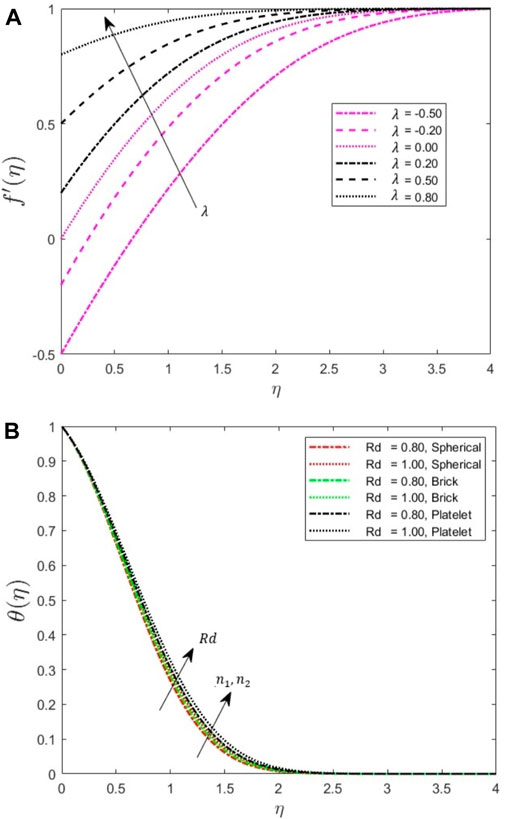
Figure 3. (A) Increasing velocity profile for increasing
The variation in the temperature profile for the increasing radiation parameter values and empirical shape factor of the nanoparticles has been represented in Figure 3B. Increasing the thermal radiation parameter Rd increases the convective flow, which in turn increases the velocity of the fluid. We observe that the thermal boundary layer thickness increases because the heat transfer increases. The temperature distribution is enhanced with an increase in the thermal radiation parameter. Owing to a higher surface area exposed in the fluid flow process, the thermal conductivity increases more for brick and platelet shapes than for spherical shapes. Hence, the temperature profiles are higher for higher shape values.
The increasing radiation parameter also increases the temperature profile of the fluid because, for a higher thermal conductivity, the fluid temperature increases, and, hence, the
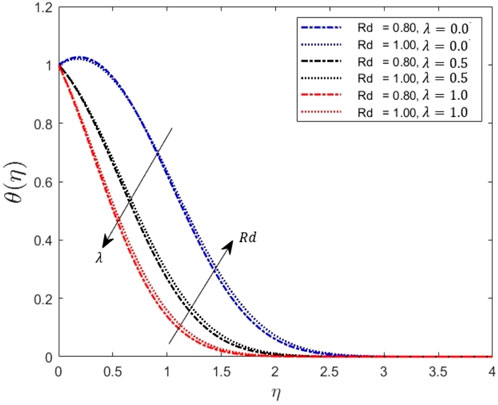
Figure 4. Effects on the velocity profile for increasing
Figure 5 shows that the Nusselt number decreases as the Falkner–Skan parameter and nanoparticle volume fraction increase. As the pressure gradient increases, the flow velocity increases, and the density of the flow medium is reduced. This, in turn, increases the thermal diffusivity of the system. The heat transfer rate is found to be inversely proportional to the thermal diffusivity of the system, and thus, the Nusselt number decreases with increasing parameter

Figure 5. Nusselt number variations for
We see the increasing Nusselt number values when the heat generation parameter increases. Figure 6A, B represents the skin friction coefficient variations for an increasing Falkner–Skan parameter along with increasing nanoparticle volume fraction values for both nanoparticles with spherical shapes. The increasing pressure gradient parameter increases the wall shear stress, while a reverse effect is observed for increasing volume fractions.
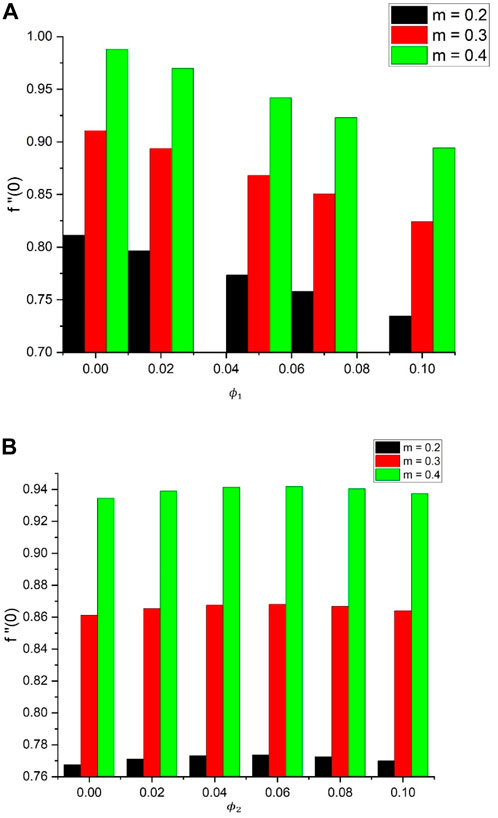
Figure 6. (A) Skin-friction coefficient variations for
Figures 7A–C represent the streamlines for
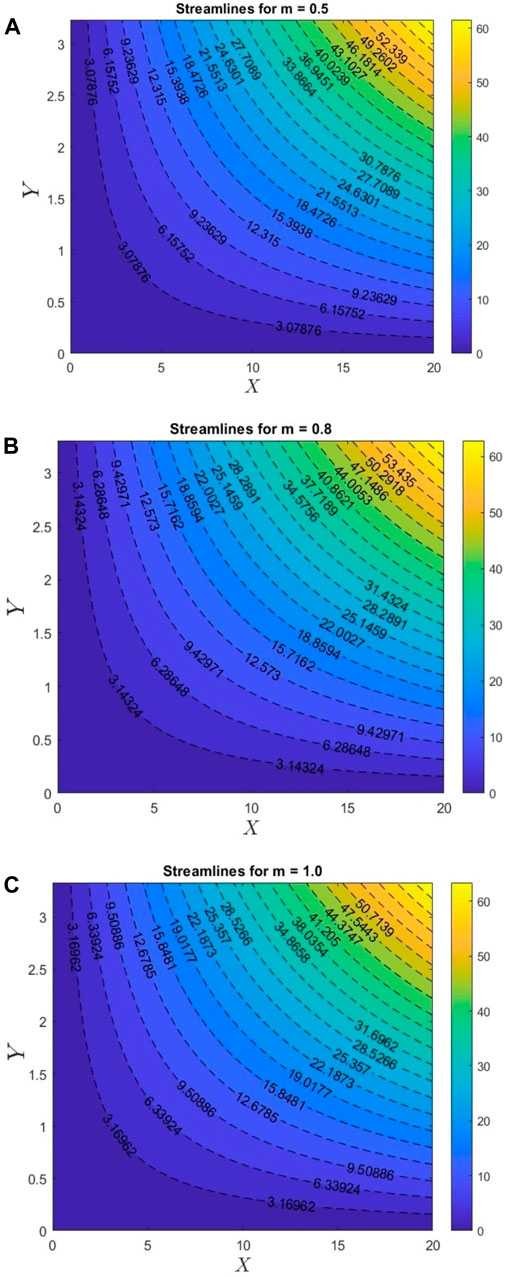
Figure 7. (A–C). Streamlines for increasing
5 Response surface methodology (RSM)
Analyzing any particular data set for its significance in influencing any response is a key role of any boundary layer mode experimental design. Such experimental models can be seen in the literature, such as response surface methodology and factorial designing using the central composite design (CCD) or the Box–Behnken design (BBD). In accordance with the numerical data evaluated, it can be observed that two of three quantities, namely, radiation parameter and pressure gradient, affect and increase the Nusselt number
Here,
5.1 Analysis of variance (ANOVA)
The regression model values are determined by the ANOVA, along with the F-test, T-tests, and the p-values. These regression values are mentioned in Table 5. The F-test determines the variance of the data, and the cases for F-values greater than 1 are considered to be significant for the input data to be correct. The level of significance for our data is 0.05, and outcomes with p-values less than 0.05 are considered statistically significant. Values greater than 0.05 are neglected in the output responses. Therefore, we will neglect the
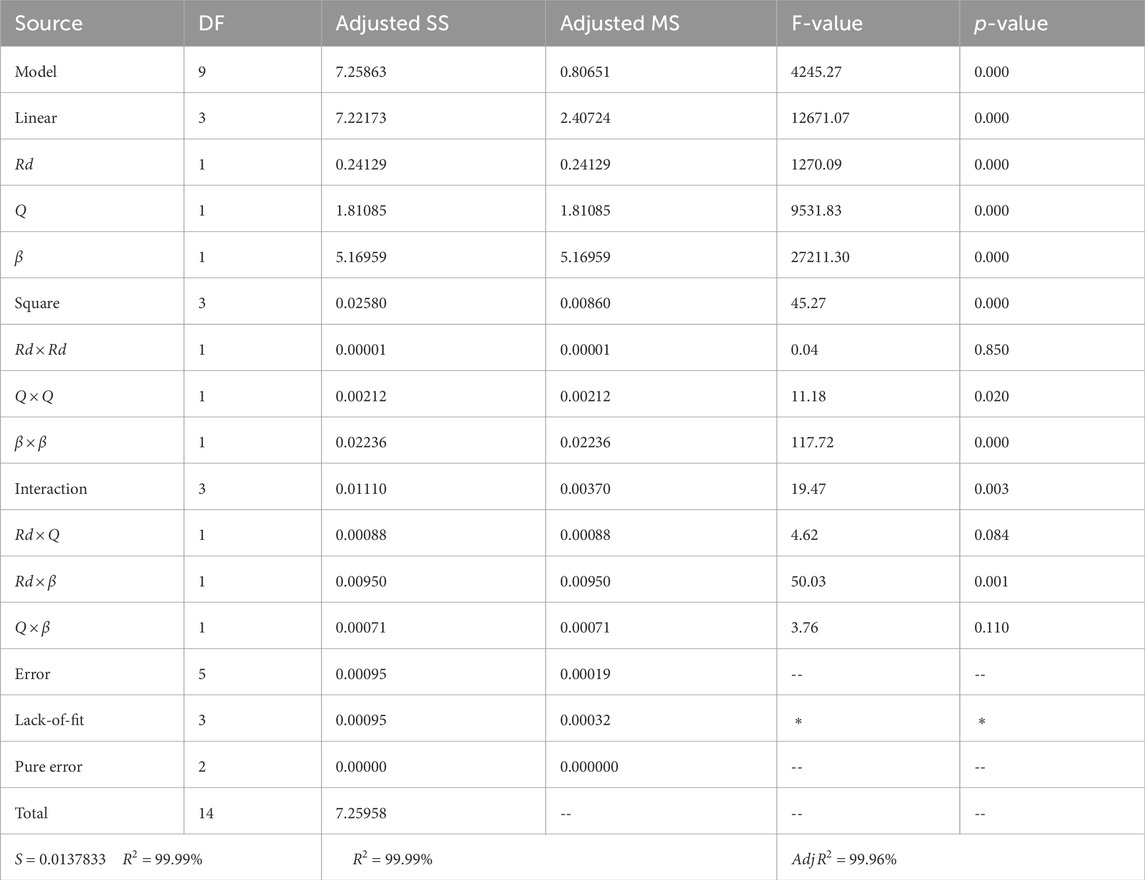
Table 5. ANOVA for Nusselt number.
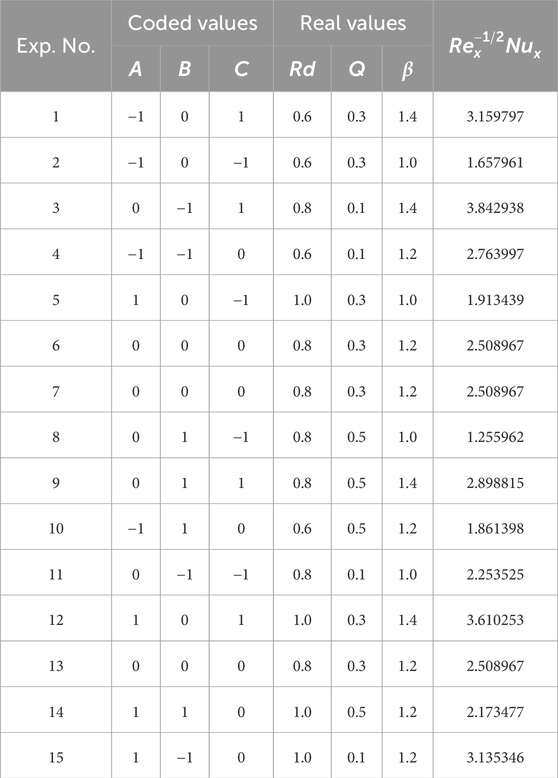
Table 6. Experimental design for coded and real values.
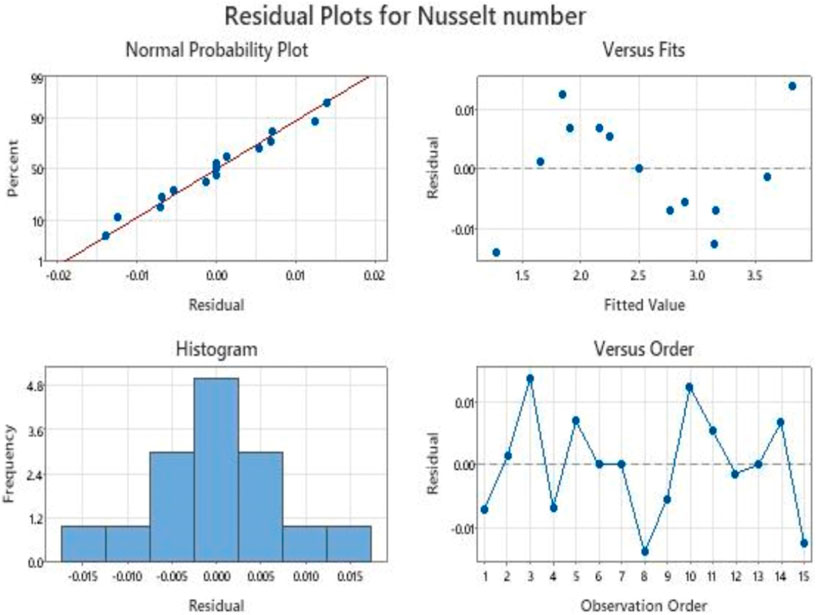
Figure 8. Residual plots for the Nusselt number.
The model proves its goodness of fit by addressing the coefficient of determination determined by the
The Pareto chart in Figure 9 represents the decreasing order of the standardized effects or the F-values for our data, and the red dotted line indicates significance. The terms to the right of the line are significant, and the terms to the left of the line are ignored for better results. Hence the
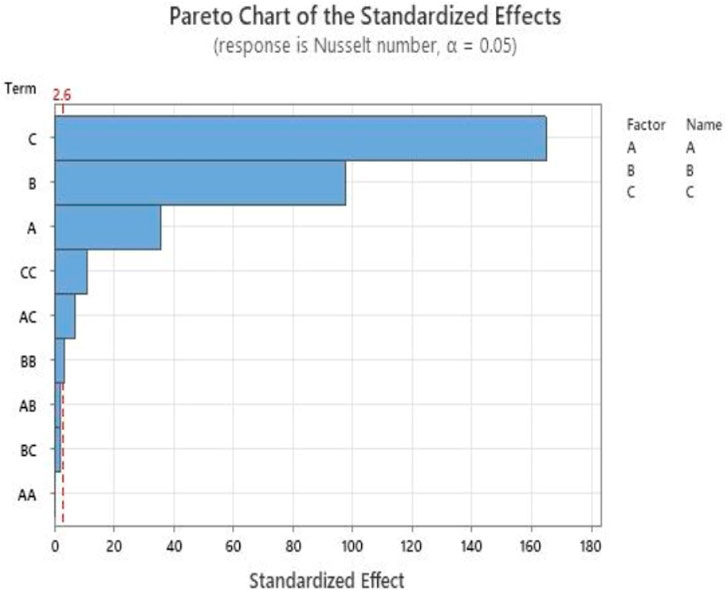
Figure 9. Pareto chart for Nusselt number results.
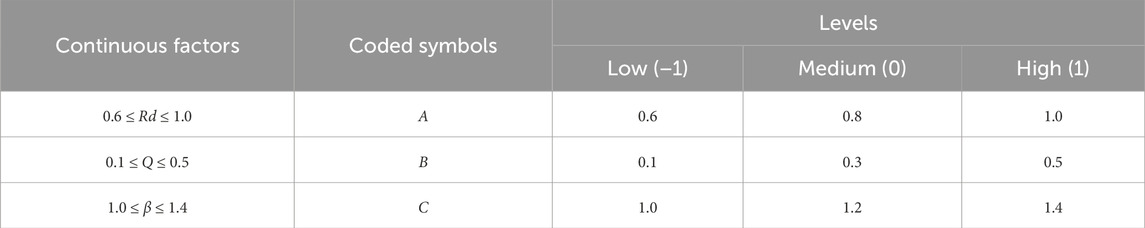
Table 7. Experimental designing for the factors and its levels.
The contour plots in Figure 10 represent the behavioral patterns of the Nusselt number for increasing radiation effect, pressure gradient, and heat source effects. From Figure 10A, we can observe that the highest values of the Nusselt number indicated by dark green occur for the lowest heat source parameter values and the highest radiation parameter values. Hence, it indicates that the Nusselt number increases with increasing
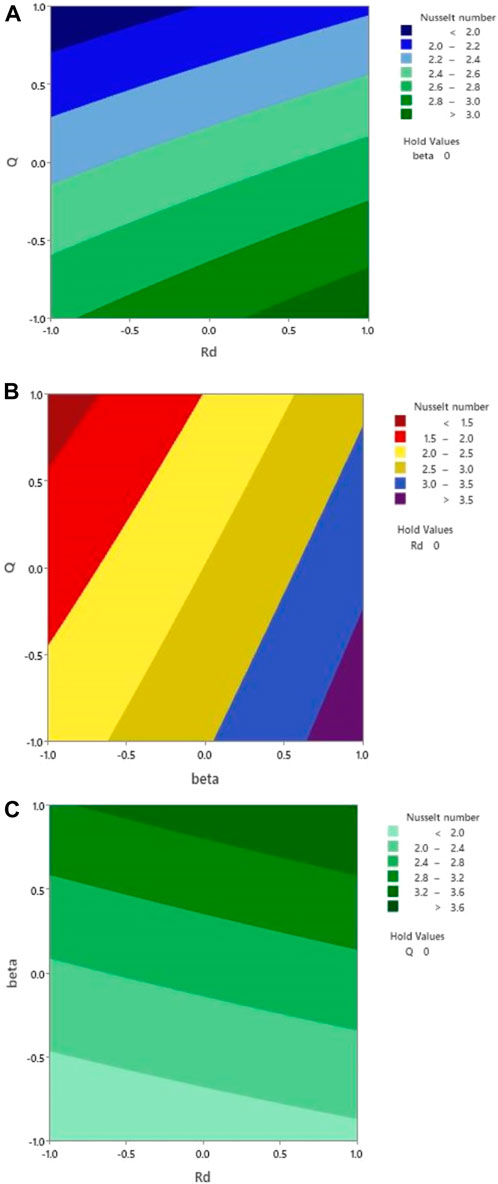
Figure 10. Contour plots for skin friction for (A)
The surface plots in Figure 11 also represent the fact described in Figure 10 in a more explanatory way, where the decreasing slopes of the surfaces in all three subfigures indicate that

Figure 11. 3D surface plots for the Nusselt number for (A)

Figure 12. Flowchart of sensitivity analysis.
6 Sensitivity analysis
The goal of this study is to determine how the uncertainties corresponding to the system inputs can be correlated to the response to the physical problem. It provides an effective and concrete justification of how much the continuous factors influence the response parameter. The flow chart of the analysis is provided in Figure 13. In this analysis, we need to evaluate the partial derivatives of Eq.

Figure 13. Normal plot of standardized effects.
Using Eqs (20)-(22), we evaluate the sensitivity analysis for three possible levels for each parameter and infer using the obtained results in Table 5. The sensitivity graphs shown in Figure 14 clearly portray the behavior of each of the input parameters in influencing the Nusselt number response. In Table 8, we see that the highest sensitivity value
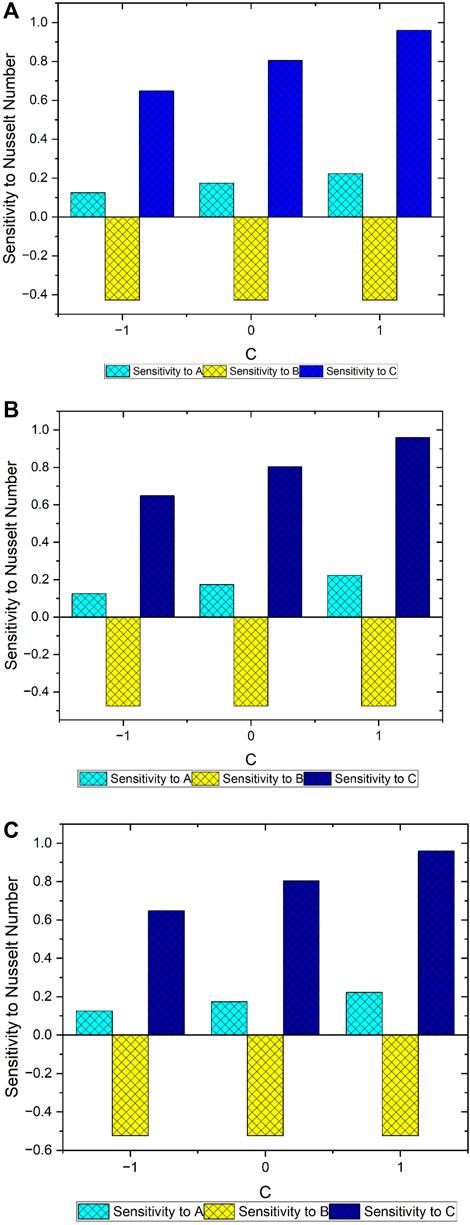
Figure 14. The plots on sensitivity for Nusselt number when
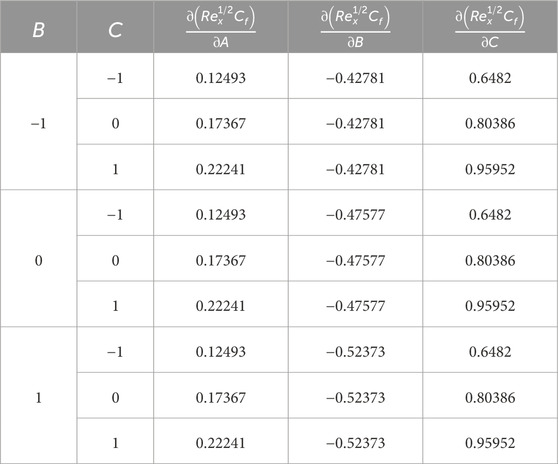
Table 8. Sensitivity values for
7 Conclusion
In this present study, we carried out a numerical investigation studying the effects of Rd, the heat absorption parameter, and the Falkner–Skan parameter for a 2D, hybrid nanofluid flow on a wedge geometry and conducted a sensitivity analysis using BBD. The PDEs were obtained using the Tiwari–Das model to define the problem chosen in this article. Later, they were converted to nondimensional ODEs using similarity transformations. Some of the major conclusions drawn from the results are:
• There is a decrease in the heat transfer coefficient for an increased Falkner–Skan parameter, and increasing the empirical shape factor values results in a decrease of the Nusselt number values.
• The local skin friction coefficient decreases when the concentration of nanoparticles 1 and 2 increases.
• Increasing radiation parameters result in increased Nusselt numbers.
• The high values of
• The Nusselt number is most sensitive toward the Hartree pressure gradient at all levels of the other two independent factors.
• Two input parameters show a positive sensitivity toward the dependent response parameter, and one of the parameters shows a negative response, which indicates that an increase of that parameter causes the Nusselt number to decrease, which justifies the physical properties of the fluid flow.
The factors that affect the heat transfer and the skin friction coefficients for the concerning flow have been thoroughly investigated in this article, and the results are represented graphically. The motivation for this study is its contributions in the fields of magnetic drug targeting, medical sciences, and oil and petroleum industries. As a scope for future work, RSM can be paired with multiple regression analysis for three or more independent input parameters and various other effects on a wedge model with different nanoparticle shapes and in the presence of nanoparticle aggregation. The various applications of the present study in the field of oil drilling, emulsion stabilizers, oxalic acid removal, and additives of multi-grade oils provide additional motivation for our present study. Furthermore, this problem can also be extended to apply the distinct schemes like ANN, fractional derivatives and ARA- Sumudu decomposition method etc., see [Saadeh et al. (2023a, 2023b), Chandan et al. (2024), and Qazza et al. (2023)].
Data availability statement
The raw data supporting the conclusion of this article will be made available by the authors, without undue reservation.
Author contributions
AC: conceptualization, formal analysis, methodology, software, validation, and writing–original draft. RS: formal analysis, funding acquisition, investigation, project administration, validation, and writing–review and editing. AQ: formal analysis, funding acquisition, investigation, project administration, validation, and writing–review and editing. NZ: formal analysis, funding acquisition, investigation, project administration, validation, and writing–review and editing. PJ: conceptualization, resources, supervision, writing–original draft, and writing–review and editing. UK: data curation, investigation, validation, visualization, and writing–original draft. MQ: data curation, resources, software, validation, writing–original draft, and writing–review and editing. TM: data curation, resources, software, validation, writing–original draft, and writing–review and editing.
Funding
The author(s) declare that financial support was received for the research, authorship, and/or publication of this article. This work has been funded by the Universiti Kebangsaan Malaysia project number “DIP-2023-005.”
Acknowledgments
The authors extend their appreciation to the Deanship of Scientific Research at King Khalid University, Abha, Saudi Arabia for funding this work through General Research Project under grant number GRP/112/44.
Conflict of interest
The authors declare that the research was conducted in the absence of any commercial or financial relationships that could be construed as a potential conflict of interest.
Publisher’s note
All claims expressed in this article are solely those of the authors and do not necessarily represent those of their affiliated organizations, or those of the publisher, the editors, and the reviewers. Any product that may be evaluated in this article, or claim that may be made by its manufacturer, is not guaranteed or endorsed by the publisher.
References
Abdelmalek, Z., Mahanthesh, B., Basir, Md F.Md, Imtiaz, M., Mackolil, J., Saeed Khan, N., et al. (2020). Mixed radiated magneto Casson fluid flow with Arrhenius activation energy and Newtonian heating effects: flow and sensitivity analysis. Alexandria Eng. J. 59 (5), 3991–4011. doi:10.1016/j.aej.2020.07.006
Buongiorno, J. (2005). Convective transport in nanofluids. J. Heat. Transf. 128 (3), 240–250. doi:10.1115/1.2150834
Chakraborty, A., and Janapatla, P. (2023). Scaling group analysis of a magnetohydrodynamic nanofluid flow with double dispersion and Dufour effects on a vertical wedge. Numer. Heat. Transf. Part B Fundam. 84 (3), 271–293. doi:10.1080/10407790.2023.2200984
Chandan, K., Saadeh, R., Qazza, A., Karthik, K., Varun Kumar, R. S., Kumar, R. N., et al. (2024). Predicting the thermal distribution in a convective wavy fin using a novel training physics-informed neural network method. Sci. Rep. 14 (1), 7045.
Cheng, P. (1979). Heat transfer in geothermal systems. Adv. heat Transf. 14, 1–105. doi:10.1016/S0065-2717(08)70085-6
Choi, S., and Eastman, J. (1995). Enhancing thermal conductivity of fluids with nanoparticles. ASME-Publications-Fed. 231, 99–106.
Darbari, B., Rashidi, S., and Abolfazli Esfahani, J. (2016). Sensitivity analysis of entropy generation in nanofluid flow inside a channel by response surface methodology. Entropy 18 (2), 52. doi:10.3390/e18020052
Dinarvand, S., Rostami, M. N., and Pop, I. (2019). A novel hybridity model for TiO2-CuO/water hybrid nanofluid flow over a static/moving wedge or corner. Sci. Rep. 9, 16290. doi:10.1038/s41598-019-52720-6
Ghadikolaei, S. S., Yassari, M., Sadeghi, H., Hosseinzadeh, K., and Ganji, D. D. (2017). Investigation on thermophysical properties of Tio2–Cu/H2O hybrid nanofluid transport dependent on shape factor in MHD stagnation point flow. Powder Technol. 322, 428–438. doi:10.1016/j.powtec.2017.09.006
Gorla, R. S. R., Chamkha, A., and Rashad, A. M. (2010). “Mixed convective boundary layer flow over a vertical wedge embedded in a porous medium saturated with a nanofluid,” in 3rd International Conference on Thermal Issues in Emerging Technologies Theory and Applications (IEEE), China, 19-22 Dec. 2010 (IEEE), 445–451.
Hassan, W., Fida, M., Liu, D., Manzoor, U., and Muhammad, T. (2022). Numerical simulation of entropy generation for nanofluid with the consequences of thermal radiation and Cattaneo-Christov heat flux model. Int. Commun. Heat Mass Transf. 137, 106293. doi:10.1016/j.icheatmasstransfer.2022.106293
Hatami, M., and Safari, H. (2016). Effect of inside heated cylinder on the natural convection heat transfer of nanofluids in a wavy-wall enclosure. Int. J. Heat Mass Transf. 103, 1053–1057. doi:10.1016/j.ijheatmasstransfer.2016.08.029
Ishak, A., Roslinda, N., and Pop, I. (2007). Falkner-Skan equation for flow past a moving wedge with suction or injection. J. Appl. Math. Comput. 25 (1-2), 67–83. doi:10.1007/BF02832339
Kim, J., Cote, L. J., Kim, F., Yuan, W., Shull, K. R., and Hang, J. (2010). Graphene oxide sheets at interfaces. J. Am. Chem. Soc. 132 (23), 8180–8186. doi:10.1021/ja102777p
Kock, F., and Herwig, H. (2004). Local entropy production in turbulent shear flows: a high-Reynolds number model with wall functions. Int J. heat Mass Transf. 47 (10-11), 2205–2215. doi:10.1016/j.ijheatmasstransfer.2003.11.025
Kuilla, T., Bhadra, S., Yao, D., Kim, N. H., Bose, S., and Lee, J. H. (2010). Recent advances in graphene-based polymer composites. Prog. Polym. Sci. 35 (11), 1350–1375. doi:10.1016/j.progpolymsci.2010.07.005
Kumari, M., Takhar, H. S., and Nath, G. (2001). Mixed convection flow over a vertical wedge embedded in a highly porous medium. Heat. Mass Transf. 37 (2-3), 139–146. doi:10.1007/s002310000154
Lee, C., Wei, X., Kysar, J. W., and Hone, J. (2008). Measurement of the elastic properties and intrinsic strength of monolayer graphene. Science 321 (5887), 385–388. doi:10.1126/science.1157996
Leong, K. Y., Razali, I. D., Ahmad, K. K., Amer, N. H., and Akmal, H. N. (2018). Thermal conductivity characteristic of titanium dioxide water based nanofluids subjected to various types of surfactants. J. Eng. Sci. Technol. 13 (6), 1677–1689. doi:10.1016/J.ICHEATMASSTRANSFER.2017.10.005
Madhu, J., Saadeh, R., Karthik, K., Kumar, R. V., Kumar, R. N., Gowda, R. P., et al. (2024). Role of catalytic reactions in a flow-induced due to outer stationary and inner stretched coaxial cylinders: an application of Probabilists’ Hermite collocation method. Case Stud. Therm. Eng. 56, 104218.
Maïga, S. E., Nguyen, C. T., Galanis, N., and Roy, G. (2004). Micro and nano heat transfer heat transfer enhancement in forced convection laminar tube flow by using nanofluids. Int. Symp. Adv. Comput. Heat. Transf. 25, 24. doi:10.1615/ICHMT.2004.CHT-04.620
Makinde, O. D., and Aziz, A. (2011). Boundary layer flow of a nanofluid past a stretching sheet with a convective boundary condition. Int. J. Therm. Sci. 50 (7), 1326–1332. doi:10.1016/j.ijthermalsci.2011.02.019
Mangadlao, J. D., Cao, P., and Advincula, R. C. (2015). Smart cements and cement additives for oil and gas operations. J. Petroleum Sci. Eng. 129, 63–76. doi:10.1016/j.petrol.2015.02.009
Nadeem, S., Ahmad, S., and Muhammad, N. (2018). Computational study of Falkner-Skan problem for a static and moving wedge. Sensors Actuators B Chem. 263, 69–76. doi:10.1016/j.snb.2018.02.039
Natalini, G., and Sciubba, E. (1999). Minimization of the local rates of entropy production in the design of air-cooled gas turbine blades. J. Eng. Gas Turbines Power 121 (3), 466–475. doi:10.1115/1.2818496
Qazza, A., Saadeh, R., Ahmed, S. A., and ARA-Sumudu, (2023). Method for solving volterra partial integro-differential equations. Appl. Math. 17 (4), 727–734.
Rashidi, S., Bovand, M., and Abolfazli Esfahani, J. (2015). Structural optimization of nanofluid flow around an equilateral triangular obstacle. Energy 88, 385–398. doi:10.1016/j.energy.2015.05.056
Saadeh, R., Ahmed, S. A., Qazza, A., and Elzaki, T. M. (2023a). Adapting partial differential equations via the modified double ARA-Sumudu decomposition method. Partial Differ. Equ. Appl. Math. 8, 100539.
Saadeh, R., Ghazal, B., and Burqan, A. (2023b). A study of double general transform for solving fractional partial differential equations. Math. Methods Appl. Sci. 46, 17158–17176.
Sivakumar, N., Prasad, P. D., Raju, C. S. K., Varma, S. V. K., and Shehzad, S. A. (2017). Partial slip and dissipation on MHD radiative ferro-fluid over a non-linear permeable convectively heated stretching sheet. Results Phys. 7, 1940–1949. doi:10.1016/j.rinp.2017.06.016
Sundar, L. S., Singh, M. K., Pereira, A. M., and Sousa, A. C. (2020). Augmentation of Heat Transfer of High Prandtl Number Fe 3 O 4/vacuum pump oil nanofluids flow in a tube with twisted tape inserts in laminar flow. Heat Mass Transf. 56, 3111–3125. doi:10.1007/s00231-020-02913-x
Tiwari, R. K., and Das, M. K. (2007). Heat transfer augmentation in a two-sided lid-driven differentially heated square cavity utilizing nanofluids. Int. J. Heat. Mass Transf. 50 (9-10), 2002–2018. doi:10.1016/j.ijheatmasstransfer.2006.09.034
Vasheghani, M., Marzbanrad, E., Zamani, C., Aminy, M., and Raissi, B. (2013). Thermal conductivity and viscosity of TiO2− engine oil nanofluids. Nanosci. Technol. Int. J. 4 (2), 145–156. doi:10.1615/NanomechanicsSciTechnolIntJ.v4.i2.40
Verma, A. K., Rajput, S., Bhattacharyya, K., Chamkha, A. J., and Yadav, D. (2022). Comparison between graphene-water and graphene oxide-water nanofluid flows over exponential shrinking sheet in porous medium: dual solutions and stability analysis. Chem. Eng. J. Adv. 12, 100401. doi:10.1016/j.ceja.2022.100401
Yacob, N. A., Ishak, A., and Pop, I. (2011). Falkner–Skan problem for a static or moving wedge in nanofluids. Int. J. Therm. Sci. 50 (2), 133–139. doi:10.1016/j.ijthermalsci.2010.10.008
Yih, K. A. (1998). Uniform suction/blowing effect on forced convection about a wedge: uniform heat flux. Acta Mech. 128, 173–181.doi:10.1007/BF01251888
Nomenclature
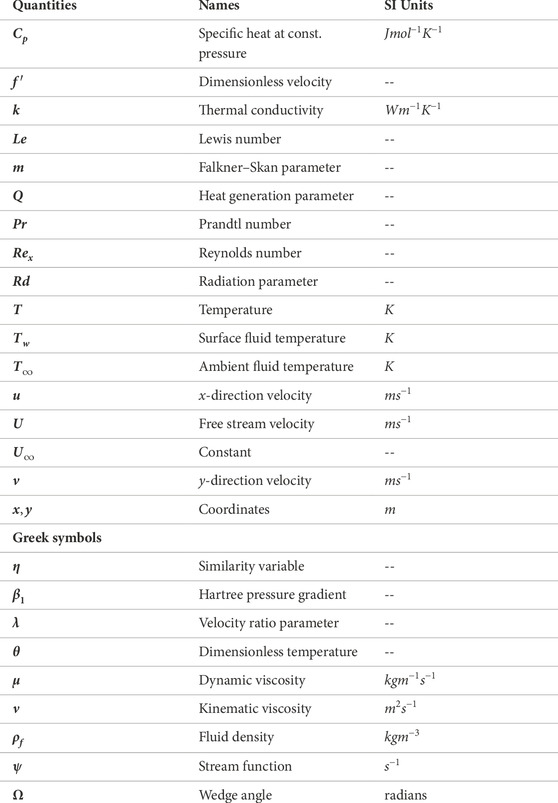
-
Keywords: nanofluid, wedge, radiation, sensitivity analysis, graphene
Citation: Chakraborty A, Saadeh R, Qazza A, Zomot N, Janapatla P, Khan U, Qraywi M and Muhammad T (2024) On the thermal performance of radiative stagnation-point hybrid nanofluid flow across a wedge with heat source/sink effects and sensitivity analysis. Front. Mater. 11:1391377. doi: 10.3389/fmats.2024.1391377
Received: 25 February 2024; Accepted: 18 April 2024;
Published: 10 June 2024.
Edited by:
Amir Abbas, University of Gujrat, PakistanReviewed by:
Padmavathi Thiyagarajan, Saveetha Engineering College, IndiaAdnan Asghar, Universiti Utara Malaysia, Malaysia
Copyright © 2024 Chakraborty, Saadeh, Qazza, Zomot, Janapatla, Khan, Qraywi and Muhammad. This is an open-access article distributed under the terms of the Creative Commons Attribution License (CC BY). The use, distribution or reproduction in other forums is permitted, provided the original author(s) and the copyright owner(s) are credited and that the original publication in this journal is cited, in accordance with accepted academic practice. No use, distribution or reproduction is permitted which does not comply with these terms.
*Correspondence: Umair Khan, dW1haXIua2hhbkBsYXUuZWR1Lmxi