 Gaojian Hu
 Bin Wang2
 Junxia Zhou
- 1School of Energy Science and Engineering, Henan Polytechnic University, Jiaozuo, China
- 2Zhejiang Institute of Mechanical & Electrical Engineering Co., Ltd., Hangzhou, China
- 3Huahui Engineering Design Group Co Ltd, Shaoxing, China
- 4School of Civil Engineering, Liaoning Technical University, Fuxin, China
The elastic modulus of rocks is a measure of the ability of rocks to resist elastic deformation. It is related to the size of rocks and can effectively measure the internal physical and mechanical strength of rocks. The development of joint fractures is the main reason for the size effect of rocks. Therefore, exploring the influence of joint roughness on the elastic modulus of rocks of different sizes is of great significance in mining rock mechanics. The article investigates the size effect of joint roughness on elastic modulus of rocks by establishing simulation schemes for 30 working conditions. By analyzing the stress-strain curves of rocks with different roughness and sizes, the deformation and failure patterns of rocks with different sizes were obtained. Research has found that the elastic modulus of rocks is in a power function relationship with joint roughness, while the elastic modulus of rocks is negatively exponentially related to rock size; The characteristic elastic modulus of rocks is in a power function relationship with joint roughness. The above relationships not only reveal the variation of rock elastic modulus with size, but also reveal the influence of joint roughness on elastic modulus, providing important basis for understanding the stability of mining rock engineering.
1 Introduction
The elastic modulus (E) of rocks is an important performance parameter of mining slopes. From a macro perspective, the E is a scale that measures the ability of a rock to resist elastic deformation. The larger the value, the greater the stress at which the rock undergoes elastic deformation. As is well known, rocks have size effects due to the presence of joint cracks inside, and their E also has size effects, which are also influenced by joint cracks. Therefore, exploring the relationship between rock E and joint fractures, and obtaining its mechanism of variation with size, can provide beneficial assistance for analyzing the resistance of mining slopes to external force failure.
Scholars have conducted research on the analysis of E from aspects such as specimen size, strain rate, aspect ratio, and seepage. Xie et al. (Xie et al., 2018) used a reflective photo elastic instrument to record the color stripe changes of specimen failure and obtained the law that the E in the pre peak stage of fractured rock increases with the aspect ratio of the specimen. Ping et al. (Ping et al., 2018) investigated the dynamic E of 12 sizes of limestone specimens using a split Hopkinson pressure bar and obtained a trend of first increasing and then decreasing with the increase of rock specimen length. Liu et al. (Liu et al., 2018) explored the law of E of yellow sandstone at small scales and found that it shows an increasing trend with increasing size.
Lv et al. (Long long et al., 2018) used grey correlation theory to analyze the relationship between the aspect ratio and E of soft rock and found that when the aspect ratio of the sample is less than 1.2, the impact on strength is greater than the impact on deformation modulus. Zhang (Zhang et al., 2020) found through analyzing the damage evolution characteristics of rocks that as the height to diameter ratio of rocks increases, the E also increases. Meng et al. (Meng et al., 2018) used the random generation method to analyze the macroscopic elastic parameters of rocks and found that the E exhibited a significant effect of size variation. Ren et al. (Ren et al., 2021) established an equivalent model for fractured rock masses and obtained the relationship between E and seepage parameters. Zhang et al. (Zhang and Li, 2021) investigated the macroscopic mechanical behavior of 160 sets of soil rock mixtures with different sizes and discovered the variation of deformation modulus with rock size.
The above research analyzed the relationship between rock E and specimen size, strain rate, aspect ratio, seepage, using photo elastic instruments, Hopkinson pressure bar devices, grey correlation theory, numerical simulation, and laboratory testing, and obtained corresponding laws. However, the influence of joint fissures in rocks was not considered, and there is little analysis on whether there is a certain relationship between roughness and E.
Jointing is a major cause of controlling rock deformation and failure, affecting the difficulty of rock deformation, and roughness represents the degree of joint undulation. The influence of joints on E is mainly carried out through laboratory experiments or crack network models. Fu et al. (Fu et al., 2021) studied the effect of crack surface roughness on E and found that stress concentration caused by cracks reduces the E. Tian et al. (Tian et al., 2020) analyzed the influence of different inclination angles and joint roughness coefficients (JRC) on the E. Wang et al. (Wang et al., 2018) explored the compression characteristics of discrete crack network (DFN) models and rough fractured rock roughness discrete crack network (RDFN) models based on 3D printing technology, and found that the E of rocks containing prefabricated cracks was significantly lower than that of solid rock samples. Wang et al. (Wang et al., 2017) conducted a comparative study between the RDFN model and the traditional linear DFN model based on the roughness characteristics of rocks and found that the E of the DFN model was higher than that of the RDFN model. Gu et al. (Gu et al., 2023) provided a characterization method for obtaining roughness based on contour curves. The above research analyzed the influence of roughness or joint angle on E through laboratory tests or explored the influence of different crack models on E using crack network models. However, they rarely considered the influence of size on E, rarely consider the scale characteristics of engineering rock masses, and rarely obtain the relationship between E and roughness at different scales.
Representative Element Volume (REV) is a scale concept that represents the minimum representative volume of a rock when its size tends to stabilize. In the study of REV, scholars mostly use Monte Carlo methods. Liang et al. (Liang et al., 2019) introduced generalized RVE in their research and found that the E of rocks exhibits strong anisotropic characteristics. Wu et al. (Wu et al., 2019) studied the changes in E under different confining pressures based on the Monte Carlo method and determined the REV size to be 14° m × 14° m. Xu et al. (Xu et al., 2019) established a complex three-dimensional fracture network model using MATLAB and determined a rock mass REV of 25 m. Xia et al. (Xia et al., 2019) studied the effect of the dispersion of crack distribution on the REV of rock masses. Huang et al. (Huang et al., 2020) used the Geological Strength Index (GSI) to estimate the size of rock mass REV and analyzed its differences from traditional methods.
The above research mainly studied the REV of rocks through Monte Carlo methods or obtained the REV value through the dispersion degree of crack distribution and GSI index. The research mainly focuses on the REV of rocks, and the E is a property parameter of rocks. There is relatively little research on the relationship between the E and size, and it is also rare to analyze roughness as an influencing factor of size effect. Therefore, exploring the relationship between the two is a very meaningful thing.
This article uses numerical simulations to study the influence of size and JRC on E, establishes the relationship between rock E and JRC and size.
2 Numerical simulation plans
The research contents are carried out from two aspects. The first aspect is the influence of the size of rock with rough joints on the E, including programs 1–5. The rock sizes are 200 mm, 400 mm, 600 mm, 800 mm, 1,000 mm, and 1,200 mm, respectively. The second aspect is the size effect of JRC on E, including programs 6–11, and the corresponding JRC values are 1.6, 2.6, 3.6, 4.6 and 5.6. The numerical simulation programs are show in Table 1.
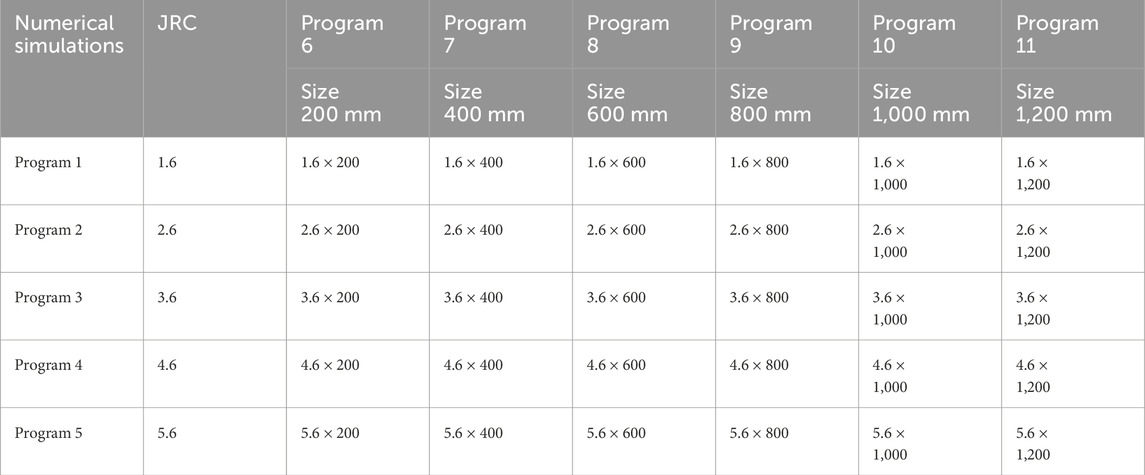
Table 1. The numerical simulation programs.
A total of 30 2D numerical simulation models have been established in this paper. The constraint condition used in simulations are that the two sides of the model are free surfaces without force, and the upper and lower surfaces of the model bear loads. The displacement load was applied on the model, and the loading amount is 0.01 mm. The numerical models are shown in Figure 1. The mechanical parameters used in the model are shown in Table 2 (Hu et al., 2021).
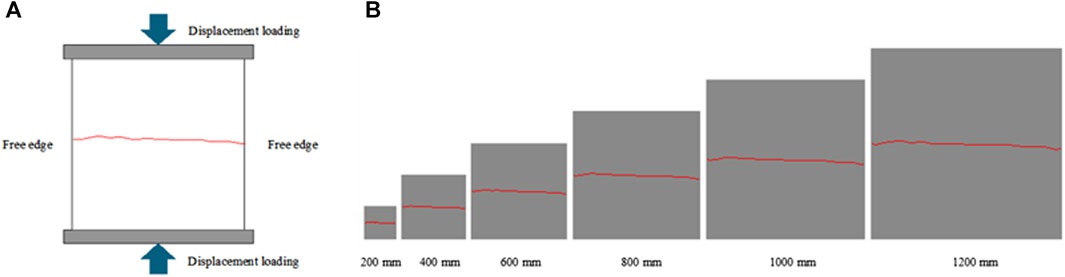
Figure 1. The numerical models. (A)loading method, (B)six size models.
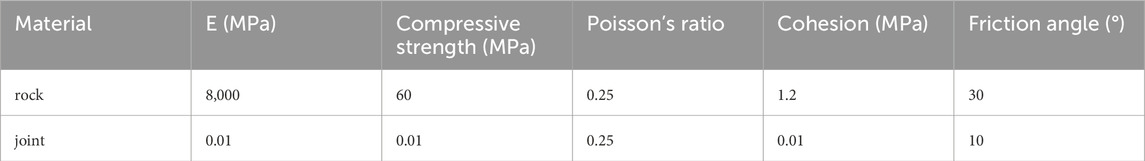
Table 2. The Mechanical parameters of rock.
The software used in this article is RFPA software, which is based on the finite element method during the solving process. The modified Coulomb failure criterion is used as the analysis criterion for medium deformation and failure. JRC represents the degree of undulation of the structural plane. The process of obtaining JRC is as follows: first, the contour curve of the rock structural plane on the mine slope is drawn using a contour curve instrument, and then the data extraction of the contour curve is carried out using a scanner and MATLAB software and converted into CAD curves. Then import the CAD curves into RFPA software and assign corresponding parameters, and finally conduct simulation research. In the implementation process of the numerical scheme, different JRC values are first obtained, and then models of different sizes are established in RFPA software. The JRC curves are imported into RFPA software for numerical simulation research.
3 Numerical simulation results
3.1 The influence of the size on E
This section analyzes the stress-strain curves and obtains the variation laws of E with rock sized and establishes a fitting method for the relationship between E and rock size, obtaining its relationship formula.
The stress-strain curve can reflect the deformation process of brittleness, plasticity, yield, and fracture of rock under external force. Therefore, first, according to the first research content, the influence of size on E was studied, and the corresponding stress-strain curve were draw, as shown in Figure 2. Then the area of elastic deformation on the curves were selected and its slope were calculated to obtain the E value, as shown in Table 3.
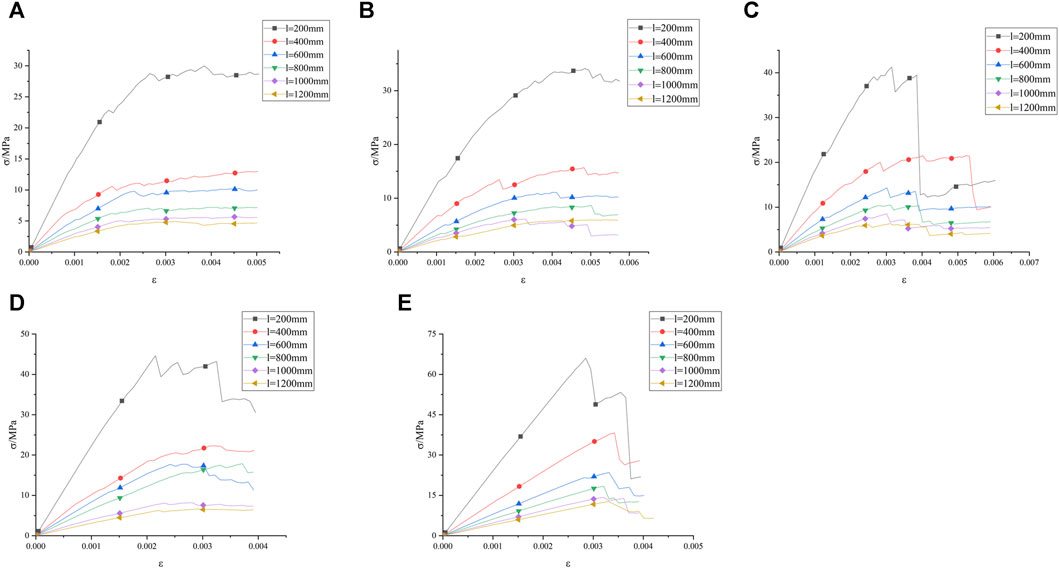
Figure 2. Stress-strain curves of different size rocks. (A) JRC = 1.6, (B) JRC = 2.6, (C) JRC = 3.6, (D) JRC = 4.6, (E) JRC = 5.6.
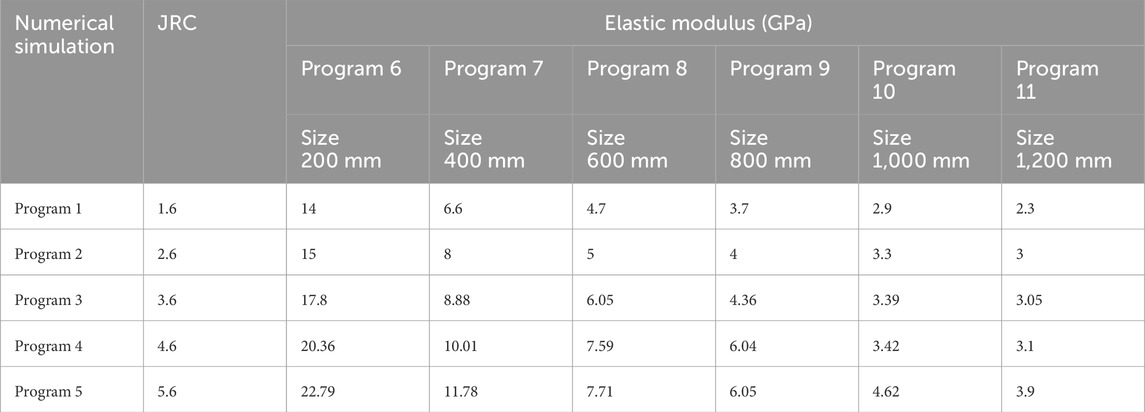
Table 3. Elastic modulus.
Figure 2 shows that when the roughness changes, the stress-strain curves of the rock still follow similar patterns. Therefore, we will analyze a curve as an example. In Figure 2E, for rocks of different sizes, when the strain are less than 0.002, the stress-strain curves are in the linear elastic stage, during which the rock exhibits certain plastic characteristics; When the strain increase to 0.003, the stress-strain curves gradually change from linear to curved, and the rock is in the yield stage; When the strain are in the range of 0.003–0.004, rocks of different sizes reach the peak stress strength and enter the failure stage, after which the rock will gradually lose its bearing capacity.
Analyze the size effect on E through Figure 2A. When the rock size increases from 200 mm to 1,200 mm, the slopes of the stress-strain curve show decreasing trends, and the E decreases from 14 GPa to 2.3 GPa, with a decrease of 83.5%. This indicates that as the rock size increases, the E of the rock gradually decreases, showing a negative correlation.
The above analysis show that E is negatively correlated with rock size. To get a more intuitive analysis result, their scatter plots are drawn, and the relationship curves are regressed based on the data in Table 3, as shown in Figure 3.
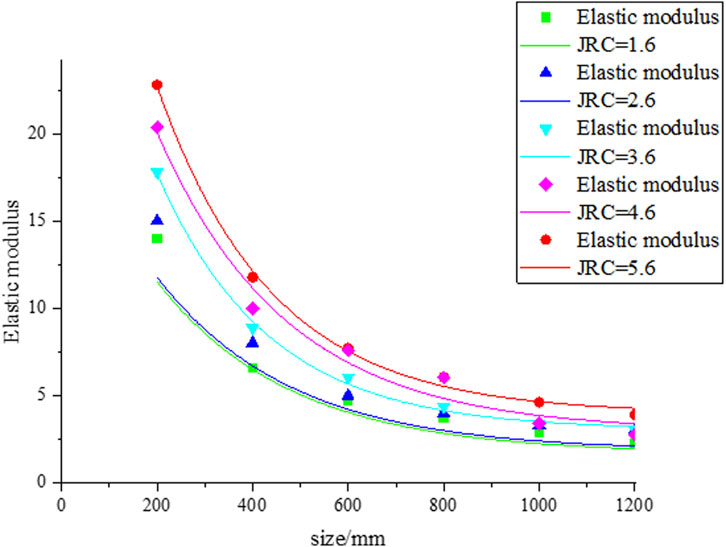
Figure 3. Fitting curves of E and size.
Figure 3 reflects the relationship between rock E and size, which is negatively correlated. The larger the roughness coefficient is, the higher the curve is, indicating that the roughness also has a certain impact on the curve. The relationship of each curve is regressed, as shown in Eqs 1–5.
By analyzing the curve types in Eqs 1–5, they are all in negative exponential form, which indicates that there may be a negative exponential relationship between the E and rock size. Therefore, the following relations are proposed:
In the formula: l is the rock size, unit: mm; a, b, and c are constant.
Eq. 6 contains the unknown parameters a, b and c that need to be calculated. Therefore, for a rock, the E of rock under any size can be calculated after the parameters a, b and c are solved.
Analyzing the curves form in Eqs 1–5, we can find that the values of a, b and c are related to the JRC and will change with it. Therefore, we fitted their relationship curves, as shown in Figure 4.
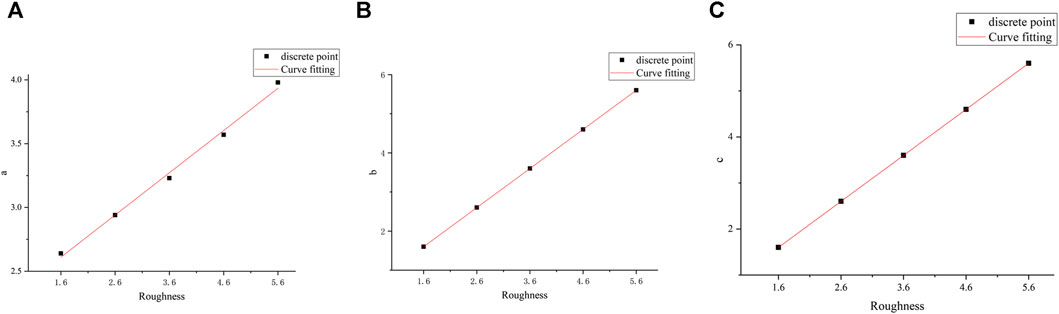
Figure 4. Fitting curve of parameter and JRC. A (A), B (B), C (C).
The curve in Figure 4 shows that a, b, and c are linear with the roughness and will increase with the increase of roughness. Therefore, the relationship between a, b, and c are as follows:
Equations. 7–9 give the linear relationship between parameters and roughness. Therefore, we only need to bring these relationships into Eq. 6 to obtain the following special relationship:
Eq. 10 defines a special relationship between the E and size, which can be used to solve the E of a given rock. For a specific rock, its roughness is known, so it is only necessary to give its size, which can immediately calculate the E through this relationship. It has important engineering application value.
3.2 The size effect of JRC on E
This section establishes a fitting method for the relationship between E and JRC by studying the variation law of E with JRC and obtains their relationship formula.
The discontinuity surface controls the strength of rock. On the one hand, it has size effect, and on the other hand, it is caused by different roughness undulations on the discontinuity surface. This section mainly explores the size effect of roughness on rock E. Therefore, first, the influence of roughness on E was studied, and the corresponding stress-strain curves were draw, as shown in Figure 5.
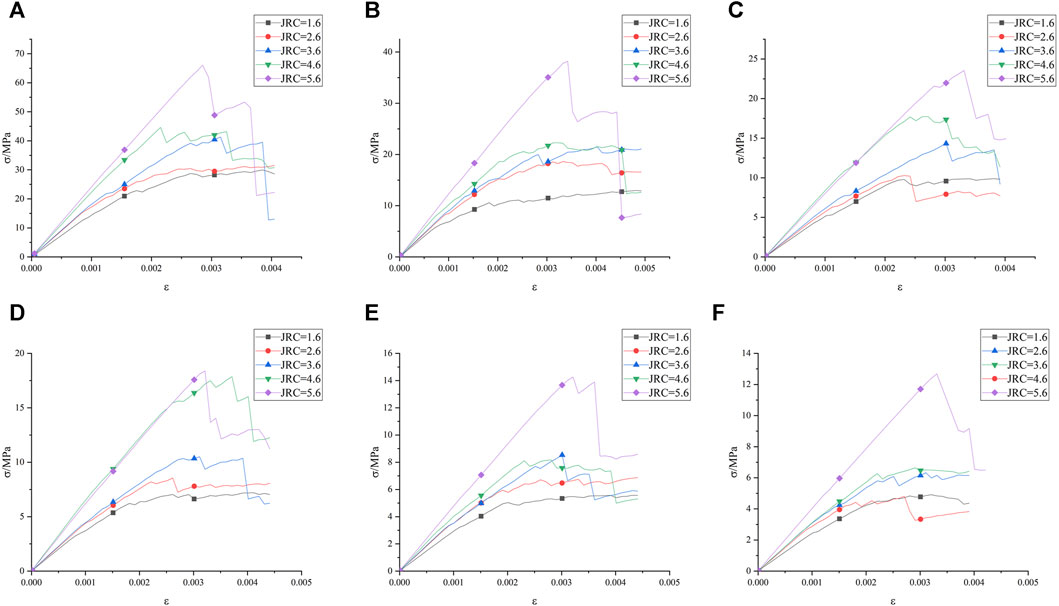
Figure 5. Stress strain curves. (A) 200 mm, (B) 400 mm, (C) 600 mm, (D) 800 mm, (E) 1000 mm, (F) 1200 mm.
Figure 5 reflects the variation of stress-strain with roughness for different sizes. In Figure 5B, the size of the rock is 400 mm, and when the strain is within 0.002, the rock is in the linear elastic stage; When the strain exceeds 0.003, the rock gradually enters the yield failure stage. In this figure, as the roughness increases from 1.6 to 5.6, the E increases from 6.6 GPa to 11.78 GPa, with a growth rate of 78%, indicating that the E value gradually increases with the increase of roughness. When the roughness is 5.6 and the rock size increases from 200 mm to 1,200 mm, the E decreases from 22.79 GPa to 3.9 GPa, with a decrease of 83%. It indicates that when the roughness is a constant, the E decreases with the size.
The above analysis shows that E is positively correlated with the JRC, which will increase with the increase of roughness. To obtain more intuitive analysis results, their scatter plots are drawn, and the relationship curves are regressed based on the data in Table 1, as shown in Figure 6.
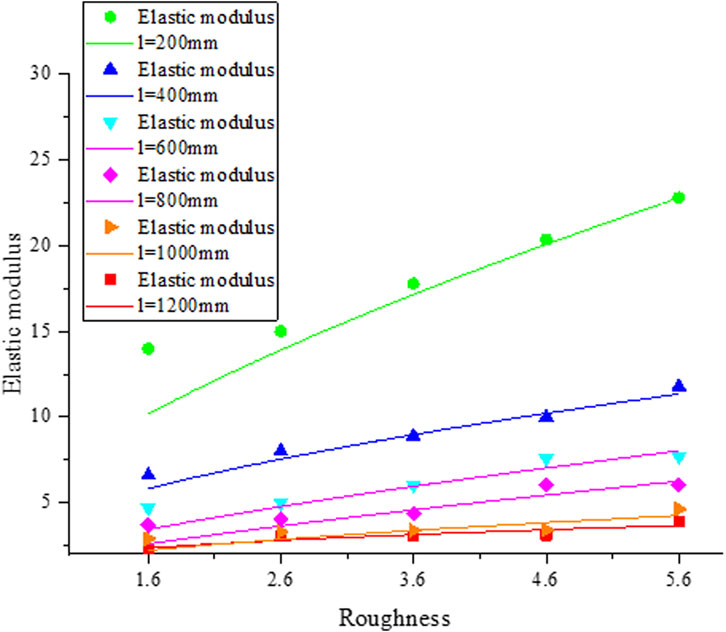
Figure 6. Fitting curves of E and roughness.
Figure 6 shows the relationship between E and JRC, which is positively correlated. The larger the rock size is, the lower the curve is, indicating that the size has a certain influence on the curve. To better analyze the relationship between them, the curve is regressed in Eqs. 11-16.
Analyzing the curve types in Eqs. 11-16, they are all in power function form, which indicates that there may be a power function relationship between the E and JRC. Therefore, the following relations are proposed:
where d and f are constant.
Eq. 17 contains the unknown parameters d and f that need to be calculated. Therefore, for a rock, the E under any JRC can be calculated after the parameters d and f are solved.
Analyzing the curves form in Eqs°11-16 we can find that the values of d and f are related to the size and will change with it. Therefore, we fitted their relationship curves in Figure 7.

Figure 7. Fitting curve of parameter. (A) d, (B) f.
The curves in Figure 7 shows that the parameter d is a power function of rock size and decreases with the increase of it. The parameter f has a linear relationship with rock size and will decrease with the increase of it. Therefore, the relationship of d and f are as follows:
Eqs. 18, 19 give the linear relationship between parameters and JRC. Therefore, we only need to bring these relationships into Eq. 17 to obtain the following special relationship between rock E and JRC:
Eq. 20 defines a special relationship between the E and JRC, which can be used to solve the E of a given rock. For a specific rock, its rock size is known, so it is only necessary to give its JRC, which can immediately calculate the E through this relationship.
3.3 Relationship between CEM and JRC
This section obtains the CEM by solving the characteristic size and establishes the relationship between the CEM and JRC.
As a physical and mechanical property of rocks, the E varies with rock type, composition, and JRC. For example, rocks with obvious bedding planes have a higher E perpendicular to the bedding plane than parallel planes. There is also a characteristic size for the E, and when it exceeds this size, the E value tends to stabilize.
Due to the presence of defects such as joints and fissures in rocks, the heterogeneity of the rocks results in different parameters for rocks of different sizes, but ultimately there is a characteristic size that tends to stabilize the rock properties parameters. Reference (Liang et al., 2013) provides a method for solving the characteristic size. Based on reference (Liang et al., 2013), the derivative of formula (6) in the article can obtain the characteristic size value of the rock.
In equations, r is the absolute value of the slope when the curve approaches the horizontal, and l is the characteristic size.
According to formula (23), we calculate the characteristic size values for each roughness, as shown in Table 4. When the roughness increases from 1.6 to 5.6, the corresponding characteristic size values are 205.03 mm, 215.28 mm, 240.51 mm, 262.57 mm, and 293.83 mm, respectively. The characteristic size shows a significant increasing trend with the increase of roughness value.
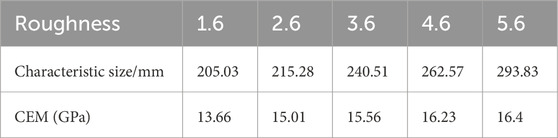
Table 4. Relationship between characteristic size, CEM and JRC.
At the same time, we also solved the E of the rock under the characteristic size, which we call the characteristic elastic modulus (CEM), which is also listed in Table 4. As the roughness increases, the CEM of the rock increases from 13.66 GPa to 16.4 GPa, indicating a significant increasing trend with the increase of roughness value. To better reflect this change, the content in Table 4 were plotted as shown in Figure 8.
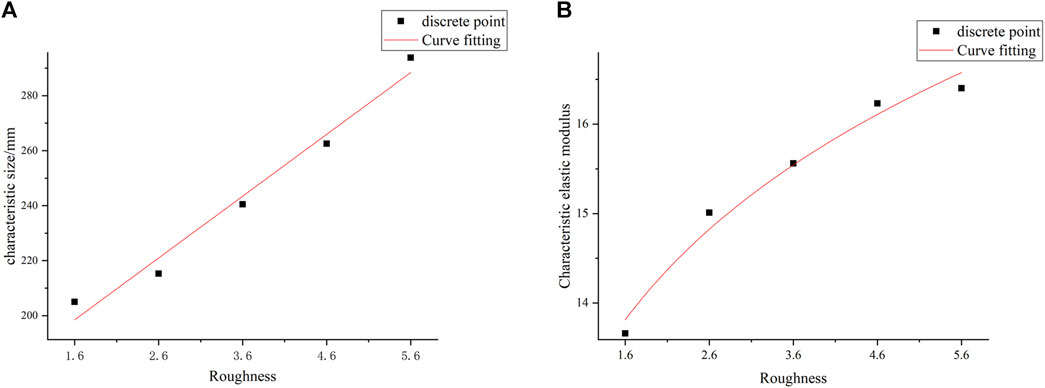
Figure 8. Fitting curve. (A) Characteristic size and JRC, (B) CEM and JRC.
Figure 8A shows that there is a clear linear relationship between the CEM and roughness, and the linear correlation is very well. The relationship between them is shown below.
Figure 8B shows that the CEM and roughness of rocks exhibit a clear power function relationship, and the relationship between them is shown below.
3.4 Analysis of the fluctuation coefficient of the E
This section explores the relationship between the fluctuation coefficient and JRC by solving the fluctuation coefficient of elastic modulus and analyzes the size effect of the fluctuation coefficient.
The fluctuation coefficient of rocks reflects the changes in the internal structure and physical properties of rocks. Reference (Wu, 2020) provides a calculation formula for the fluctuation coefficient of rock E.
In the formula, Ei is the fluctuation coefficient of the E; El is the E value when the model size is l, unit: GPa;
The fluctuation coefficient of the E was calculated in Table 5. The variation pattern of the fluctuation coefficient with size and JRC were draw in Figure 15.
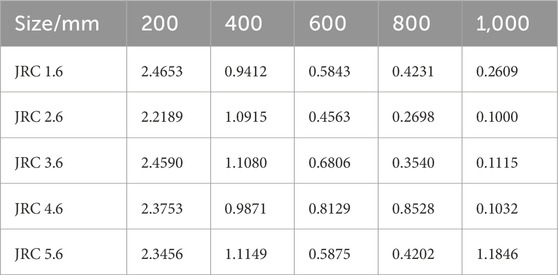
Table 5. Fluctuation coefficient of E.
As shown in Figure 9A, the fluctuation coefficient of E changes with size variation. When the size of the rock increases from 200 mm to 1,000 mm, the fluctuation coefficient decreases from 2.4653, 2.2189, 2.4590, 2.3753, and 2.3456 to 0.2609, 0.1, 0.1115, 0.1032, and 0.1846. Therefore, we can conclude that as the size of the sample increases, the fluctuation coefficient decreases continuously, with a decrease of more than 200%; And when the size reaches 1,000 mm, the fluctuation coefficient is less than 0.3, indicating that the stability of the E value is high after reaching this size. As shown in Figure 9B, we can be seen that as JRC increases, the fluctuation coefficient does not change much. Therefore, the influence of JRC on the fluctuation coefficient is smaller than that of size.
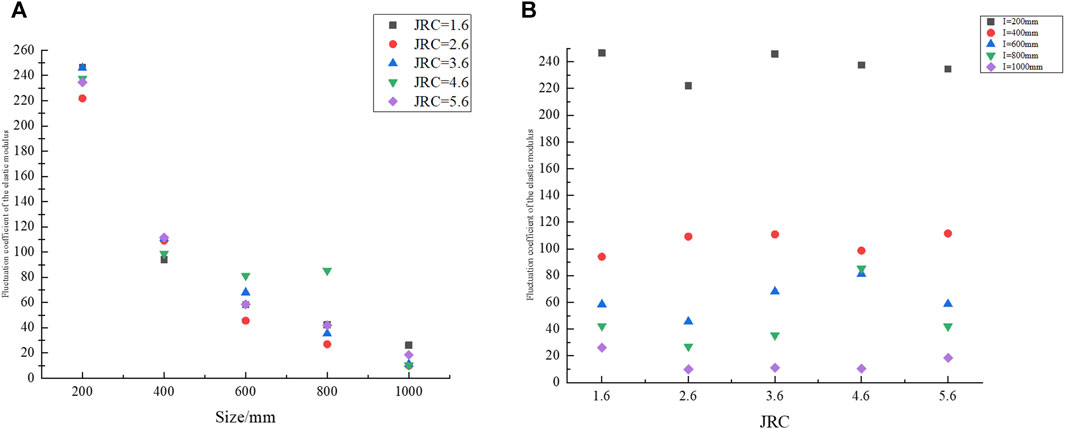
Figure 9. Variation law of fluctuation coefficient. (A) Size, (B) JRC.
3.5 Verification analysis
Formula (17) provides a relationship between rock E and JRC, but the accuracy still needs to be verified. Reference (Chen, 2022) studied the UCS of rock samples with different roughness. In this validation analysis, Figure 22 (a) on page 41 of reference (Chen, 2022) was cited, which shows the stress-strain curves with roughness of 0, 5, 10, 15, and 20, as shown in Figure 10A. According to this curve, the E values were calculated to be 3.49 GPa, 3.5 GPa, 3.54 GPa, 3.55 GPa, and 3.57 GPa, respectively, and the relationship curve between E and roughness was draw in Figure 10B.
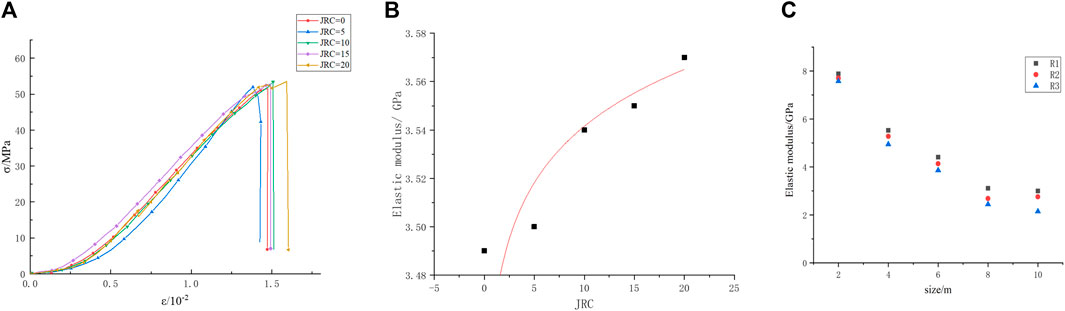
Figure 10. Verification diagram (A) Stress-strain curves, (B) Fitting curves of E and JRC, (C) E with different sizes.
The fitting coefficient R2 of the curve in Figure 10B is 0.9554, indicating a very good degree of fitting. The relationship between E and JRC can be regressed from Figure 10B, as shown in formula (27):
Eq. 27 is in the form of a power function, and the function type is consistent with Equation 17. Whether through numerical simulation or laboratory tests, the regression curves of E and roughness are consistent in power function form, which verifies the reliability of the relationship obtained in this paper.
The following content is used to verify the accuracy of Equation 6. Wang (Wang, 2016) (Page 33–48) used numerical simulations to investigate the effect of joint friction on the strength of rock masses with different rock mass sizes (2 m, 4 m, 6 m, 8 m, and 10 m) and roughness (R1, R2, and R3), and obtained the elastic modulus values, as shown in Figure 10C.
According to Figure 10C, we have solved the fitting curves for R1, R2, and R3, where the fitting coefficients R2 are 0.984, 0.973, and 0.985, respectively. The formula is as follows:
From formulas (28-30), their function types are consistent with formula (6), which verifies the accuracy of formula (6).
4 Discussion
There is a relationship between the E of rocks and their size, and previous studies have mostly provided a qualitative relationship between the E and size. For example, Ping et al. (Ping et al., 2018), Liu et al. (Liu et al., 2018), and Zhang (Zhang et al., 2020) found that E increases with the increase of size but did not provide a quantitative relationship between them. This article found a negative exponential relationship between the E and size through research and provided a special form of quantitative solution for the relationship. The acquisition of this relationship quantifies the solution of E, which is of great significance for the solution of E in engineering sites.
There is also a relationship between the E and JRC. Previous studies have mainly focused on the influence of roughness on the E, such as in references (Fu et al., 2021; Tian et al., 2020), with little consideration given to the influence of size effects. Considering size effects, this article establishes the relationship between rock E and JRC and provides a quantitative solution method for them. At the same time, we also verified the applicability of this formula by referring to literature data.
5 Conclusion
The article conducted research on the E of rocks containing rough joints and analyzed the influence of size, and obtained the following conclusions:
(1) The relationship between the E and size of rocks containing rough joints is
through the analysis and solution of parameters a, b, and c, we have obtained their specific formulas as follows:
(2) The relationship between the E and JRC is
By analyzing and solving the parameters d and f, we have obtained their specific formulas as follows:
(3) The characteristic size of E is related to JRC, and our analysis obtained the following relationship:
(4) The CEM and JRC exhibit a power function relationship, and our analysis obtained the following:
Data availability statement
The original contributions presented in the study are included in the article/Supplementary Material, further inquiries can be directed to the corresponding author.
Author contributions
GH: Conceptualization, Data curation, Writing–original draft, Writing–review and editing, Funding acquisition. BW: Data curation, Investigation, Writing–review and editing. WG: Methodology, Conceptualization, Writing–review and editing. YX: Methodology, Formal analysis, Writing–review and editing. JZ: Data curation, Funding acquisition, Writing–review and editing, Investigation. LZ: Investigation, Methodology, Writing–review and editing. SM: Formal Analysis, Methodology, Writing–review and editing.
Funding
The author(s) declare that financial support was received for the research, authorship, and/or publication of this article. This work was supported by National Post-Doctor Regulatory Commission (No.348311), the Scientific Research Fund of Liaoning Provincial Education Department (No. LJ2020JCL037). International Scientific and Technological Cooperation Base for Geological Disaster Prevention of Zhejiang Province (IBGDP-2022-05), Key Laboratory of Rock Mechanics and Geohazards of Zhejiang Province (ZGRMG-2019-07).
Conflict of interest
Author BW was employed by Zhejiang Institute of Mechanical & Electrical Engineering Co., Ltd.
Author YX was employed by Huahui Engineering Design Group Co Ltd.
The remaining authors declare that the research was conducted in the absence of any commercial or financial relationships that could be construed as a potential conflict of interest.
Publisher’s note
All claims expressed in this article are solely those of the authors and do not necessarily represent those of their affiliated organizations, or those of the publisher, the editors and the reviewers. Any product that may be evaluated in this article, or claim that may be made by its manufacturer, is not guaranteed or endorsed by the publisher.
References
Chen, C. (2022). Experimental study on static and dynamic mechanical properties of rough jointed rock specimens based on 3Dprinting. Huainan, China: AnHui University of Science and Technology.
Fu, B. Y., Fu, L. Y., Han, T., and Cao, C. (2021). Roughness effects of crack surfaces on the elastic moduli of cracked rocks. Front. Earth Sci. 9, 626903. doi:10.3389/feart.2021.626903
Gu, Y., Rui, Y., Shen, W., Du, S., Jian, J., and Liu, S. (2023). 3D roughness obtaining method of rock joint based on profile measurement. Rock Soil Mech. 44 (201), 485–494.
Hu, G., Li, Y., and Ma, G. (2021). Research on the size effect of roughness on rock uniaxial compressive strength and characteristic strength. Sci. Eng. Compos. Mater. 28 (1), 613–627. doi:10.1515/secm-2021-0058
Huang, H., Shen, J., Chen, Q., and Karakus, M. (2020). Estimation of REV for fractured rock masses based on Geological Strength Index. Int. J. Rock Mech. Min. Sci. 126, 104179. doi:10.1016/j.ijrmms.2019.104179
Liang, Z., Wu, N., Li, Y., and Li, H. (2019). Numerical study on anisotropy of the representative elementary volume of strength and deformability of jointed rock masses. Rock Mech. Rock Eng. 52 (3), 4387–4402. doi:10.1007/s00603-019-01859-9
Liang, Z., Zhang, Y., Tang, S., Li, L., and Tang, C. (2013). Size effect of rock messes and associated representative element properties. Chin. J. Rock Mech. Eng. 32 (06), 1157–1166.
Liu, G., Xiao, F., and Qin, T. (2018). Rock mechanics characteristics and acoustic emission rule under small-size effect. Chin. J. Rock Mech. Eng. 37, 3905–3917.
Long long, L., Li, S., Liao, H., Hangzhou, L., and Tianyu, Z. (2018). Size effect study of red soft rock based on grey relating analysis theory. Chin. J. Undergr. Space Eng. 14 (06), 1571–1576+1602.
Meng, Q. X., Wang, H. L., Xu, W. Y., and Cai, M. (2018). A numerical homogenization study of the elastic property of a soil-rock mixture using random mesostructure generation. Comput. Geotechnics 98, 48–57. doi:10.1016/j.compgeo.2018.01.015
Ping, Q., Zhang, H., and Su, H. (2018). Study on dynamic compression mechanical properties of limestone with different lengths. Chin. J. Rock Mech. Eng. 37 (S2), 3891–3897.
Ren, F., Zhang, J., Ouyang, Z., and Hu, H. (2021). Calculation of elastic modulus for fractured rock mass using dimensional analysis coupled with numerical simulation. Math. Problems Eng. 2021 (Z1), 1–14. doi:10.1155/2021/2803837
Tian, W. L., Yang, S. Q., Hu, Z. L., and Lu, J. W. (2020). Experimental study of the mechanical behavior of unfilled rough jointed specimens under uniaxial compression. Arabian J. Geosciences 13 (4), 164. doi:10.1007/s12517-020-5159-5
Wang, P., Liu, Y., Zhang, L., Zhengjun, H., and Meifeng, C. (2018). Preliminary experimental study on uniaxial compressive properties of 3D printed fractured rock models. Chin. J. Rock Mech. Eng. 37 (2), 364–373.
Wang, P. T., Ren, F. H., Tan, W. H., Yan, Z. X., Cai, M. F., and Yang, T. H. (2017). Model of roughness discrete fractures network for uniaxial compressive test and its mechanical properties. Rock Soil Mech. 38, 70–78.
Wang, Z. (2016). Numerical simulation on deformation and strength characteristics of rock mass considering the joint surface friction. Boston, MA, United States: Northeastern University.
Wu, Na (2020). Study on the scale effect and anisotropy of mechanical properties of jointed rock masses. Dalian, Liaoning, China: Dalian University of Technology.
Wu, N., Liang, Z. Z., Li, Y. C., Li, H., and Zhang, M. l. (2019). Stress-dependent anisotropy index of strength and deformability of jointed rock mass: insights from a numerical study. Bull. Eng. Geol. Environ. 78, 5905–5917. doi:10.1007/s10064-019-01483-5
Xia, L., Xie, J., and Qingchun, Y. U. (2019). Influence of statistical distribution dispersion in the fracture size on blockiness REV of fractured rock masses. Hydrogeology Eng. Geol.,
Xie, C., Li, S., Qin, Y., Li, J., and Zhao, S. (2018). Photoelastic experiments on failure characteristics of fractured rock with different sizes. Chin. J. Geotechnical Eng. 40 (03), 568–575.
Xu, W., Zhang, Y., Li, X., Wang, X., and Zhang, P. (2019). Study on three-dimensional fracture network connectivity path of rock mass and seepage characteristics based on equivalent pipe network. Environ. Earth Sci. 78 (16), 516–521. doi:10.1007/s12665-019-8505-8
Zhang, H., Zhang, X., and Zhou, H. (2020). Research on acoustic emission characteristics and constitutive model of rock damage evolution with different sizes. Adv. Civ. Eng. 2020 (16), 1–8. doi:10.1155/2020/6660595
Keywords: rough joints, characteristic size, size effect, elastic modulus, numerical simulation, rock
Citation: Hu G, Wang B, Guo W, Xing Y, Zhou J, Zha L and Meng S (2024) Study on the size effect of rock elastic modulus considering the influence of joint roughness. Front. Mater. 11:1367006. doi: 10.3389/fmats.2024.1367006
Received: 08 January 2024; Accepted: 19 February 2024;
Published: 18 April 2024.
Edited by:
Andrey Jivkov, The University of Manchester, United KingdomReviewed by:
Sonia Mariel Vrech, Universidad Nacional de Tucumán, ArgentinaYun Gao, Southeast University, China
Copyright © 2024 Hu, Wang, Guo, Xing, Zhou, Zha and Meng. This is an open-access article distributed under the terms of the Creative Commons Attribution License (CC BY). The use, distribution or reproduction in other forums is permitted, provided the original author(s) and the copyright owner(s) are credited and that the original publication in this journal is cited, in accordance with accepted academic practice. No use, distribution or reproduction is permitted which does not comply with these terms.
*Correspondence: Wenbing Guo, wen12123@yeah.net