 Tyler C. Salrin
 Caio B. Bragatto
 Collin J. Wilkinson
94% of researchers rate our articles as excellent or good
Learn more about the work of our research integrity team to safeguard the quality of each article we publish.
Find out more
ORIGINAL RESEARCH article
Front. Mater., 10 May 2024
Sec. Ceramics and Glass
Volume 11 - 2024 | https://doi.org/10.3389/fmats.2024.1365747
Ionic transport is a critical property for the glass industry, since emerging applications such as sensors, batteries, and electric melting are based on the phenomenon. Short-range interactions (anion-charge carrier) have not been able to explain the total activation barrier observed experimentally, and, as such, it is critical to understand the larger role of all ions in a glass, not just the carrier and the ‘site’ ions. This research focuses on the role of network formers and their impact on diffusion in glasses, something that current models lack an explicit explanation of. Atomistic simulations with randomly generated parameters for the cation potentials and classical simulations were used to determine the diffusion coefficients and activation energies for synthetic network formers. Using this database, explainable machine learning algorithms were employed to explore network former interactions and determine which parameters are the most influential for ion diffusion. Results suggest that the bond length of the cations changes the geometry of the structure contributing the greatest to cation-modifier interactions.
Diffusion in glasses is a fundamental phenomenon that is critical to areas ranging from batteries and glass manufacturing to ionic membranes and electrochemical sensors (Bragatto, 2020; Du and Cormack, 2022). Ionic conductivity, was first investigated in glasses by Emil Warburg in 1884 who confirmed Faraday’s law through the transportation of sodium ions across a thin window glass (Warburg, 1884). One of the prominent advantages of ionic conductive glasses compared to crystalline materials lies in their near unity ionic transport number. This implies that they predominantly conduct electricity through the movement of ions, significantly reducing the risk of potential short-circuits in applications like batteries. Typically, highly ionic conductive oxide glasses consist of monovalent cations such as alkali metals introduced to the glass as salts or oxides. The conductivity of these glasses is heavily influenced by the type and concentration of the cations, as well as the network former employed (Varshneya and Mauro, 2019; Bragatto, 2020).
Ionic conductivity can be related back to diffusion through Einstein’s relation for Brownian motion with a electrical force due to the cations. Furthermore, diffusion in glasses happens through a hopping mechanism that is not dependent on previous steps, characteristic of Markovian processes (Geyer, 1992; Mauro, 2021). The hopping sites are usually defined by non-bridging oxygens and the spatial variation thereof. Though these sites are spatially varied, the distance of the jump only linearly affects the diffusivity, while macroscopically the diffusivity is scaling exponentially with temperature as described by the Arrhenius equation (Geyer, 1992; Mauro, 2021). The exponential dependence on the activation energy makes this parameter critical to understanding ion diffusion in complex glasses.
Some ionic conductivity models suggest that this exponential nature arises due to the energy required to dissociate the ion from the anion and move the ion to the next site (Charles, 1961; Ravaine and Souquet, 1978; Martin, 1991; Bragatto, 2020). As a result, these models suggest that the greatest effect on conductivity comes from the interactions between anion-mobile species for a glass consisting of a mobile species (modifiers), an anion (typically oxygen), and formers of cation networks. Although qualitatively the largest interactions come from the anion, it is not the only effect. If only the anion-modifier interactions contributed, then the activation barrier should not have a large variation, which is in direct contrast to what is experimentally observed (Martin, 1991).
Cation-modifier interactions remain largely abstracted away in modern ionic conductivity models through the inclusion of macroscopic properties to describe microscopic activation barriers. The lack of an analytically predictive activation barrier model and the recent increase in solid-state battery research have created a drive to understand the origin of ionic diffusion in glasses. Recent molecular dynamics work has helped to elucidate the origin of the barriers, but the explicit role of the cation on the activation barrier has remained largely undiscovered (Welch et al., 2019; Wilkinson et al., 2020). The anion-charge carrier interactions dominate the diffusivity, but the role of the cations cannot be ignored. This has been particularly emphasized in the battery literature, where the charge carrier-anion is generally the same (lithium-sulfur/lithium-oxygen), but the activation barrier changes widely based on the network former chosen for the system (Wild et al., 2015; Zhao M. et al., 2020).
Current models for ionic conductivity in glasses generally fall into either strong or weak electrolyte models. The first strong electrolyte model, proposed by Anderson and Stuart in 1954 (Anderson and Stuart, 1954), defines two activation energies, one accounting for the energy required for the charge carrier to break free from its current site and another to account for the energy needed to distort the network (Anderson and Stuart, 1954; Bragatto, 2020). Another strong electrolyte model developed by Charles in 1961 describes the charge carrier as an interstitial defect where two cations (i.e., the former network and charge-carrier) share a nonbridging oxygen (Charles, 1961). In each of these strong electrolyte models, the cation effects are included in an effective ‘Madelung’ constant and the shear modulus of the material, but this does not illustrate the local pathways (Anderson and Stuart, 1954; Charles, 1961; Martin et al., 2019; Bragatto, 2020).
Conversely the weak electrolyte model proposed by Ravaine and Souquet in 1977 is based on the similarities between aqueous and glassy electrochemistry (Ravaine and Souquet, 1978; Ravaine, 1980; Bragatto, 2020). In this model the equilibrium constant of dissolution can be used to determine an activation energy in which the role of cations is generalized (Ravaine and Souquet, 1978; Ravaine, 1980; Martin, 1991; Bragatto, 2020). While each of these models has strengths and weaknesses in describing ionic conductivity in glasses, a major drawback in each of these models is that the role of the network former is abstracted. This limitation hinders a detailed understanding of the network former’s role, crucial for a wholistic understanding of diffusion processes.
Due to the heighted interest in the fundamental origins of ionic conductivity, atomistic simulations of ion conductors are becoming a routine part of the literature (Welch et al., 2019; Wilkinson et al., 2020; Du and Cormack, 2022; Salrin et al., 2023). Of these simulations, molecular dynamics is particularly powerful. In molecular dynamics simulations, an interatomic potential describes the energy of the system and is used to compute the forces acting on each ion. The dynamics of the system can then be predicted through temporal integration. This means that an ion is uniquely defined through its potential and mass. There are many common potential forms, however classical two-body potentials offer the simplest description of the energies. These potentials are often used for modeling oxide glasses because of their ability to retain accuracy when cation-cation interactions are omitted. This leads to a simplified model, where only the cation-oxygen and oxygen-oxygen interactions must be defined. This approach has shown great success in modeling the transport and mechanical properties of oxide glasses (Welch et al., 2019; Atila et al., 2020; Zhao Y. et al., 2020; Salrin et al., 2023).
Understanding the physical processes controlling diffusion would enable new insights into the materials for emerging electrochemical applications. It is the goal of this work to draw conclusions about the influence of the interatomic potentials on the diffusion of alkali ions using explainable machine learning algorithms to gain a better understanding of the physical principles governing diffusion in oxide materials. Herein the focus is on glasses with fixed anion-charge carrier interaction while changing the network former cation potentials. Exploring the role of the network former potentials on the ionic diffusivity involves randomly creating network former potentials and subsequent measurements of the diffusivity. The results are used to train an interpretable machine learning algorithm. From this interpretable machine learning, conclusions are drawn on the role of network formers on ionic diffusivity.
The interatomic potentials defined by Pedone et al. provided a starting point for the simulations presented here (Pedone et al., 2006). This potential has become a staple of atomistic glass research, as it provides a self-consistent force field for a wide selection of oxide components with the goal of being able to reproduce the structure and mechanical properties of these oxide glass systems (Welch et al., 2022; Salrin et al., 2023; Welch et al., 2023). This force field takes the form of Morse potential with an added Coulombic term,
Here, rij is the distance between the atoms i and j, Zi and Zj are the effective partial charges of atom i and j, respectively, e is the elementary charge, Dij describes the bond dissociation energy, Aij is a function of the slope of the potential energy well, r0 represents the equilibrium bond distance between atom i and j, and Cij corresponds to Van der Waals interactions. Throughout this work, Cij is set to 1 eV which is a reasonable approximation as this term only provides the repulsive contribution of the potential at short distances, and the value is constant for most of the cation-oxygen interactions in the original work. The variance in the cation-oxygen interactions is defined through the Coulombic and Morse terms.
For each potential, the parameters Zi, Dij, Aij, r0, and the percentage of modifiers (x) were randomly generated. This curve was then compared with the bounds of the network former regime, as depicted in Figure 1. These bounds are determined by the absolute minimum and maximum values of known network-forming potentials given by Pedone (Pedone et al., 2006). If the energy of the generated potential remains between the bounds of this network former regime, it was kept and used; otherwise, it was discarded, and a new potential would be generated. Additionally, when looking at the table of potential values defined by Pedone, there are specific ranges over which network former parameters exist (Pedone et al., 2006). This information was used to determine bounds for the random generation of each parameter, which are shown in Table 1.
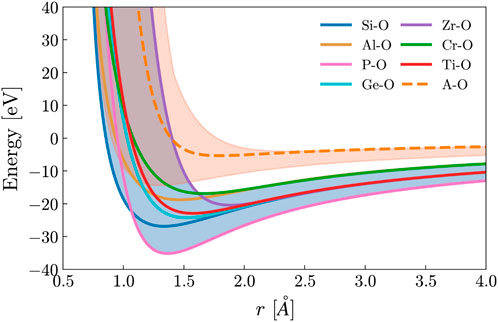
Figure 1. The interatomic potential for some common network former-oxygen and the modifier-oxygen interaction used throughout this work, and the defined modifier and network former regime. The randomly generated network former potential has the criteria of falling into the blue network former regime. The modifier regime (A Regime) calculated from Pedone is shown in orange, and the orange dashed line is the potential of the modifier used in this work.
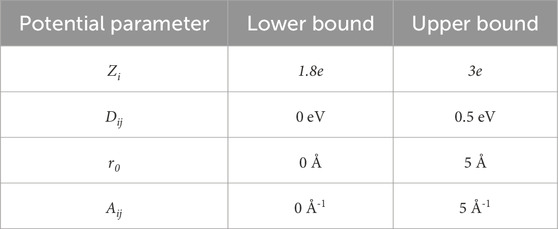
Table 1. The bounds of the randomly generated potentials based on values given by Pedone (Pedone et al., 2006).
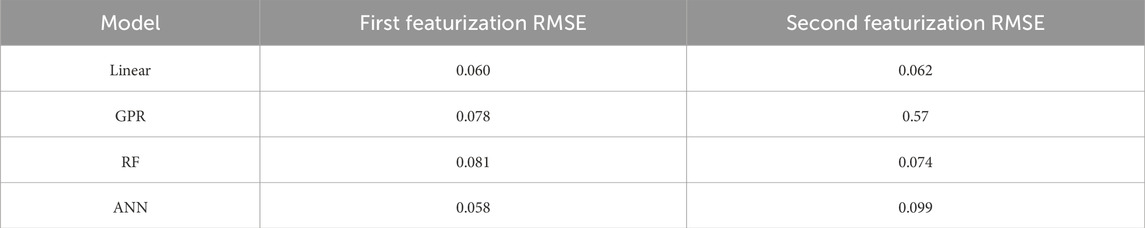
Table 2. RMSE of all trained models.
The melts studied in this work were of the form xA2O·(1-x) NF2Oq where A represents a charge carrier (glass modifier) that remained constant for all simulations, NF represents a former generated network that was different for each simulation, and the subscript q is the stoichiometric coefficient that varies with the charge of the NF. There were three types of atoms in each simulation, oxygen, the charge carrier, and the network former, where the network former-oxygen interaction was defined using the bounded random method. The oxygen-oxygen and oxygen-charge carriers had fixed interactions. The compositions ranged from 0.3 < x < 0.8 and were randomly selected for each simulation. Each simulation was initialized with 4500–6000 atoms, depending on charge balancing requirements, and placed randomly in a box with a starting density of 2.5 g/cm3. The timestep used throughout was 1 femtosecond, and periodic boundary conditions were used. All simulations were performed using the Large-Scale Atom/Molecular Massively Parallel Simulator (LAMMPS) (Thompson et al., 2022).
After energy minimization, the simulation was allowed 100 ps to equilibrate in a microcanonical ensemble (NVE). Subsequently, the system was held at 3000 K for 100 ps before quenching to 300 K at a rate of 1 K/ps and equilibrating again for 100 ps at 300 K in the NPT ensemble. Next the simulation was heated to 1400 K over a 20 ps interval followed by an equilibration at 1400 K for 100 ps with NPT conditions to ensure equilibrium and steady-state diffusion. MSD data was then collected over the next 100 ps time interval under NVT conditions, and this process was repeated at 2200, 2600, 3000, 3500, and 4000 K. In some simulations, the potential failed at the highest temperatures, but sufficient data from the lower temperatures was still used. Replicate tests were carried out on two of the systems to confirm that the simulation results were reproducible.
To obtain values for the activation energy (EA), D is given by, (Welch et al., 2019; Du and Cormack, 2022; Salrin et al., 2023),
with m2 as the mean squared displacement in nd dimensionality over the time interval Δt. Values for m2 were calculated every picosecond and corrected for the motion of the center of mass. Convergence in steady-state diffusion was ensured by sufficiently high temperatures but excluding temperatures at which the potentials failed on an individual basis. Additionally, an error estimate is obtained by estimating the uncertainty in the slope of the mean-square-displacement. EA calculated by assuming an Arrhenius dependency of the diffusion coefficient with temperature: (Varshneya and Mauro, 2019)
D0 is the pre-exponential factor, kb is Boltzmann’s constant in eV, and T is the absolute temperature. All scripts are accessible through a request to the corresponding author.
In this investigation, a variety of machine learning algorithms were tested to determine the optimal model. The models tested include linear regression (LR), Gaussian process regression (GPR), random forest (RF), and artificial neural networks (ANN). The models are summarized in Figure 2. All predictive models were constructed using scikit-learn and for ANNs, Keras. Hyperparameter optimization was performed for each of the models through a grid search process, and the root mean square error (RMSE) of each model served as the metric of comparison. 70% of the initial data were used for training and validation through a K-fold cross-validation process with five splits, and the remaining 30% was used for testing. The machine learning models described here are summarized in Table 2.
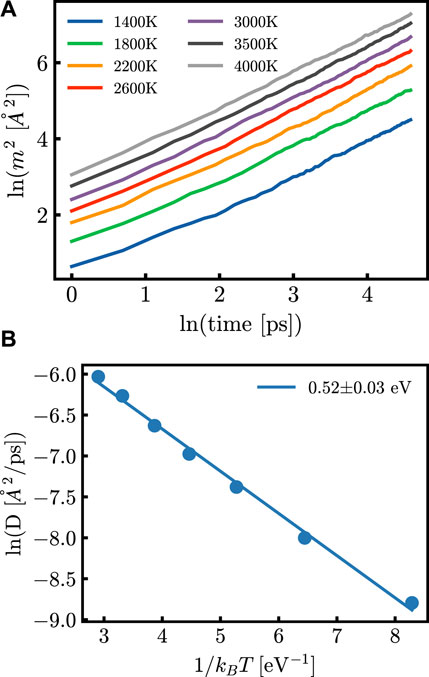
Figure 2. (A) m2 as a function of time at different temperatures after annealing of the system and (B) the diffusion coefficient as a function of the inverse of temperature. Both (A) and (B) are shown here to be calculated from the same generated potential.
For each of the models, the parameters from the network former potential, Zi, Dij, aij, and r0, as well as the compositional parameter, x, served as the model features. To simplify the system, the anion is fixed to be oxygen, thus j in each of these parameters is oxygen (i.e., Dio, aio). A second parameterization was developed using the parameters derived from the plotted curve. In the second set of parameters, Dc is the lowest energy of the potential well at the radius, rc, and ac is the second derivative of the potential well at radius rc. This second set of features represents the critical values of the potential rather than considering each of the potential terms individually. Additionally, this allows us to test the role of the equilibrium distance. In the second process, there is no charge term (zc) because the Coulombic term is added into the rest of the potential when determining the distance and depth of well.
Interpretations of model predictions were calculated using Shapley Additive Explanations (SHAP), which were calculated using the shap module in Python (Shapley et al., 1953; Lundberg and Lee, 2017). This explainable machine learning technique has shown success in interpreting Young’s Glass Moduli (Bishnoi et al., 2019). SHAP values are calculated for each feature of the models and have the same unit as the target predicted by the models (EA, eV). Furthermore, these SHAP values are additive, meaning that summing all the SHAP values for a given prediction plus a base value (mean of the target value) returns the model prediction. This means the SHAP values give the contribution of each feature to the final prediction, allowing for a features importance to be determined for any nonlinear model.
While there are many great uses for SHAP, there are some inherent limitations to the technique as well. First, SHAP requires a nonlinear model for interpretation and assumes additive contributions of features which may not always be true. Since SHAP looks at the contributions of every feature this also makes it difficult when there are many features. This makes it difficult to use this technique for potentials with more features. Furthermore, SHAP does not provide results specific to any one network former, rather it determines overarching trends in the data, indicating which feature is the most influential across the data.
After 124 simulations, the EA was calculated from the diffusion coefficients as shown in Figure 2. All tabulated data used for models is given in Supplementary Table S1. The first analysis used a Kendall correlation to compute the ordinal association between sets of data; this is shown for the original parameter sets and the derived parameter sets in Figure 3. The results do not show a significant linear correlation, motivating the need for more complex machine learning methods.
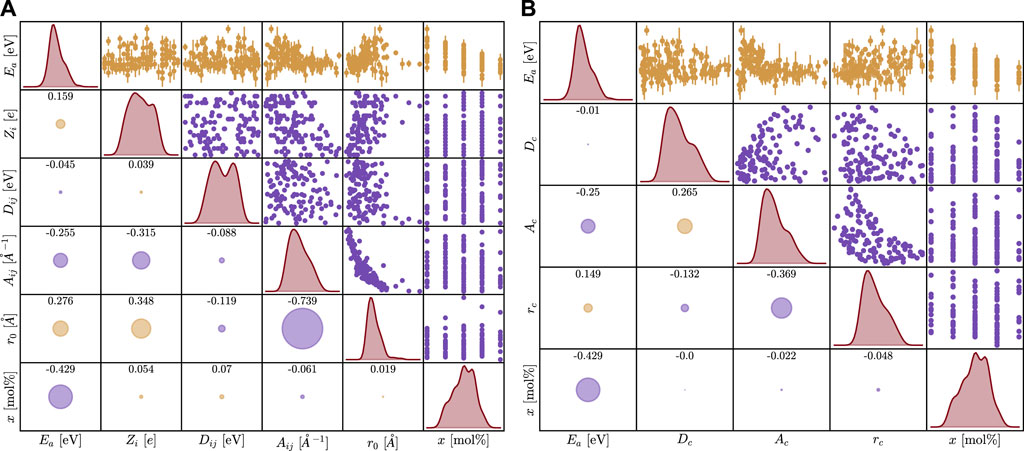
Figure 3. Coorelation plot between all features and activation energy for the first (A) and second (B) parameterization. The error bars on the activation energy represent a 95% confidence interval, and some error bars are smaller than the data points. Histograms are included along the diagonal. The numbers in the lower left cells represent the Kendall correlation coefficient with the magnitude captured in the size of the circles, and the sign is represented by color (yellow is positive and purple is negative correlation).
Machine learning methods were trained on both the potential parameters and the derived critical parameters. The ANN trained in the potential parameters showed the best performance with an RMSE score of 0.058 eV. The model consisted of one layer with 50 neurons, a batch size of five and a learning rate of 0.01; The Adam optimizer was used. The SHAP analysis is shown in Figure 4 for the potential parameters and shows the relative impact of each variable on the resulting prediction where a ‘high’ color means it is larger compared to the mean and a ‘low’ value means smaller. The placement of the data from left to right explains whether the value decreases or increases the prediction, respectively. Finally, the variables are listed from the most impactful on the top to the least impactful on the bottom.
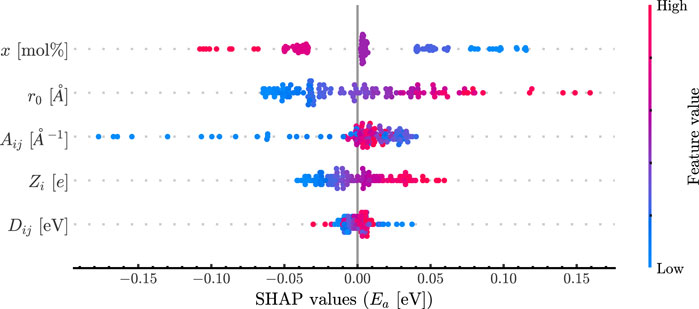
Figure 4. SHAP plot revealing feature importance. Features are listed descending by importance, and each dot represents the feature contributions for that data point. The color of each data point is determined by the relative magnitude of that data point.
The results in Figure 3 reveal no correlation with the activation energy for the parameters explored here. Interestingly, there is a distinct correlation between r0 and Aij, but this can be explained given that both are in the exponential of the Morse term. Additionally, there is a positive correlation between x and EA as expected and this is also seen in Figure 4. Obtaining this result helps support that these simulations are reproducing the effect of changing composition correctly. The most striking result of this work is the importance order in Figure 3.
The radius of the Morse term plays the most important role in the potential, being greater than the charge and energy of interaction combined. This is a unique result as it shows that the terms most associated with the energy of interactions (the Coulombic and Morse terms) do not govern the effect of the cation on the diffusion of ions. Dij appears to play little to no role in the activation barrier. It is important to note that the strength of the bond and the length of the bond are decoupled. This is not physical due to the nature of electron interactions but acts here as an informative experiment.
The bond length between the network former and oxygen influencing the activation barrier is not immediately understandable, as the jump distance is part of the preexponential factor for diffusivity in the Arrhenius equation, and the radius of the network former is not directly present in any of the current theories of activation energy. Although some may argue this is considered in the binding factor, two additional possibilities for how the radius propagates into the activation barrier can be identified, both of which are agnostic to the strength of the bonding that occurs. The first is an argument from the Madelung perspective. The Anderson-Stuart model has an effective Madelung constant present in the calculation; this is typically a fitting parameter as the location of the ions in the glass cannot be known explicitly. Despite this, it can be considered that for a typical glass, there is a chain of alternating positive (network former) and negative charges (anion) that terminate with a mobile species (modifier). The effective ‘Madelung’ constant then explains that if the network former and anions come closer together, there is less of an effective charge action on the modifier. The effective charge explanation also explains why the charge plays a systematic role and why the activation energy is minimized by minimizing the charge of the network former and minimizing the bond length.
Alternatively, the effect can be explained through a free volume perspective. The synthesized glass has a unique structure that is controlled by the chemistry and former-anion interaction of the network. With a low radius and a low charge there are more oxygens but also less space for them to fit around the network former, leading to a theoretical inefficiency in packing. This inefficiency could lead to a significant effect on the activation barrier by leading to a difference in the activation volume of ion diffusion. In either case, it is important to note that the critical parameters of the network former-anion interactions are the bond length and charge of the cation, and that the specific energy of the interaction only weakly affecting the activation energy. Additionally, this indicates that the network former does not have a direct effect but instead the network former decides the structure which in turn decides the ionic conductivity.
Finally, the method used here is a generalizable and can enable the bonding/property relationship in any glass. This is due to the ability to directly link the potential parameters to the properties of interest. There are limitations as the potential form used here was ‘simple’ and 100 simulations was enough to understand the effects of the parameters on potentials other complex potentials may be too complicated for this method to capture the dependence thereof.
This work presents a novel approach to interpret the role of potential energy curves on the overall dynamics of an ion-conducting material. This approach is based on a multimodel approach consisting of molecular dynamics, machine learning, and SHAP and has enabled the elucidation of which cation-modifier interactions are dominating the effects on ionic conductivity. It is important to note again that these are the cation-oxygen effects and not the charge-carrier—oxygen effects. The charge-carrier—oxygen interactions remain fixed. It is determined that the radius of the former oxygen network played the largest role in determining the ionic conductivity, a result that aids in understanding the ion conduction in complex glasses. This can be explained through either a ‘Madelung’ perspective or through free volume. In either case, the role of the network former is shown to be to determine the structure, which in turn determines the ionic conductivity, and the network former interactions do not directly influence the mobility of a species.
The original contributions presented in the study are included in the article/Supplementary Material, further inquiries can be directed to the corresponding author.
TS: Conceptualization, Data curation, Formal Analysis, Methodology, Software, Visualization, Writing–original draft, Writing–review and editing. CB: Conceptualization, Formal Analysis, Investigation, Project administration, Resources, Supervision, Writing–original draft, Writing–review and editing. CW: Conceptualization, Data curation, Funding acquisition, Investigation, Methodology, Project administration, Resources, Supervision, Validation, Writing–original draft, Writing–review and editing.
The author(s) declare financial support was received for the research, authorship, and/or publication of this article. CW thanks the NYS DEC for ongoing support. TS and CB acknowledge the National Science Foundation for their continuous support of Coe College (NSF Grant NSF-DMR-2203142) and the support granted to this project. Any opinions, findings, and conclusions or recommendations expressed in this material are those of the authors and do not necessarily reflect the views of the National Science Foundation.
The authors declare that the research was conducted in the absence of any commercial or financial relationships that could be construed as a potential conflict of interest.
All claims expressed in this article are solely those of the authors and do not necessarily represent those of their affiliated organizations, or those of the publisher, the editors and the reviewers. Any product that may be evaluated in this article, or claim that may be made by its manufacturer, is not guaranteed or endorsed by the publisher.
The Supplementary Material for this article can be found online at: https://www.frontiersin.org/articles/10.3389/fmats.2024.1365747/full#supplementary-material
Anderson, O. L., and Stuart, D. A. (1954). Calculation of activation energy of ionic conductivity in silica glasses by classical methods. J. Am. Ceram. Soc. 37 (12), 573–580. doi:10.1111/j.1151-2916.1954.tb13991.x
Atila, A., Ouaskit, S., and Hasnaoui, A. (2020). Ionic self-diffusion and the glass transition anomaly in aluminosilicates. Phys. Chem. Chem. Phys. 22 (30), 17205–17212. doi:10.1039/D0CP02910F
Bishnoi, S., Singh, S., Ravinder, R., Bauchy, M., Gosvami, N. N., Kodamana, H., et al. (2019). Predicting Young’s modulus of oxide glasses with sparse datasets using machine learning. J. Non-Crystalline Solids 524, 119643. doi:10.1016/j.jnoncrysol.2019.119643
Bragatto, C. B. (2020). Electrical properties of glass. World Sci. Reference Amorph. Mater. World Sci. 15, 199–222. doi:10.1142/9789811215599_0006
Charles, R. J. (1961). Polarization and diffusion in a silicate glass. J. Appl. Phys. 32 (6), 1115–1126. doi:10.1063/1.1736169
Du, J., and Cormack, A. N. (2022). Atomistic simulations of glasses. New Jersey, United States: John Wiley and Sons, Ltd. doi:10.1002/9781118939079.fmatter
Geyer, C. J. (1992). Practical Markov chain Monte Carlo. Stat. Sci. 7 (4). doi:10.1214/ss/1177011137
Lundberg, S., and Lee, S.-I. (2017). A unified approach to interpreting model predictions. Available at: https://arxiv.org/abs/1705.07874.
Martin, S. W. (1991). Ionic conduction in phosphate glasses. J. Am. Ceram. Soc. 74 (8), 1767–1784. doi:10.1111/j.1151-2916.1991.tb07788.x
Martin, S. W., Christensen, R., Olson, G., Kieffer, J., and Wang, W. (2019). New interpretation of Na + -ion conduction in and the structures and properties of sodium borosilicate mixed glass former glasses. J. Phys. Chem. C 123 (10), 5853–5870. doi:10.1021/acs.jpcc.8b11735
Mauro, J. C. (2021). Materials kinetics. Amsterdam, Netherlands: Elsevier. doi:10.1016/C2020-0-00535-9
Pedone, A., Malavasi, G., Menziani, M. C., Cormack, A. N., and Segre, U. (2006). A new self-consistent empirical interatomic potential model for oxides, silicates, and silica-based glasses. J. Phys. Chem. B 110 (24), 11780–11795. doi:10.1021/jp0611018
Ravaine, D. (1980). Glasses as solid electrolytes. J. Non-Crystalline Solids 38–39, 353–358. doi:10.1016/0022-3093(80)90444-5
Ravaine, D., and Souquet, J. L. (1978). A thermodynamic approach to ionic conductivity in oxide glasses—part 2. A statistical model for the variations of the chemical potential of the constituents in binary alkali oxide glasses. Phys. Chem. glasses 19 (5), 115–120.
Salrin, T. C., Johnson, L., White, S., Kilpatrick, G., Weber, E., and Bragatto, C. (2023). Using LAMMPS to shed light on Haven’s ratio: calculation of Haven’s ratio in alkali silicate glasses using molecular dynamics. Front. Mater 10, 1123213. doi:10.3389/fmats.2023.1123213
Shapley, L. S. (1953). “17. A value for n-person games,” in Contributions to the theory of games (AM-28), volume II Editors H. W. Kuhn, and A. W. Tucker (New Jersey, United States: Princeton University Press), 307–318. doi:10.1515/9781400881970-018
Thompson, A. P., Aktulga, H. M., Berger, R., Bolintineanu, D. S., Brown, W. M., Crozier, P. S., et al. (2022). LAMMPS - a flexible simulation tool for particle-based materials modeling at the atomic, meso, and continuum scales. Comput. Phys. Commun. 271, 108171. doi:10.1016/j.cpc.2021.108171
Varshneya, A. K., and Mauro, J. C. (2019). Fundamentals of inorganic glasses. 3. Amsterdam, Netherlands; Cambridge, MA: Elsevier.
Warburg, E. (1884). Ueber die Electrolyse des festen Glases. Ann. Phys. 257 (4), 622–646. doi:10.1002/andp.18832570406
Welch, R. S., Astle, S., Youngman, R. E., and Mauro, J. C. (2022). High-coordinated alumina and oxygen triclusters in modified aluminosilicate glasses. Int J Appl Glass Sci. 13 (3), 388–401. doi:10.1111/ijag.16565
Welch, R. S., Salrin, T. C., Greiner, T., Bragatto, C. B., and Mauro, J. C. (2023). Molecular dynamics simulations of magnesium aluminosilicate glass structure: high-coordinated alumina and oxygen tricluster formation. J. Am. Ceram. Soc. 107, 2155–2171. doi:10.1111/jace.19543
Welch, R. S., Wilkinson, C. J., Mauro, J. C., and Bragatto, C. B. (2019). Charge carrier mobility of alkali silicate glasses calculated by molecular dynamics. Front. Mater 6, 121. doi:10.3389/fmats.2019.00121
Wild, M., O’Neill, L., Zhang, T., Purkayastha, R., Minton, G., Marinescu, M., et al. (2015). Lithium sulfur batteries, a mechanistic review. Energy Environ. Sci. 8 (12), 3477–3494. doi:10.1039/C5EE01388G
Wilkinson, C. J., Doss, K., Cassar, D. R., Welch, R. S., Bragatto, C. B., and Mauro, J. C. (2020). Predicting ionic diffusion in glass from its relaxation behavior. J. Phys. Chem. B 124 (6), 1099–1103. doi:10.1021/acs.jpcb.9b10645
Zhao, M., Li, B.-Q., Zhang, X.-Q., Huang, J.-Q., and Zhang, Q. (2020a). A perspective toward practical lithium–sulfur batteries. ACS Cent. Sci. 6 (7), 1095–1104. doi:10.1021/acscentsci.0c00449
Keywords: machine learning, ionic conductivity, molecular dynamics, classical simulation
Citation: Salrin TC, Bragatto CB and Wilkinson CJ (2024) Investigating the role of network former interactions on charge carrier diffusivity in glasses. Front. Mater. 11:1365747. doi: 10.3389/fmats.2024.1365747
Received: 04 January 2024; Accepted: 05 April 2024;
Published: 10 May 2024.
Edited by:
N. M. Anoop Krishnan, Indian Institute of Technology Delhi, IndiaReviewed by:
Ahmed El-Fiqi, National Research Centre, EgyptCopyright © 2024 Salrin, Bragatto and Wilkinson. This is an open-access article distributed under the terms of the Creative Commons Attribution License (CC BY). The use, distribution or reproduction in other forums is permitted, provided the original author(s) and the copyright owner(s) are credited and that the original publication in this journal is cited, in accordance with accepted academic practice. No use, distribution or reproduction is permitted which does not comply with these terms.
*Correspondence: Collin J. Wilkinson, d2lsa2luc29uY0BhbGZyZWQuZWR1
Disclaimer: All claims expressed in this article are solely those of the authors and do not necessarily represent those of their affiliated organizations, or those of the publisher, the editors and the reviewers. Any product that may be evaluated in this article or claim that may be made by its manufacturer is not guaranteed or endorsed by the publisher.
Research integrity at Frontiers
Learn more about the work of our research integrity team to safeguard the quality of each article we publish.