 Silvain Michel
 Fabian Hauf2
 Andreas J. Brunner
- 1Laboratory for Mechanical Systems Engineering, Swiss Federal Laboratories for Materials Science and Technology (Empa), Dübendorf, Switzerland
- 2Complex Materials Laboratory, Swiss Federal Institute of Technology (ETH), Zürich, Switzerland
A recently proposed mandrel laminate peel (MLP) test for quantification of delamination propagation in Fiber-Reinforced Polymer (FRP) composites is compared with a climbing drum laminate peel (CDLP) test, and the standard quasi-static Mode I fracture test with Double Cantilever Beam (DCB) specimens. MLP and CDLP both are applicable to thin laminates, for which the Mode I DCB test is not suitable. MLP and CDLP, however, do not yield delamination initiation values. Delamination propagation resistances from the three tests performed with different types of FRP, one partly and one fully cured epoxy laminate, and one thermoplastic laminate, all with unidirectional fiber lay-up agree within about 20%. Reduction of the diameter of the climbing drum (100 mm for the standard climbing drum peel test for adhesives) indicates a minimum diameter on the order of 50 mm for the CDLP test. Additional tests with selected laminates investigated potential effects of specimen width. It is concluded that FRP laminate specimens 20 mm wide and 180 mm long are sufficient for consistent results from CDLP and MLP tests. The CDLP test yielded less scatter (around 10%), i.e., better repeatability than the MLP (round 13%) and the Mode I DCB test (around 17%). Hence, the CDLP test is considered advantageous for industrial application, also due to the simplicity of the test set-up and of the data analysis.
1 Introduction
The resistance of carbon or glass fiber reinforced polymer-matrix composites (CFRP and GFRP, respectively) against propagation of interlaminar delaminations is important for fracture mechanics based structural design with these materials. There are standard tests for quasi-static loading of CFRP or GFRP under different modes, of which Mode I, a tensile opening load (ISO15024, 2001) (ASTM-D5528, 2013) that is considered to be the most critical (O’Brien, 1998). This Mode I test is performed on so-called Double Cantilever Beam (DCB) specimens with unidirectional fiber lay-up, propagating the delamination from a starter crack. Recommended specimen widths are 20 mm or 25 mm and specimen thicknesses are 3 mm for CFRP and 5 mm for GFRP in order to limit the deformation of the beams under the opening load. For delamination testing of thinner laminates, a mandrel laminate peel (MLP) test has recently been proposed based on a mandrel peel test originally developed for the determination of adhesive toughness in adhesively bonded joints (Sacchetti et al., 2018). This MLP method was first studied for characterizing interlaminar delamination resistance of thermoplastic composites made by tape placement after welding of individual plies (Grouve et al., 2010). This procedure proved applicable to single laminate plies peeled from a thicker laminate substrate (Grouve et al., 2013). Hence, it is currently evaluated in a round robin by the Technical Committee 4 of the European Structural Integrity Society (ESIS TC4) with a CFRP laminate with thermoplastic matrix (Warnet and Grouve, 2019). The test-rig needed to perform the MLP test is quite complex, requiring, e.g., a friction-less sliding table and a fairly heavy weight of 5–10 kg to provide the alignment force Fa (Figure 1A). An alternative to the MLP test based on another type of adhesive peel test (EN2243-3, 2005; ASTM-D1781, 2012), the climbing drum laminate peel (CDLP), has independently been proposed by (Daghia and Cluzel, 2015a; Daghia and Cluzel, 2015b). In this test, the analysis also yields fracture mechanics properties, and the strain energy release rate necessary to propagate a delamination is evaluated. The simplicity of the test and the robustness of the data evaluation had been shown to be advantageous compared to the MLP test or the standard Mode I DCB test. In this work, besides validating the CDLP approach for determination of interlaminar delamination propagation resistance, an important aim is also to reduce the amount of material required. Therefore, the CDLP test is further developed, evaluated in different configurations (Figure 1B) and directly compared with the MLP and the Mode I DCB test methods using selected thermoset and thermoplastic CFRP laminates.
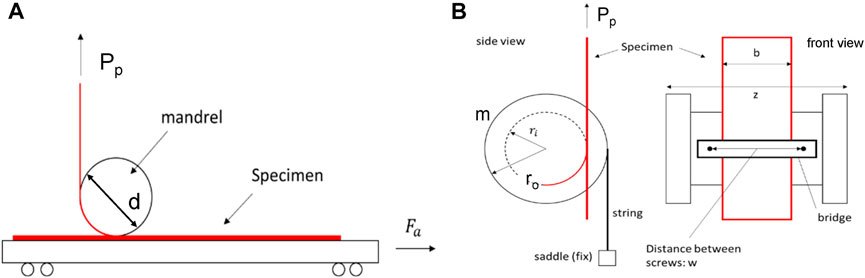
FIGURE 1. Schematic drawings of the mandrel laminate peel (A) and the climbing drum laminate peel test for determination of the Mode I fracture toughness of thin fibre-reinforced laminates (B). Pp is the peel force measured during delamination propagation, r1 and r2 are the inner and outer radii of the climbing drum, and d is the diameter of the mandrel and Fa the alignment force for the mandrel laminate peel test.
2 Test methods and materials
2.1 Test methods
The principle of the CDLP test and the MLP test are similar: In both tests, a thin and sufficiently flexible laminate layer is peeled off a stiffer laminate substrate over a drum or a mandrel. The main difference between the two test methods is that in the CDLP test the drum is moving (along the laminate substrate held in a fixed position) while in the MLP test the mandrel is in a fixed position (laminate moving with the rotating surface of the mandrel). It is expected, therefore, that both methods yield comparable delamination propagation values. The development of the CDLP test is based on ASTM D1781. This test standard yields the peel resistance of adhesive bonds between a relatively flexible adherent and a rigid adherent (with specimens 25 mm wide and at least 254 mm long) or of the relatively flexible facing of a sandwich structure and its core (specimen width 76 mm and at least 305 mm long). The modification of this test set-up for interlaminar delamination propagation of thin fiber-reinforced polymer composites is straight forward. It consists of replacing the standard drum (100 mm diameter) with one that has a smaller diameter with test specimens comparable in size to those for testing adhesive bonds. In order to validate this approach, the CDLP test has been performed with drums with diameter 100 mm (as for the standard adhesive peel), 50 mm and 20 mm. Further, the specimen width was varied from 76 mm (recommended for sandwich facing peel), to 20 mm, and 10 mm, see Figures 2B–D. The largest drum diameter (100 mm) corresponds to that specified in ASTM D1781 (ASTM-D1781, 2012) and EN 2243-3 (EN2243-3, 2005). This large climbing drum is made of steel and therefore relatively heavy (weight = 2.8 kg) and is connected to the test machine with flexible metallic bands (Figure 2D). The small and medium climbing drum devices were two miniaturizations manufactured at Empa by 3D printing from polylactic acid (PLA) and therefore much lighter: 13.5 g and 27.5 g, respectively. Instead of the flexible metallic bands used in the large drum setup, steel wires connected these smaller drums with the test machine (Figures 2B, C). In first series tested (series 5) the wires were of nylon. The dimensions of the drums according to the schematic shown in Figure 1B are given in Table 1.
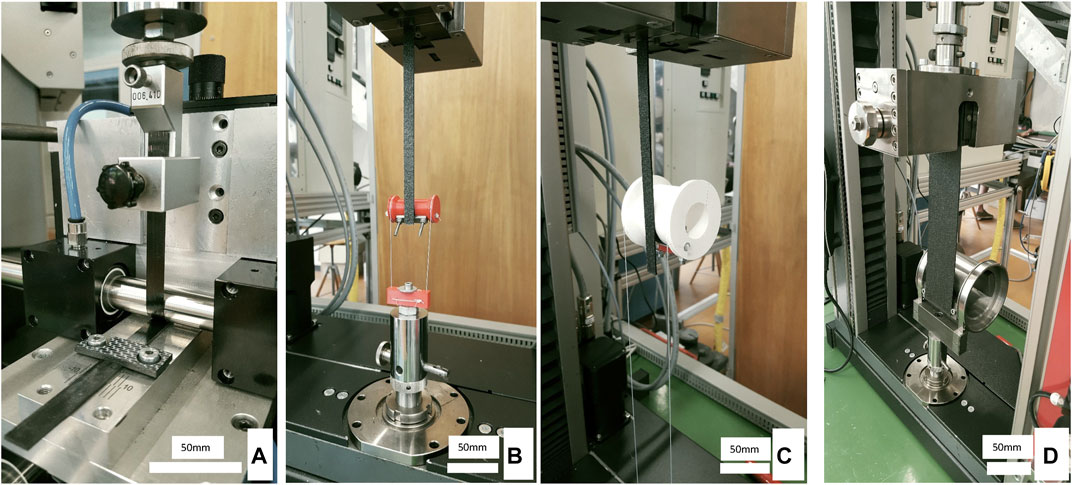
FIGURE 2. Photographs of the setups of the mandrel laminate peel test with a mandrel of 20 mm diameter (A) and climbing drum laminate peel tests with drum diameters of 20 mm (B), 50 mm (C), and 100 mm (D) for determination of the fracture toughness of thin CFRP laminates.
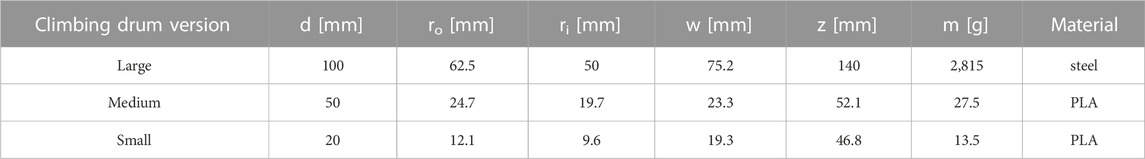
TABLE 1. Climbing drum dimensions and material for the evaluation of the climbing drum laminate peel test. d = drum diameter, ri = inner radius, ro = outer radius, w = distance between screws defining maximum specimen width that can be mounted on the drum, z = width of drum, m = total mass of drum.
For the mandrel laminate peel (MLP) test, all participants in the ESIS TC4 round robin use one single test set-up developed at the University of Twente with a mandrel diameter of 20 mm according to the ESIS TC4 test protocol (Warnet and Grouve, 2019) see Figure 2A. This test set-up consists of an air bedded sliding table freely movable in the horizontal direction and an air bedded freely rotatable mandrel. The thicker part of the specimen, the substrate, is mounted on the sliding table and the flexible part, the thin laminate, i.e., the peel arm, is turned around the mandrel and pulled up vertically. A constant horizontal force (Fa) introduced at the back end of the sliding table is necessary to keep the peel arm always conforming to the mandrel. The dead weight for peel tests with the epoxy material and PAEK CFRP UD was 7.14 kg, for the tests with PAEK CFRP cross-ply material 10 kg; these values are in the range of 5–10 kg recommended in the mandrel laminate peel test draft protocol (Warnet and Grouve, 2019). Further details of this equipment are published in (Warnet and Grouve, 2019).
Mode I fracture toughness were determined with test set-ups according to ISO 15024 (ISO15024, 2001). Delamination propagation was visually observed with a traveling microscope on the edge of the DCB specimen. The average propagation values were used for comparison with the mean delamination strain energy release rates gained with the peel tests.
All the tests have been performed in a controlled standard laboratory environment of 23°C (±2°C) and 50% (±5%) relative humidity. The specimens were stored at least for 48 h in the test environment before testing in order to achieve comparable moisture content. This also applies for the Mode I DCB tests, rather than using dry specimens as recommended in (ISO15024, 2001).
The determination of Gc was performed as recommended by the climbing drum peel test standard ASTM D1781. For the calibration the test on the each specimen, which already has been delaminated was repeated. During this calibration test, the load is measured the same way as during the peeling test and is called here Pf. The difference Pp—Pf is the true force needed to peel the first layer from the substrate. The calculation of the critical strain energy release rate Gc was done as explained in (Daghia and Cluzel, 2015a):
Here ΔEdebond is the energy released during debonding, ΔA is the delamination area created during debonding, Pp is the force measured during the peel test and Pf is the load measured during the calibration run; ro is the radius of the load strap and ri the peel radius of the climbing drum as shown in the Figure 1.
For the mandrel peel test the determination of Gc has been done as described in (Grouve et al., 2013) and (Sacchetti et al., 2018):
Where Fa is the alignment force given by the mass of the dead weight, see Figure 1. For the detailed derivation of the equation above, see supplementary data.
The delamination area ΔA was set equal to the cross-head displacement times the width of the specimen. Therefor any effect of the compliance of the load train was neglected. This simplification was verified by a separate test were the compliance of the loading train was measured. With this test it could be shown, that the loading train was only insignificantly elongating when forces of the order of the peel forces during the CDLP and the MLP test were applied.
For the DCB test the determination of Gc has been done by the corrected beam theory method as described in (ISO15024, 2001):
Where P is the load, δ the deformation measured by the test machine, a is the visually measured delamination length, Δ, F, and N are correction factors, accounting for shear deformation and root rotation by adding an offset length Δ to a, the large-displacement (F) and load block correction (N) by the modified beam theory. The last two corrections factors are calculated according to ISO 15024.
2.2 Materials
The evaluation of the different tests was performed with seven types of specimens differing in thickness, width and lay-up. Five of them were a carbon-fiber laminate with a thermoset epoxy and two a carbon-fiber laminate with a thermoplastic, semi-crystalline PAEK matrix. The focus was on the in-house fabricated carbon-fiber reinforced epoxy composite. This material was made by hand lay-up from a prepreg (type Sigrapreg® C U230-0/NF-E320/39% supplied by Swiss Composite AG). The carbon fibers were unidirectionaly oriented (UD) with a nominal fiber areal weight of 230 g/m2. According to the data sheet, the resulting resin content was 39 wt%. The laminate for the peel test consisted of seven layers, resulting in a thickness around 1.85 mm. For the Mode I DCB tests two types of specimens were prepared: The first type was fabricated with twelve layers resulting in a total thickness of the specimen of 3.2 mm and the second type with eighteen layers, resulting in a thickness around 4.8 mm. For the peel test, a 13 µm thick Teflon film (type FLD HT500 from G. Angeloni Srl) was placed as starter notch between the first and the second layer, and at the midplane for the DCB specimens. The plates were fabricated in an out-of autoclave vacuum bag curing process (vacuum less than 1 mbar) in two different ways: In the first batch, the plates having a temperature of around 23°C were put in the oven preheated to 100°C. The plates were rested for 100 min under vacuum in the oven. This resulted in an incomplete crosslinking of the resin of 85%, as shown later by Differential Scanning Calorimetry (DSC) analysis. In the second (3.2 mm thick) and third batch (4.8 mm thick) plates were put in the oven at room temperature (23°C), then heated up to 50°C held at this temperature for 30 min, before heating up to 100°C and holding the temperature for 120 min, before the specimens were cooled down slowly in the oven over night. This procedure resulted in virtually complete cross-linking (>95%) as shown by DSC analysis. The tests specimens were then cut from the plates with a diamond blade saw (without any special edge smoothing). For the peel tests, the specimen widths were 10 mm, 20 mm, and 76 mm, and 20 mm for the DCB specimens.
The second material was a thermoplastic CFRP laminate. It was from two batches manufactured for the ESIS TC4 round robin for the MLP test and delivered ready for testing (except for conditioning), see (Warnet and Grouve, 2019) for details. These laminates prepared and provided by Toray Advanced Composites consisted of carbon-fiber thermoplastic PAEK (type Toray Cetex® TC1225 LMPAEK T700). The T700 carbon fibers were unidirectionaly oriented (UD) for one set and in a cross-ply (CP) lay-up for a second set. A third set of thicker specimens (2.8 mm) with UD layup was prepared for Mode I DCB tests. The fiber areal weight was around 145 g/m2 and the resulting resin content 34 wt%. The PAEK-specimens for the peel tests were delivered in two forms: The first form, used in the MLP tests, was fabricated with fifteen layers resulting in a total thickness of 1.55 mm and the second form, used in the climbing laminate peel tests, with eighteen layers resulting in a thickness of 2.0 mm. The specimens for the Mode I DCB tests had a thickness of 2.80 mm.
For an overview of all specimen dimensions, see Table 2. In this table the number of specimens successfully tested is also given: For most of the series six specimens were tested, which is the recommended minimum number according to ESIS TC 4 round robin protocol, for series 4, 8, and 10 five specimens each were tested, which fulfills the minimum number according to Mode I standard ASTM-D5528 (ASTM-D5528, 2013). Due to mismanipulation only four tests were successful in series 2 and 3 and due to limitations in material delivery of PAEK specimens only two specimens could be tested in series 7 and only three specimens in series 11. For Mode I test series (series 12–15) at least six specimens per series were tested.
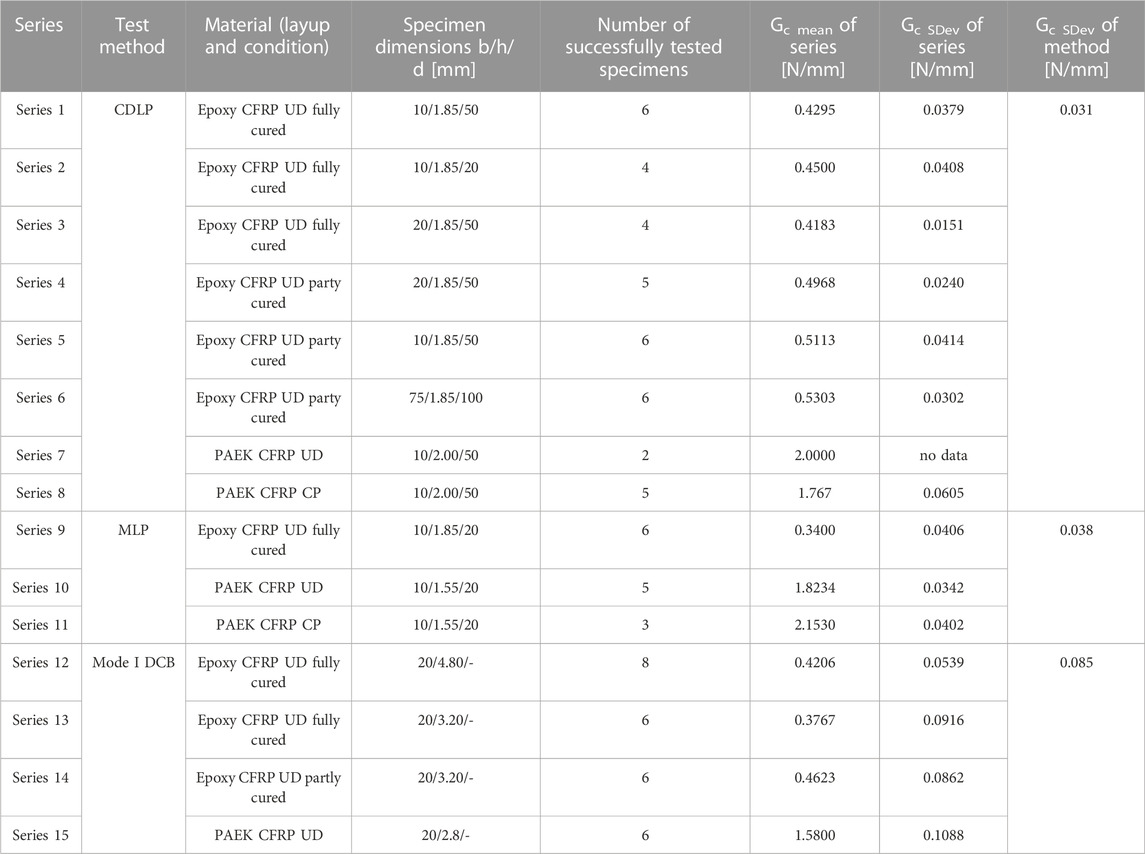
TABLE 2. Test matrix and test results. Test method, material and condition, specimen’s dimensions (independent variables), number of specimens tested and interlaminar fracture toughness in propagation (mean and standard deviation).
3 Results and discussion
3.1 Test results
The first dataset (Figure 3) shows all measurements for CF-epoxy partly cured (batch 1) material obtained from the CDLP test with various specimen’s geometry and drum diameters and the Mode I DCB test. The second dataset (Figure 4) shows all measurements for CF-epoxy fully cured (batch 2 and 3) material obtained from CLDP tests with various specimen’s geometry, one MLP test and a Mode I DCB test. The third dataset (Figure 5) shows all measurements for CF-PAEK material with UD layup, one CLDP test, one MLP test and one Mode I DCB test. The fourth dataset (Figure 6) shows all measurements for the CF-PAEK with CP layup, one CDLP test and one MLP test only. In these plots the fracture toughness is shown calculated with the difference of the force evolution over delamination length measured in the peel experiment and a base-line experiment performed immediately after the peel experiment with the same specimen. An average fracture toughness is afterwards determined excluding the first 5% of data points, which are assumed to be influenced by the artificial pre-crack (delamination initiation). A statistical analysis is then performed based on the average fracture toughness value of each specimen, see chapter 3.3.
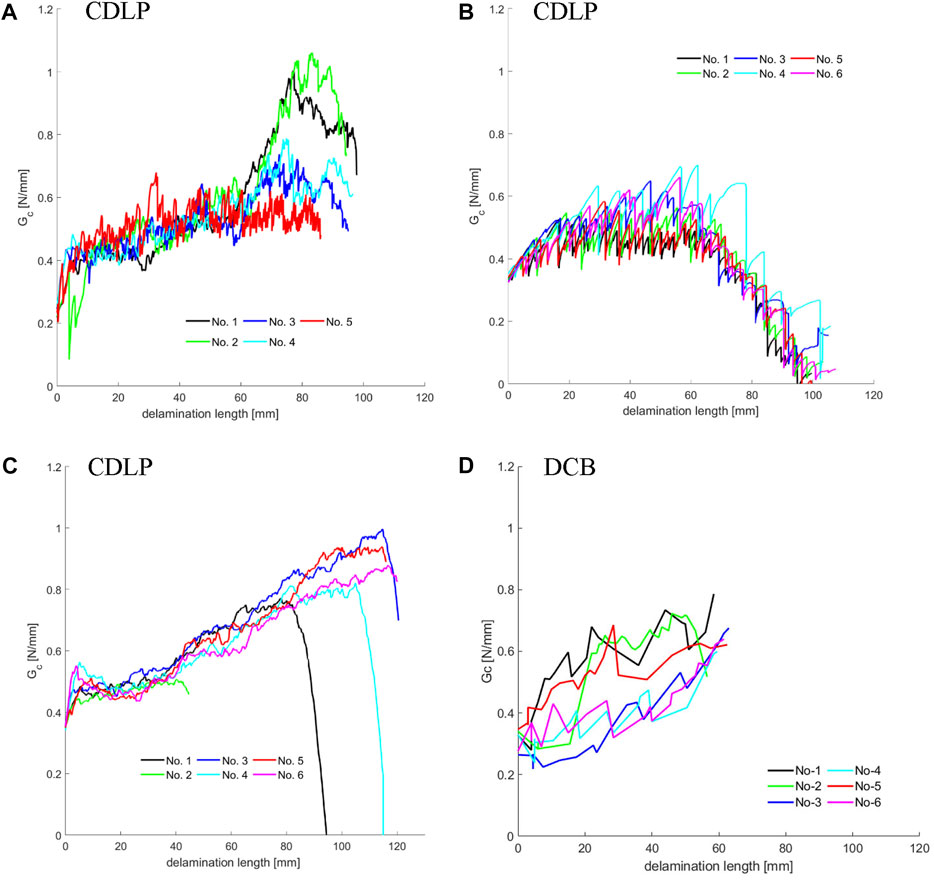
FIGURE 3. Raw data CF-Epoxy partly cured. Series 4: Climbing drum 50 mm, b = 20 mm (A), Series 5: Climbing drum 50 mm, b = 10 mm (B), Series 6: Climbing drum 100 mm, b = 75 mm (C), Series 14: Mode I DCB b = 20 mm t = 3.20 mm (D).
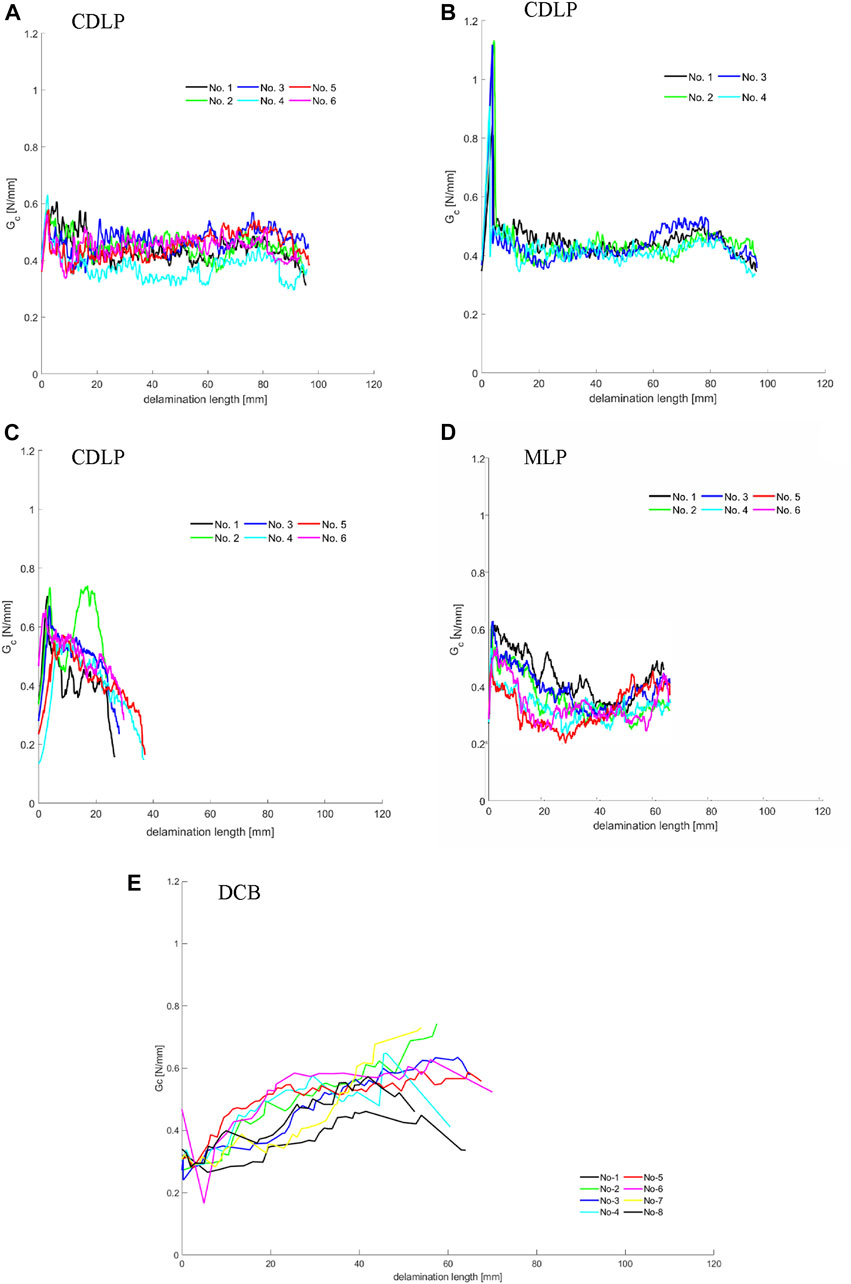
FIGURE 4. Raw data CF-Epoxy fully cured. Series 1: Climbing drum 50 mm specimens 10 mm wide (A), Series 3: Climbing drum 50 mm, specimen 20 mm wide (B), Series 2: Climbing drum 20 mm, specimen 10 mm wide (C), Series 9: Mandrel laminate peel test with 20 mm mandrel, specimen 10 mm wide (D), Series 12: Mode I DCB tests with specimens 20 mm wide, 4.8 mm thick (E).
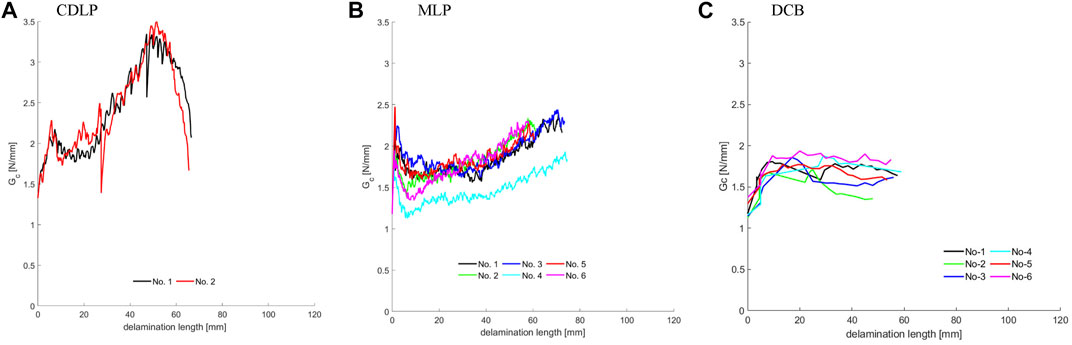
FIGURE 5. Raw data CF-PAEK UD. Series 7: Climbing drum 50 mm, specimen 10 mm (A), Series 10: Mandrel laminate peel (B), Series 15: Mode I DCB b = 20 mm and t = 2.8 mm (C).
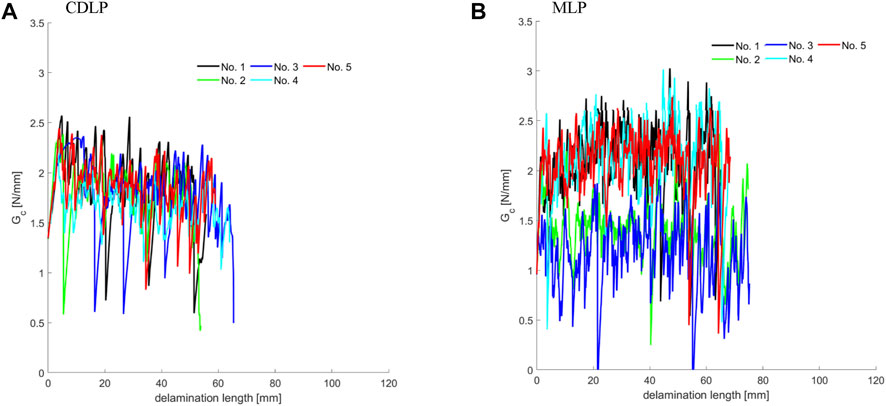
FIGURE 6. Raw data for CF-PAEK CP. Series 8: Climbing drum 50 mm, specimen b = 10 mm (A) and Series 11: Mandrel laminate peel test (B).
3.1.1 Results for partly cured epoxy material
Figure 3A shows five individual CDLP tests with a drum diameter of 50 mm with 20 mm wide specimens of CF-epoxy partly cured. All the curves show first an increase which seems to reach asymptotically a level of approx. 0.55 N/mm. Beyond a delamination length of 60 mm the individual curves show an increasing scatter and only one curve stays at this level, while all other show a steep increase levelling off at values between 0.5 and 1 N/mm. In Figure 3B six individual CDLP tests with a drum diameter of 50 mm and 10 mm wide specimens are shown: In the first part until a delamination length of 60 mm, these curves show a similar behavior as the tests with the wider specimens, but in the second part of the tests, the toughness decreases steeply. Figure 3C shows six individual CDLP tests with the standard drum (diameter = 100 mm) and specimens width of 75 mm. In the very first part of the tests, we can recognize a sharp peak in the toughness that is likely due to an initiation effect caused by the insert film. In the determination of the propagation value however the first 5% of the data points are excluded; so these spikes are not influencing the results. In the second phase of the tests between a delamination length of 10 mm–30 mm a roughly constant value of Gc of about 0.5 N/mm is observed, and finally a steady increase to about the double of the constant propagation value, i.e., Gc = 1 N/mm follows. Figure 3D shows the Mode I DCB tests for this material using specimens with a width of 20 mm and a thickness of 3.2 mm. The curves for the Mode I DCB tests fall into two groups, two tests show a rapid increase in delamination propagation resistance leveling off in a propagation plateau of Gc around 0.6 N/mm, and three specimens with a slow increase to about the same level but not earlier than close to the end of the test. The delamination propagation values for all Mode I DCB tests are between 0.2 and 0.3 N/mm.
3.1.2 Results for fully cured epoxy material
Figure 4A shows the CDLP test data for 50 mm diameter drum and 10 mm wide specimens. The resistance curve first drops slightly until the delamination length reaches about 20 mm. Beyond this point, the resistance remains roughly constant throughout the rest of the peel test, with a moderate scatter within each individual test and among them. The CDLP test with a drum with a diameter of 50 mm and specimen with a width of 20 mm (Figure 4B) yields a very pronounced initial Gc peak. The resistance drops dramatically within the first 5 mm of delamination propagation and then remains fairly constant throughout the rest of the test. There is little scatter within each test and among the four tests. The smallest drum (diameter = 20 mm), used with 10 mm wide specimens (Figure 4C) shows also a minor initial Gc peak that drops within 7.5 mm delamination propagation, except for two specimens: No. 4 and No. 5. This peak is followed by a smoothly decreasing resistance up to delamination length between 25 mm and 35 mm. Two tests show irregular behavior: No. 1 and No. 2. While No. 1 shows a fairly constant resistance of around 0.4 N/mm between 7.5 mm and 22.5 mm of delamination, No. 2 shows higher resistance between 10 mm and 25 mm of delamination length. The three other tests show less scatter within each individual test as well as among them. The MLP test with this material is shown in Figure 4D. All these tests show first a decreasing resistance followed by an increasing resistance. The scatter within each test is low, but significant among tests. Similar to the first batch also for the fully cured CF-epoxy laminate standard Mode I DCB tests were performed. These tests were done with 4.8 mm thick specimens (Figure 4E). The Mode I DCB tests were also performed with 3.2 mm thick specimens (graph shown in supplementary data). In both Mode I DCB tests the propagation values are dependent on the delamination length: The longer the delamination the higher the resistance is. This can be attributed to the well-known fiber-bridging effect. The scatter within individual tests as well as among tests is significant.
3.1.3 Results for UD PAEK material
The third data set (Figure 5) shows data for the unidirectional CF-PAEK laminate. The first observation from the data presented in Figure 5 is that the measured Gc values for the unidirectional carbon fiber thermoplastic laminate are clearly higher than those for the thermoset laminates (shown in Figures 3, 4). The difference roughly amounts to a factor between three and four. The resistance curves from the two peel tests, e.g. with the climbing drum with a diameter of 50 mm (Figure 5A) and with the mandrel with a diameter of 20 mm (Figure 5B) show again an initial Gc peak that drops within the first 5–8 mm delamination length. After that, both tests yield roughly constant values for the next 30 mm of delamination length, and then the values clearly increase. The values for the MLP tests rise more slowly than those for the CDLP tests. The CDLP tests shows at least one instability each, essentially an instantaneous drop in Gc. No clear indication of instability is observed for the specimens tested in the MLP test. The scatter in both peel tests is low within a test and moderate among them, with one exception: No. 4 of the MLP tests seems to have a lower resistance throughout the whole test. An explanation of this outlier could not be found. For comparison also Mode I DCB tests with the same material have been done (see Figure 5C). After a clearly increasing part the resistance curve flatten out and tend to decrease the longer the delamination is. All specimens in the Mode I DCB test yield a delamination propagation plateau between about 1.5 and 1.9 N/mm. The scatter within each test is small and among tests moderate. Possible explanations for the increasing part at the beginning of the tests are the same as those for the epoxy laminates, e.g., development of fiber bridging (even though not observed visually) or migration of the delamination. Further investigations will look into this in more detail.
3.1.4 Results for CP PAEK material
Figure 6 shows a comparison between the CDLP tests using a drum with a diameter of 50 mm and specimen with a width of 10 mm (Figure 6A) and the MLP tests with a mandrel with a diameter of 20 mm and specimens with a width of 10 mm (Figure 6B) for the CF-PEAK cross-ply laminate. Both data sets show several cases of unstable delamination propagation, essentially in all specimens. This is reflected in the fracture surfaces that, upon visual inspection, show alternating ranges of “dark” and “bright” zones, see Figure 7. This is a clear difference compared with the unidirectional laminates. If initial peaks in Gc are presented, they are of the same order of magnitude as the overall scatter in the curves. The data from the CDLP tests show a slight decreasing trend with increasing delamination length. Within the scatter, the data from the MLP tests look fairly constant over the whole range of delamination length. However, the specimens seem to fall into two groups with higher and lower Gc values, respectively, differing by about 0.5 N/mm.
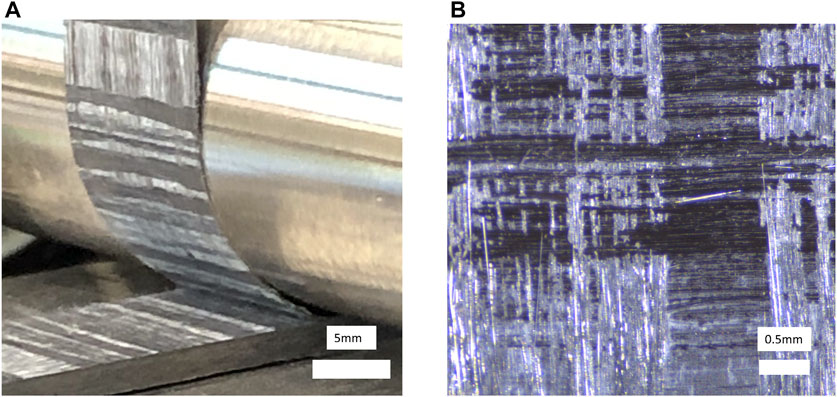
FIGURE 7. Photograph of the fracture surface of cross-ply carbon fibre thermoplastic CF-PAEK laminate. During mandrel laminate peel testing (A) and a micrograph of the fracture surface (B). The alternating dark and bright zones are attributed to the alternating stable and unstable propagation observed in this material.
3.2 Statistical evaluation
3.2.1 Statistical methods used
The fifteen series of data are treated as independent groups in a statistical analysis with the goal to perform a preliminary evaluation of various effects. First, the normality test according to Shapiro and Wilk (Shapiro and Wilk, 1965) is done, which showed that all series are normally distributed, except for series 1 and 7. Second, pairs of series are tested with the Welch’s t-test in order to identify differences between series. The Welch’s t-test (also known as Welch’s unequal variances t-test, (Welch, 1947), is applied, because it assumes only normal distribution of the data but not equal variance. The significance of material differences, differences in the curing process, specimen width effect and drum size effect are statistically evaluated. The sensitivity of the three test methods is also evaluated using Welch’s t-tests. Some limitations had to be accepted in this preliminary study because not all data sets were of equal size and the test matrix was incomplete: The variability of the data as well as repeatability of the three methods (CDLP, MLP, and DCB) cannot be quantified. Nevertheless conclusions concerning the scatter in data gained by the different methods can be evaluated. A critical p-level of 0.05 was chosen for the judgment of significance of an effect. Comparing the results from the fifteen test series in Table 2 can provide preliminary information on the various aspects that are important for assessing the feasibility of a CDLP test as well as for the comparison with the other test methods for the determination of delamination resistance of thin fiber-reinforced laminates. The summary of the results are numerically given in Tables 2–4 graphically shown in Figure 8.
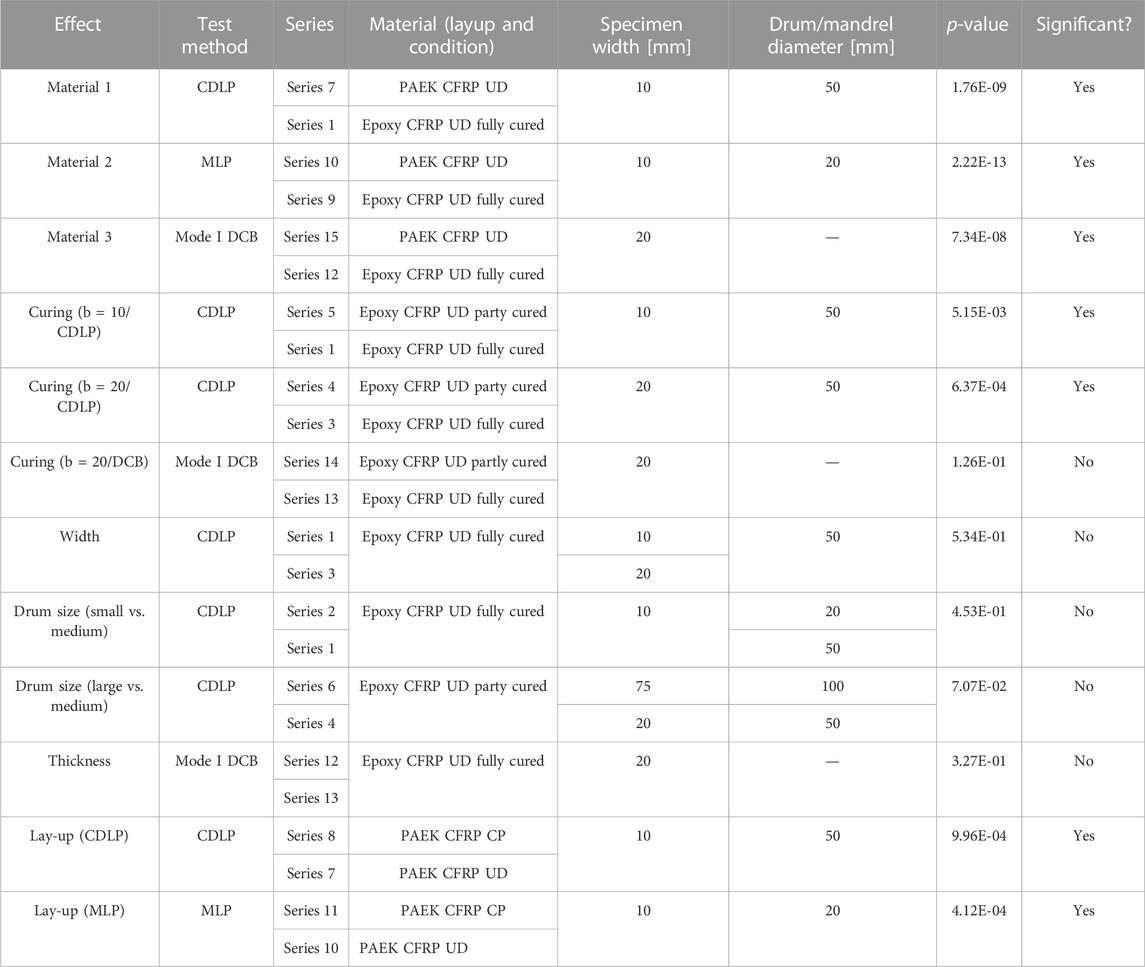
TABLE 3. Test results: Summary of Welch’s t-test between variations of material and specimen geometry.
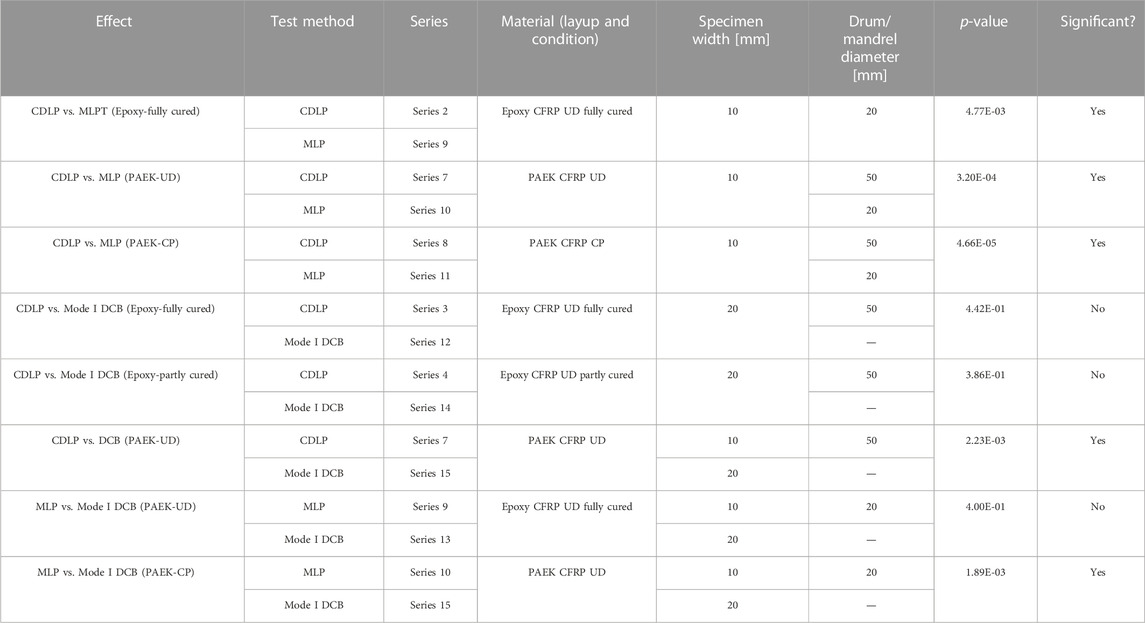
TABLE 4. Test results: Summary of Welch’s t-test between variations of test methods.
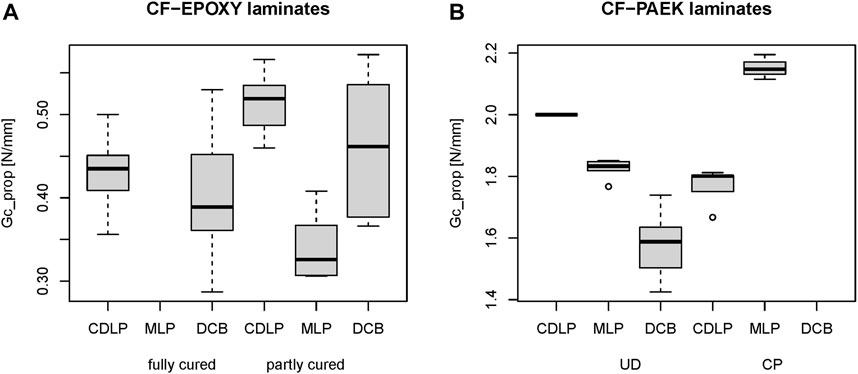
FIGURE 8. Comparison overview: Minimum, maximum, median, first and third quartile of Gc propagation values for the two types of materials determined with three methods (CDLP = Climbing Drum Laminate Peel Test, MLP = Mandrel Laminate Peel Test, DCB = Mode I fracture toughness test with DCB specimens). CF-EPOXY material partly and fully cured (A); the data for the climbing drum test represent all diameters and width. CF-PAEK-laminates UD layup and cross-ply layup (UD = unidirectional and CP = cross-ply) (B).
3.2.2 Material difference
Figure 8 shows a clear difference between the test results gained with laminates with the thermoset epoxy matrix (Figure 8A) and laminates with the thermoplastic PAEK-matrix (Figure 8B). This statistically significant difference has been found with all test methods (see Table 3) and has been expected, of course.
3.2.3 Differences in curing process
There are small, but significant differences between the results of the tests with specimens produced in the first and the second batch of CF-epoxy. These differences in resistance are attributed to differences in processing: As noted above, the specimens from the first batch turned out to be not fully cured (only partly cross-linked to about 85% as shown by DSC, see supplementary data for details) compared with the fully cured (>95% cross-linking) specimens of the second and third batch. The higher cross-linking state reduces the delamination resistance, since the epoxy matrix becomes more brittle and less compliant compared to the less cross-linked. A SEM spectroscopy study showed also a difference in the cracking mechanism: While in the fully cured material the fracture is within the matrix the fracture is at the interface between the fibers and the matrix in the partly cured material, see details in supplementary data This demonstrates the sensitivity of both, the CDLP and the MLP test method to discriminate slight processing differences in nominally identical laminates (p = 5.15E-03 and 6.37E-04, see Table 3). Interestingly, this difference could not be found by the Mode I DCB test: The statistical test did not show a significant difference in the mean propagation value (p = 3.27E-01, see Table 3). The quality of the determination of the fracture toughness was however not very high for the partly cured specimens. As can be seen in Figure 3 the delamination resistance does not show a clear plateau but can increase (Figures 3A, C, D) or decrease (Figure 3B). While an increasing behavior in the Mode I DCB test (Figure 3D) might be due to fiber bridging, for CDLP tests a fiber bridging effect was not observed. It might be that an inhomogeneous distribution of material properties has affected the resistance measurement. In series 6 the softer wires might have influenced the resistance measurement negatively, although any compliance effect of the climbing drum device should not significantly affect the resistance measurement: The peel force is determined as the difference between the peel experiment and a base-line measurement done for each specimen.
3.2.4 Width effect
Does the width of the specimen influence the test result in the CDLP test? The Welch’s t-test with series 1 against series 3 does yield a clear answer: The width of the specimen does not influence the results from the CDLP test (p = 5.34E-01, see Table 3). However, because the scatter in tests with the most slender specimens (10 mm width) is doubled compared to test with 20 mm wide specimens (see Table 2), 20 mm wide specimens are preferred.
3.2.5 Drum size effect
It was important to compare the CDLP test with the MLP test using the same diameter, giving the same peel radius assuming full conformity. However it was difficult to measure a stable value with the drum of this diameter (series 2). The reason was the following: The drum diameter is limited by a requirement of a minimum delamination length necessary to measure a stable value in the test: Geometrical restrictions limit the maximum delamination length to about 2/3 of the circumference of the drum: After 2/3 of the first round of the drum a collision of the wound layer of the specimen with the unpeeled part of the specimen is inevitable. Therefore the maximum possible peeling length is roughly 2 times the diameter (circumference = Diameter۰π), which gives 40 mm for the drum of 20 mm in diameter. In addition most of our CDLP tests show a peak in the data for initial delamination lengths between about 5 and 10 mm that is attributed to an effect related to the insert film. Therefore, the available delamination length for the measure of the propagation resistance was only 35–40 mm. Within this range a stable value of Gc was not reached. In order to measure a stable Gc, a minimum delamination length of about 80 mm is provisionally recommended. Therefore, a minimum drum diameter of 40 mm should be used. Hence, the evaluation of the CDLP test method was continued with the drum with a diameter of 50 mm. There is also likely a lower limit set by the conformance of the specimens around the climbing drum or the mandrel. Specimen conformance is depending on peel arm flexibility and drum diameter. The diameter limit may, to some extent, depend also on the material to be tested. For the epoxy and the PAEK-material investigated here, it is concluded, that a diameter of 50 mm is sufficient. The Welch’s t-test gave no indication of a drum size effect (p = 4.53E-01, see Table 3). The Welch’s t-test for results gained with a drum of diameter 50 mm versus 100 mm was not clear. The p-value was only 7.07E-02, see Table 3. A judgment of the existence of a difference between the two series based on a confidence interval of 95% would results in a negative answer. A difference is statistically found to be not significant. Therefore an effect of the drum diameter cannot be excluded if the diameter is increased beyond 50 mm. With respect to the best choice for the drum size, a diameter of 50 mm is a good compromise between the requirement of minimum delamination length, conformity and amount of material needed to perform the tests.
3.2.6 Sensitivity of the CDLP, the MLP and the Mode I DCB test
The difference in delamination propagation resistance between the two types of fiber-reinforced laminates (epoxy versus PAEK matrix) was clearly found (all p < 1E-07 for series 7 vs. 1, 10 vs. 9 and 15 vs.12, see Table 3). The comparison between the two laminate lay-ups, e.g., UD vs. CP of the PAEK matrix laminates give indications of a difference in both peel tests (p < 1E-03 for series 8 vs. 7 and 11 vs. 10, see Table 3). Due to limited sample size of series 7 (only 2) and 11 (only 3) such a difference cannot be claimed to be clearly significant for both peel tests. Such an effect could be found in Mode I DCB tests of another thermoset carbon fiber epoxy laminates with unidirectional and cross-ply lay-ups reported and discussed in (Brunner and Blackman, 2003; Brunner et al., 2003). Clear differences in delamination propagation resistance, i.e., the plateau values between the two lay-ups were shown. Therefore, a lay-up effect can be expected in both materials and all three test methods. More statistically better established testing is necessary to obtain proof of this effect in both materials. A very interesting case is the comparison of the partly cured first batch of the epoxy laminate (series 4, 5, and 14) with the fully cured second batch (series 1, 3, and 13): This case shows that the CDLP test is sensitive enough to detect such small process-induced variations in material morphology in contrast to the Mode I DCB tests which cannot detect this difference! This has shown the Welch’s t-test of series 4 vs. 3 giving a p-value of 6.37E-04 for specimen with b = 20 mm and the test with specimens with b = 10 mm, series 5 vs. 1, giving a p-value of 5.15E-03! The corresponding t-test for the Mode I DCB test gave a p-value of only 1.26E-01. This is an important finding for process quality checking were the identification of process variations or irregularities influencing mechanical properties of the material or parts fabricated have to be detected with sufficiently high accuracy. For future studies it is important to base them on balanced samples such that the statistical evaluation will give clear evidence of such effects.
3.2.7 Comparison of Gc values gained with different methods
Are the Gc propagation values gained with the CDLP test method comparable to the values gained with the MLP or the standard Mode I DCB tests? A graphical overview is given in Figure 8. This question could not be answered unequivocally; it is necessary to differentiate between the different materials, processing conditions and test methods: A clear difference was statistically found between Gc determined with the CDLP test and the MLP test for two materials: Epoxy-fully cured and PAEK-UD or CP layup (Epoxy partly cured was not tested with the MLP test). This could be shown by comparing series 2 vs. 9, 7 vs. 10 and 8 vs. 11: All p-values are less than 5E-03. No such difference could be found between the CDLP test and the Mode I DCB test for the epoxy-material in both conditions (series 12 and13 vs. 3, 14 vs. 4): The p-values are 4.42E-01 and 3.86E-01 respectively. For the PAEK-UD-material such a difference however does exist: The Welch’s t-test of series 15 versus 7 gave a p-value of 2.23E-03 (PAEK-CP was not tested in a Mode I DCB test). One reason why a difference with the Mode I DCB test could not be found is the larger scatter in this test. Because the sample size of series 2, 7, and 11 affect these test, all these conclusions are preliminary and should be confirmed with complete analysis based on a better data set. The CDLP test might also be preferable because the force measurement is easier to perform compared to the MLP test: The forces are in the order of 20–25 N compared to 4–7 N with the MLP test, which is five times larger. Nevertheless, from these first findings we can conclude that the three methods presented here should not be treated as fully interchangeable.
The last aspect which can be addressed is the Mode-mixity. How much the delamination is loaded in Mode I or Mode II in a peel test (CDLP or MLP) is still not answered. The mode mixity can be estimated to be close to 100% Mode I by comparing Gc for pure Mode I of 0.399 N/mm (average of series 12 and 13 with the average of the CDLP and MLP test results (series 1 to 3 and series 9) of 0.386 N/mm. This is an indication that laminate peel tests give a Mode I dominated resistance value.
3.3 Applicability of the CDLP test
A first step was made with this study to explore the applicability of the CDLP test. The results look promising: The two types of laminates, one with a brittle thermoset and one with a tougher matrix, were successfully tested. The latter in two different lay-ups (UD and CP). Beside the need for a better data base to confirm the preliminary results, there are several possible directions for continuing the exploration of the climbing drum test method: One is testing of glass-fiber reinforced epoxy laminates, another extending the tests to highly toughened carbon fiber laminates. Testing woven fiber reinforcement instead of unidirectional or cross-ply is another direction. With respect to three-dimensional reinforced laminates, e.g., stitched or with z-pins, the applicability of peel tests CDLP or MLP is judged questionable.
4 Conclusion
Because neither the mandrel laminate peel (MLP) test nor the climbing drum laminate peel (CDLP) test are yet established standard test procedures for delamination resistance, standard Mode I testing with DCB specimens was also performed for comparison. All three tests are useful methods for determining delamination propagation resistance values for each of the materials tested. This indicates the basic feasibility of the two peel tests (CDLP and MLP) for determination of the delamination propagation resistance of thin CFRP laminates. Since the standard climbing drum test requires fairly large specimens it is unlikely to be acceptable for industrial use. Modifying the climbing drum diameter to 50 mm allows for using the same specimen size as for the mandrel laminate peel (10 mm width, 250 mm length). In addition, a drum made of PLA is by a factor of 5.5 lighter than a similar drum made of steel. Hence, the miniaturized CDLP and the MLP tests both have the potential to complement the standard Mode I delamination resistance test requiring thicker beam-type specimens. The CDLP test can be performed successfully if a drum diameter of 50 mm is used. This is not the same diameter as the diameter of the mandrel in the MLP test. This holds for specimens 10 mm wide and at least for the laminate types tested so far.
Even though unidirectional or cross-ply GFRP laminates have not been tested yet, it is expected that both peel tests are applicable to this class of material also. Within the limits of repeatability, all three tests yield roughly comparable delamination propagation resistance values. Delamination initiation values cannot be determined with the peel tests, but thin DCB specimens (e.g., made from two single plies) violate the stiffness requirements of the DCB test. Asymmetric DCB specimens with one thin and one thicker beam require a modified analysis (deMorais, 2021) that has not been standardized yet. Nevertheless, more research is required with round robins performed, e.g., testing GFRP laminates and laminates with high toughness matrix systems, before the CDLP test presented here can be recommended as standard test procedures.
The scatter in the peel test data is clearly less than the scatter in Mode I fracture toughness tests with DCB specimens. The ESIS TC4 round robin will yield reproducibility data for the MLP test with carbon fiber PAEK laminates. Reproducibility data for the epoxy laminates will be addressed in a follow-up study.
Data availability statement
The original contributions presented in the study are included in the article/Supplementary Material, further inquiries can be directed to the corresponding author.
Author contributions
SM and FH preparation of CF-epoxy laminates and specimens, performing experiments and data analysis, SM performing statistical analysis, drawing figures, drafting text and supplemental information, AB conceptualization, drafting and editing text, commenting on data presentation (Figures and Tables).
Funding
Open access funding provided by Empa—Swiss Federal Laboratories for Materials Science and Technology
Acknowledgments
The supervision of this Master Project of FH by Prof. André R. Studart (Department of Materials, Complex Materials Laboratory at ETH, Swiss Federal Institute of Technology Zurich) is kindly acknowledged. Peter Winiger for support for 3D printing drums for climbing drum tests, Marcel Rees and Wilfried Schlegel for preparation of the test machine and testing devices. L. Warnet (University of Twente, Netherlands) for providing round robin specimens and the mandrel laminate peel test set-up.
Conflict of interest
The authors declare that the research was conducted in the absence of any commercial or financial relationships that could be construed as a potential conflict of interest.
Publisher’s note
All claims expressed in this article are solely those of the authors and do not necessarily represent those of their affiliated organizations, or those of the publisher, the editors and the reviewers. Any product that may be evaluated in this article, or claim that may be made by its manufacturer, is not guaranteed or endorsed by the publisher.
Supplementary material
The Supplementary Material for this article can be found online at: https://www.frontiersin.org/articles/10.3389/fmats.2023.981647/full#supplementary-material
References
ASTM-D1781 (2012). Standard test method for climbing drum peel for adhesives. West Conshohocken, PA: American Society for Testing and Materials ASTM.
ASTM-D5528 (2013). Standard test method for mode I interlaminar fracture toughness of unidirectional fiber-reinforced polymer matrix composites. West Conshohocken, PA: American Society for Testing and Materials ASTM.
Brunner, A. J., and Blackman, B. R. K. (2003). in Delamination fracture in cross-ply laminates: What can be learned from experiment? Editors B. R. K. Blackman, A. Pavan, and J. G. Williams (Amsterdam, Netherlands: Elsevier), 433–444.
Brunner, A. J., Blackman, B. R. K., and Williams, J. G. (2003). in Deducing bridging stresses and damage from GIC tests on fibre composites. Editors B. R. K. Blackman, A. Pavan, and J. G. Williams (Amsterdam, Netherlands: Elsevier), 479–490.
Daghia, F., and Cluzel, C. (2015b). “Evaluation of the climbing drum peel (CDP) test for the determination of the mode I fracture toughness of monolithic laminated composite specimens,” in Proceedings of the 20th International Conference on Composite Materials, Copenhagen Denmark, 19-24 July 2015.
Daghia, F., and Cluzel, C. (2015a). The climbing drum peel test: An alternative to the double cantilever beam for the determination of fracture toughness of monolithic laminates. Compos. Part a-Applied Sci. Manuf. 78, 70–83. doi:10.1016/j.compositesa.2015.07.010
deMorais, A. B. (2021). Interlaminar fracture of asymmetrically delaminated specimens: Beam modelling and noteworthy characteristics. Compos. Struct. 265, 113745. doi:10.1016/j.compstruct.2021.113745
EN2243-3 (2005). Aerospace series - non-metallic materials - structural adhesives - test method - Part 3: Peeling test metal-honeycomb core. Brussels: Comité Européen de Normalisation.
Grouve, W. J. B., Warnet, L., Akkerman, R., Wijskamp, S., and Kok, J. S. M. (2010). Weld strength assessment for tape placement. Int. J. Material Form. 3, 707–710. doi:10.1007/s12289-010-0868-z
Grouve, W. J. B., Warnet, L. L., and Akkerman, R. (2013). Critical assessment of the mandrel peel test for fiber reinforced thermoplastic laminates. Eng. Fract. Mech. 101, 96–108. doi:10.1016/j.engfracmech.2012.07.005
ISO15024 (2001). Fibre-reinforced plastic composites - determination of mode I interlaminar fracture toughness GIc, for unidirectionally reinforced materials. Geneva, Switzerland: International Organisation for Standardization ISO.
O'Brien, T. K. (1998). Composite interlaminar shear fracture toughness, G(IIc): Shear measurement or sheer myth? Compos. Mater. Fatigue Fract., Seventh Volume 1330, 3–18. doi:10.1520/Stp13263sRefstyled
Sacchetti, F., Grouve, W. J. B., Warnet, L. L., and Villegas, I. F. (2018). Interlaminar fracture toughness of 5HS Carbon/PEEK laminates. A comparison between DCB, ELS and mandrel peel tests. Polym. Test. 66, 13–23. doi:10.1016/j.polymertesting.2017.12.005
Shapiro, S. S., and Wilk, M. B. (1965). An analysis of variance test for normality (complete samples). Biometrika 52, 591–611. doi:10.1093/biomet/52.3-4.591
Warnet, L., and Grouve, W. J. B. (2019). Mandrel peel test for laminates ESIS-TC4 - RR Introduction. Enschede, Netherlands: University of Twente.
Keywords: fiber-reinforced polymer-matrix composites, thin laminates, Mode I interlaminar fracture toughness, delamination propagation resistance, climbing-drum peel test, mandrel peel test, test comparison
Citation: Michel S, Hauf F and Brunner AJ (2023) Evaluation of a climbing drum laminate peel test to determine the interlaminar mode I fracture toughness of thin CFRP laminates—Comparison with the standard mode I DCB test and a mandrel laminate peel test proposed by ESIS TC4. Front. Mater. 10:981647. doi: 10.3389/fmats.2023.981647
Received: 29 June 2022; Accepted: 18 January 2023;
Published: 30 January 2023.
Edited by:
Robert Li, City University of Hong Kong, Hong Kong, SAR ChinaReviewed by:
Ricardo Carbas, University of Porto, PortugalAndreas Schiffer, Khalifa University, United Arab Emirates
Copyright © 2023 Michel, Hauf and Brunner. This is an open-access article distributed under the terms of the Creative Commons Attribution License (CC BY). The use, distribution or reproduction in other forums is permitted, provided the original author(s) and the copyright owner(s) are credited and that the original publication in this journal is cited, in accordance with accepted academic practice. No use, distribution or reproduction is permitted which does not comply with these terms.
*Correspondence: Silvain Michel, c2lsdmFpbi5taWNoZWxAZW1wYS5jaA==