 Bin Chen1
 Mingyu Fan
 Ke Li
Ke Li- 1National Engineering Research Center for Highways in Mountainous Areas, Chongqing, China
- 2School of Computer Science and Engineering, University of Electronic Science and Technology of China, Chengdu, China
- 3College of Civil Engineering, Chongqing University, Chongqing, China
- 4Department of Mechanical Engineering, Guangzhou City Polytechnic, Guangzhou, China
- 5Engineering Research Center of Complex Tracks Processing Technology and Equipment of Ministry of Education, Xiangtan University, Xiangtan, China
- 6Chongqing College of Architecture and Technology, Chongqing, China
Crack detection is a crucial task for the structural health diagnosis of buildings. The current widely used manual inspection methods have inherent limitations and safety hazards, while traditional digital image processing methods require manual feature extraction and also have substantial limitations. In this paper, we propose a crack recognition method based on pyramid features and memory mechanisms that leverages a U-shaped network, long short-term memory mechanisms, and a pyramid feature design to address the recognition accuracy, robustness, and universality issues with deep learning-based crack detection methods in recent years. Experiments were conducted on four publicly available datasets and one private dataset. Compared with the commonly used FCN8s, SegNet, UNet, and DeepLabv3+ models and other related studies using the same evaluation criteria and datasets, our proposed model shows better overall performance in terms of all metrics evaluated.
1 Introduction
With the development of the economy and the extensive and lasting use of concrete in construction facilities, the possible harmfulness of building structures are becoming more and more serious, so it is increasingly important and urgent to diagnose and maintain the health of structures. Crack detection is an important part of structural health diagnosis and has become a research focus (Deng et al., 2023).
Over the past two decades, a variety of image-based detection methods have provided a safe, efficient, and cost-effective approach to crack detection techniques.
With the emergence of fully convolutional neural networks, deep learning has been applied to image semantic segmentation. The goal of building crack image recognition is to detect whether there are cracks on the surface of the building structure and the location of the cracks. Image semantic segmentation technology divides the image into different blocks according to the content. Compared with image classification and detection, image segmentation is a more delicate work, including image semantics and location issues. Image segmentation can be divided into semantic segmentation and instance segmentation. Semantic segmentation simply classifies each pixel in an image, but instance segmentation needs to distinguish different objects. This paper considers semantic segmentation. The semantic problem is the “what” problem in the image classification task, while the location problem is the “where” problem in the image target detection task (Long et al., 2015), which is very suitable for crack detection.
Aiming at the problems of the low accuracy and poor robustness of current semantic segmentation methods for building crack images, this paper proposes a new crack recognition model based on memory mechanisms and pyramid features which adopts multi-scale feature fusion and cross-layer feature fusion methods to improve segmentation accuracy. In addition, long and short-term memory mechanisms are used to learn the correlation between feature maps to remove disturbing features. Finally, comparative experiments are designed on multiple datasets to test the effect of the proposed model.
The structure of this paper is as follows: the Section 2 is the research status analysis, the Section 3 is the model design, the Section 4 is the experimental design and experimental results analysis, and the Section 5 is the conclusion.
2 Research status analysis
At present, there is a lot of research in the field of crack identification (Jieh-Haur et al., 2017; Li et al., 2017; Liu et al., 2021; Asadi Shamsabadi et al., 2022; Liu et al., 2023).
Among them, literature Jieh-Haur et al. (2017) adopted self-organizing map optimization (SOMO) integrated with image processing techniques to develop a crack recognition model for bridge inspection. Bridge crack data from 216 images were collected from the database of the Taiwan Bridge Management System, which provides detailed information on the condition of bridges. Its methods and datasets are different from those in this paper. Literature Li et al. (2017) developed a machine learning-based algorithm for extracting cracks from concrete bridge images which combines a modified region-based active contour model for image segmentation and the linear support vector machine using a greedy search strategy for noise elimination. Literature Liu et al. (2021) proposed an approach to recognize concrete crack patterns from images. By analyzing the characteristics of structural and non-structural cracks, a binary classification of crack patterns into isolated patterns and map patterns was proposed. The recognition of crack patterns was performed through similarity comparisons using the Differentiable-Image-Saliency-Transform-for-Improved-Scalability-and-Portability-of-Image-Quality-Assessment (DISTS) index. Various parameters that may affect the performance were investigated through several experiments conducted using real-world images. The methods and purposes in literatures Li et al. (2017), Liu et al. (2021) are different from those of this paper. Literature Asadi Shamsabadi et al. (2022) proposed a vision transformer (ViT)-based framework for crack detection on asphalt and concrete surfaces. With transfer learning and the differentiable intersection over union (IoU) loss function, the encoder-decoder network equipped with ViT could achieve an enhanced real-world crack segmentation performance. Compared to the Convolutional-Neural-Networks (CNN) based models (DeepLabv3+ and U-Net), TransUNet with a CNN-ViT backbone achieved up to ∼61% and ∼3.8% better mean IoU on the original images of the respective datasets with very small and multi-scale crack semantics. The model principle and mechanism of literature Asadi Shamsabadi et al. (2022) is different from that of this paper. Literature Liu et al. (2023) described a You-Only-Look-Once-version-three (YOLOv3) model with four-scale detection layers (FDL) to detect combined B-scan and C-scan ground-penetrating-radar (GPR) images subject to poor detection effects and a high missed detection rate of small crack feature sizes. Multiscale fusion structures, efficient intersection over union (EIoU) loss function, K-means++ clustering, and hyperparameter optimization were used in this proposed model to further improve detection performance.
We focus on the models in literature Cao et al. (2020), Xiang et al. (2020), Berman et al. (2018), Zhu et al. (2022), Qu et al. (2022) using the same evaluation index and datasets in the application of research into building crack identification.
Literature (Cao et al., 2020), the attention mechanism was joined to the encoder and decoder of the nerual network structure for road surface crack detection. Compared with other advanced detection methods, this method achieved the highest F1 score of 0.69.
Literature Xiang et al. (2020) proposed an end-to-end convolutional neural network based on pyramid features and attention mechanisms for pavement crack detection. The spatial channel combination attention module is introduced in the Fully-Convolutional-Networks (FCN) network to refine the fracture characteristics. Extended convolution is used to reduce the loss of crack detail due to pooling operation in encoder networks. In addition, the hinge loss function (Berman et al., 2018) is introduced to apply to small objects. Experimental results showed that it has a better effect.
In 2022, the study of the literature (Zhu et al., 2022) in the UNet model based on intensive connection and supervision mechanism to detect road surface crack, and obtained F1 score of 0.684 and 0.654 on two datasets respectively.
Literature Qu et al. (2022) proposed a convolutional neural network with the method of the transformer to capture the image with more long-term dependence and global context information to detect cracks; the experimental results showed that the method on the three datasets achieved 𝐹1 𝑠𝑐𝑜𝑟𝑒s of 0.86, 0.71, and 0.64, respectively.
In summary, the mainframes of image segmentation in deep learning include the FCN (Long et al., 2015), UNet (Ronneberger et al., 2015), SegNet (Badrinarayanan et al., 2017), and DeepLabv3+ (Chen et al., 2018), as shown in Figures 1–4, respectively.
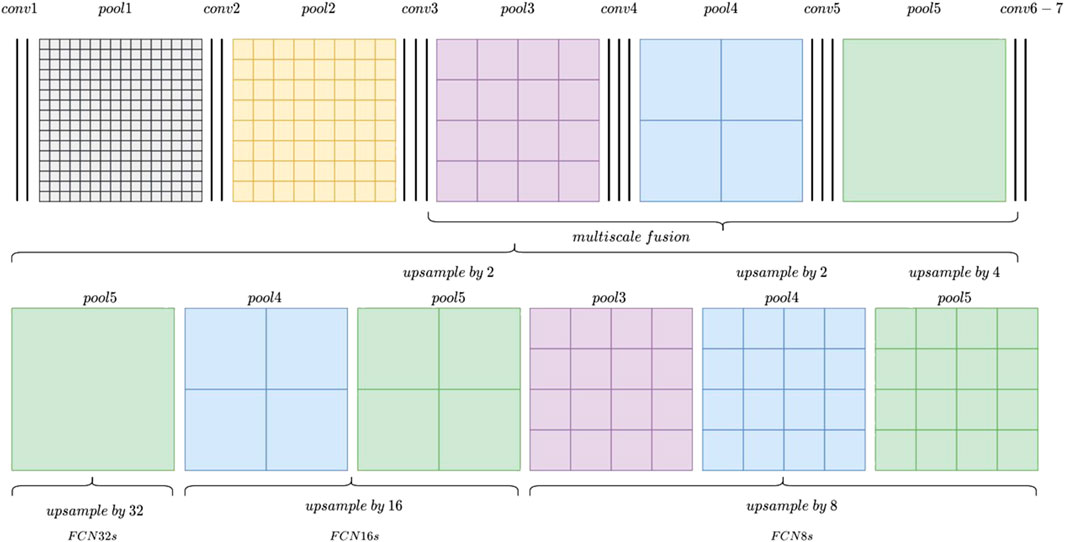
FIGURE 1. FCN8s, FCN16s, and FCN32s models.
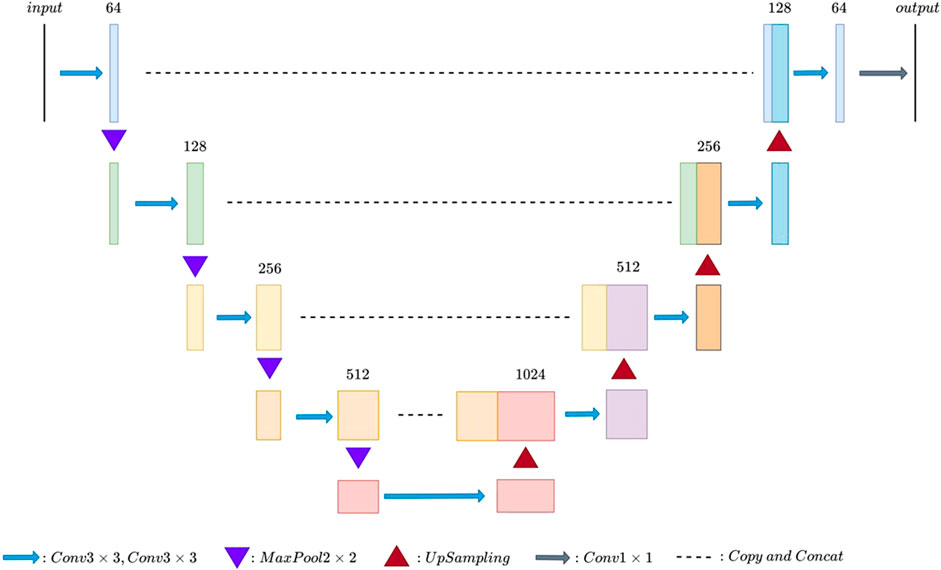
FIGURE 2. UNet model.
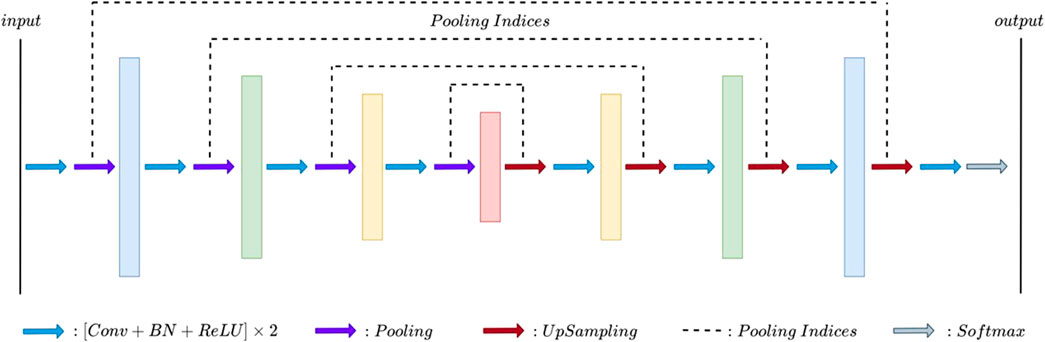
FIGURE 3. SegNet model.
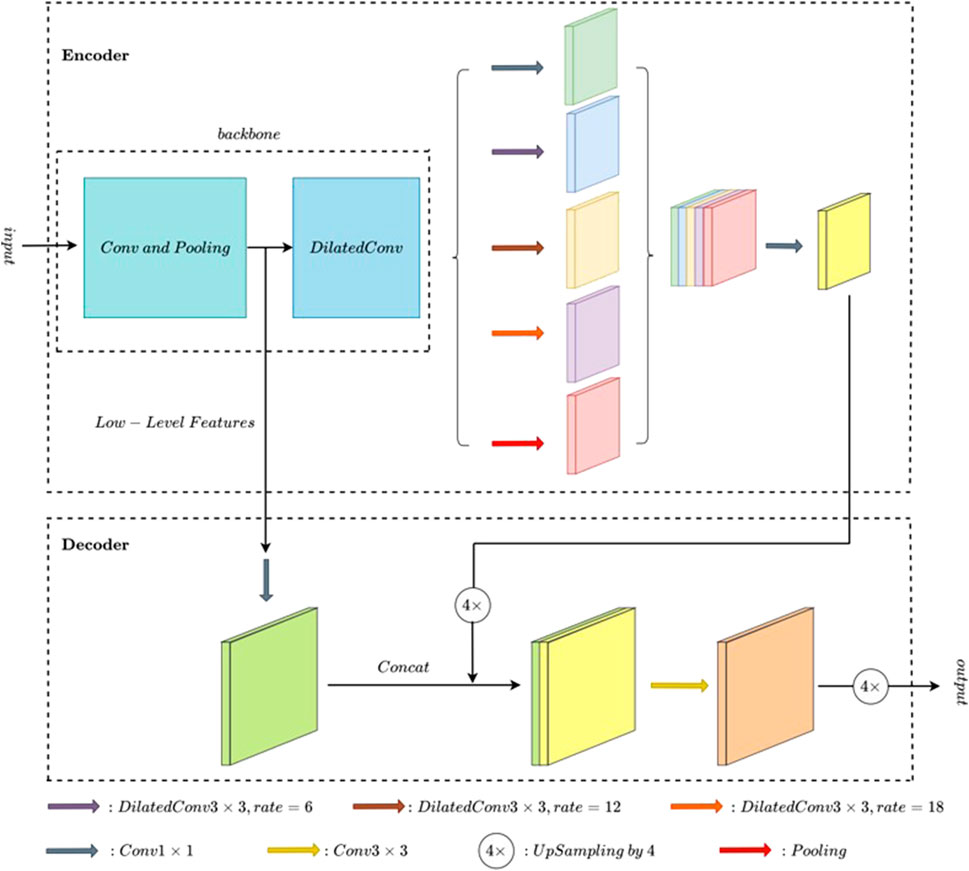
FIGURE 4. DeepLabv3+ model.
Among them, the FCN (fully convolutional network) classifies the images at the pixel level (Long et al., 2015) to solve the image segmentation problem at the semantic level. Different from classic CNNs (convolutional neural networks), which use the full connection layer after the convolutional layer to obtain the feature vector of fixed length for classification, FCNs accept an input image of any size. The deconvolution layer is used to upsample the feature map of the last convolutional layer to restore it to the same size as the input image so that a prediction can be generated for each pixel while retaining the spatial information in the original input image. Finally, pixel-by-pixel classification is carried out on the upsampled feature map. According to the granularity of its segmentation, FCN8s, FCN16s, and FCN32s can be used, in which FCN32s restore the size of the original input graph from the feature graph sampled 32 times down, and FCN16s and FCN8s recover the size of the original input graph from the feature graph sampled 16 times down and 8 times down, respectively. The smaller the number of the model, the more operations are used in the upsampling and the more complex the corresponding model structure.
The UNet model (Ronneberger et al., 2015) was first released in 2015, and its network topology is shaped like “U.” It consists of a contraction path (downsampling) and an expansion path (upsampling). The contraction path is used to capture context Fully-Convolutional-Networks (FCN) information in the image, while the opposite extension path is used to accurately locate the parts that need to be segmented in the image. A total of four times upsampling were performed, and a skip connection was used at the same stage. Compared with FCNs, the UNet model has two differences. First, the FCN model only uses one upsampling operation to restore image resolution, while the UNet model uses four upsampling operations to restore image solution, forming a symmetrical structure with left and right subnetworks. Second, the jump connection of the UNet model uses a vector splicing operation, while the multi-scale fusion of the FCN model uses a vector addition operation.
There is a problem in that the perception field and positioning accuracy cannot be achieved simultaneously in the UNet. When the perception field is large, the dimension reduction multiple of the pooling layer will be increased, which will lead to the reduction of positioning accuracy. However, if the perception field is small, the classification accuracy will be reduced.
The key component of the SegNet model is the decoder network (Badrinarayanan et al., 2017); each decoder corresponds to an encoder. Its main feature is to save the source information of all feature points after the maximum pooling operation in the process of encoding subsampling and achieve the upper sampling by using the index of maximum pooling (anti-pooling) in the process of encoding. The objective is to accurately restore the correct positions of the feature points within the output feature map region. SegNet maximum pooling and noise removal are not considered; the use of two consecutive 4x upsamples to restore resolution also results in less detailed predictions.
The DeepLab model series is a semantic segmentation algorithm proposed by Google. DeepLabv3+ was published in 2018 (Chen et al., 2018). Deeplabv3 + uses atrous convolution to reduce the downsampling rate while maintaining the sensitivity field. The semantics of the final feature map are rich and relatively fine, and the original resolution can be restored directly by interpolation. Atrous convolution is one of the keys to the DeepLab model. It controls the receptive fields without changing the size of the feature map, which is advantageous for extracting multi-scale information. The space pyramid module is another key technology in DeepLab’s model to further extract multi-scale information.
There is a limit on the size of the input image, which is one of the drawbacks of this architecture.
In summary, the recognition accuracy of the above method is still not ideal, and the evaluation index is low, which is reflected in the difficulty to identify the invisible fine cracks in the image and the sensitivity to the noise in the image. Secondly, the universality of the model is poor, which is reflected in that the model only has a good effect on a certain dataset and cannot achieve good performance on all datasets. Finally, some studies did not use public datasets, making it difficult to compare.
3 The PFILSTM method
As can be seen from the above analysis, the semantic segmentation model is based on the classification model (like the detection model), that is, the CNN is used to extract features for classification.
When the FCN is used to classify each pixel, the relationship between pixels is not fully considered. It also ignores the spatial normalization step used in the segmentation methods based on pixel classification, which lacks spatial consistency. In addition, the way of reusing the encoder feature map in the decoder makes it consume a lot of video memory during testing.
There is a problem with the UNet, that is, it cannot realize both the sensing field and positioning accuracy. When the perception field is large, the dimension reduction multiple of the pooling layer is increased, which leads to the reduction of positioning accuracy. However, if the perception field is small, the classification accuracy is reduced.
SegNet’s maximum pooling approach does not consider denoising.
In DeepLabv3+, the size of the input image is a restriction in addition to the calculation requirements, which must have a specific size.
3.1 Overall structure of the model
In order to address the aforementioned problems, this paper introduces a Feature Pyramid Image-based Long Short-Term Memory (LSTM) (PFILSTM). This is a semantic segmentation model for architectural crack images, which leverages memory mechanisms and pyramid features. The main design concept is that the UNet model is adopted, and to retain the dependence between crack pixels during the downsampling process, each layer of long short-term memory is introduced to extract features, aiming to prevent the loss of crack features and interference features. To meet the requirements of multi-scale receptive fields, pyramid feature layers are introduced for fusion. Finally, the two are fused in the last layer of upsampling, so that the lost shallow features can be retrieved from the deep layer of the network, and the recognition ability of the model for fine cracks is further improved.
The overall structure of the PFILSTM model is shown in Figure 5, where the blue box area is the encoder part and the green box area is the decoder part.
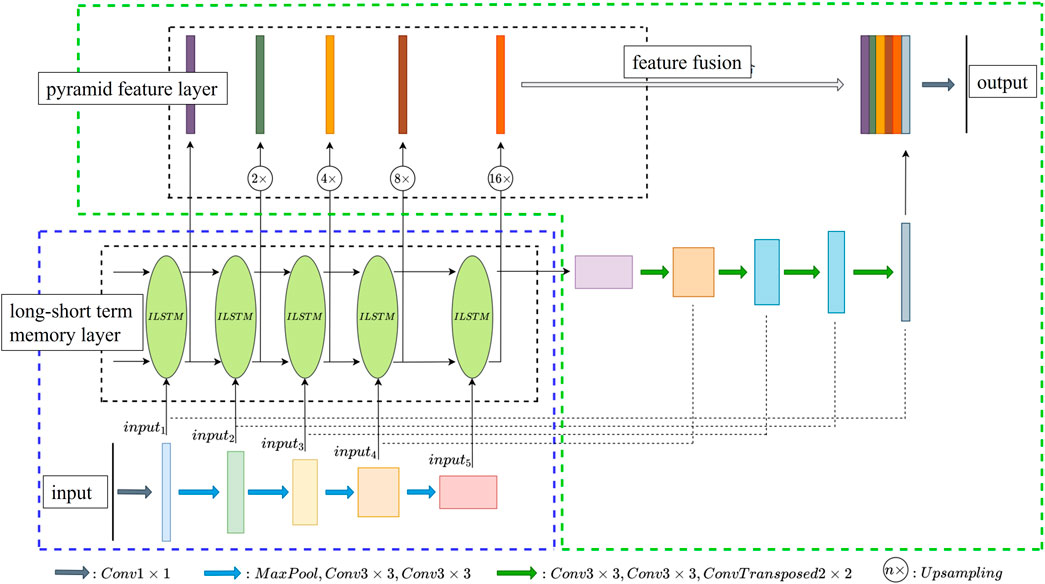
FIGURE 5. PFILSTM model structure.
The PFILSTM adds a long short-term memory layer and a pyramid feature layer based on the UNet model. The difference between the PFILSTM model and the UNet model is that each layer of the PFILSTM model decoder uses the long and short-term memory layer as the input of the pyramid feature layer rather than the output after continuous downsampling. Second, the decoder of the PFILSTM model also integrates the feature map of the pyramid feature layer in the last layer.
The ILSTM (Image-based LSTM) layer and pyramid layer of the PFILSTM model is analyzed in detail.
3.2 ILSTM unit
The network composed of long- and short-term memory units can remember information from different parts of the input sequence and learn the relationship between each element in the input sequence as well as the long-term dependence among them, so that the neural network does not lose the previously learned information and updates the saved information according to the existing information. The LSTM layer possesses the capability to dynamically modify its internal state in response to the input data. This unique feature enables it to adapt to a variety of input data, learning distinct features at various time steps. Given that different images may necessitate unique features for effective segmentation, this adaptability is crucial for the task of segmenting crack images. At present, there have been studies using its memory retention ability to successfully apply it to computer vision tasks, such as image semantic segmentation (Stollenga et al., 2015; Xu et al., 2019) and target tracking (Gao et al., 2019; Liu et al., 2020).
Inspired by the above research, the PFLSTM incorporates an image long-short memory ILSTM unit using convolution operation based on the standard LSTM layer, as shown in Figure 6. A series of ILSTM units are used to model multi-level feature maps at different levels of the same image, learn the correlation between different levels of features, extract important features related to cracks from the image according to the correlation, and filter out the interference information. Similar to standard LSTM cells, ILSTM cells also contain forget gates, input gates, output gates, candidate states, hidden states, and cell states, and the update mechanism is the same; the difference is that ILSTM units do not model the subregions of the same image but the feature maps of the same image at different levels of the convolutional neural network. During model training, each memory unit saves the historical feature information extracted from the same picture so that the subsequent network layer can capture useful historical features from these memory units to help understand the current state and semantics. The memory unit can also filter the interference feature information in the historical feature information according to the current input so that the neural network can make more accurate semantic annotations for the input image.
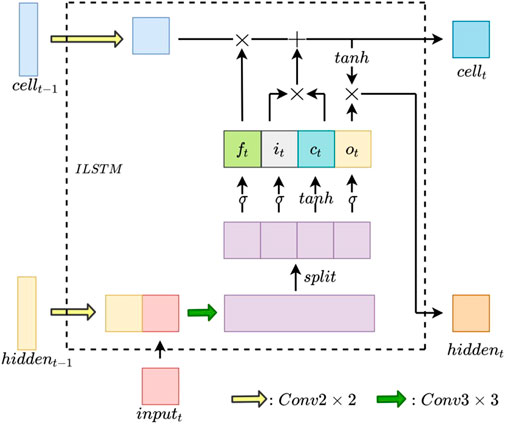
FIGURE 6. ILSTM unit structure.
3.3 Pyramid unit
The current semantic segmentation model either directly adds (FC model) or stitches together (UNET model) the same feature maps from each layer of the encoder and decoder. However, there is a deficiency in passing the feature map from the shallow network to mitigate the impact of reducing feature maps in the deeper network on the edge detail information of the target in the image. However, because the important features of different sizes in the image may appear on the feature diagrams of different scales, it is difficult to identify and divide objects of different scales in the image (Yu and Koltun, 2016; Chen et al., 2017; Zhao et al., 2017). In addition, when detecting the targets with different scales in the image, different degrees of context information also are required (Qu et al., 2022).
The feature maps of targets at different scales extracted from images by the pyramid layer can be used to detect targets in images because each feature map contains different information (Lin et al., 2017). These feature maps with different scales have different receptive fields and contain different levels of context information (Liu et al., 2016). The fusion of these features extracted at different scales can improve the recognition and segmentation ability of the model for objects of different scales. The fusion process is shown in Figure 7.
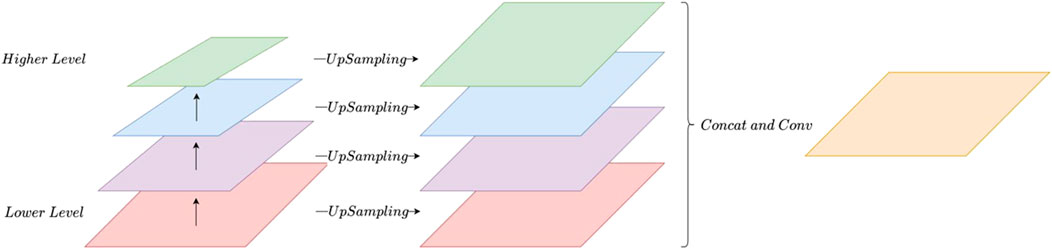
FIGURE 7. Pyramid feature fusion.
Through the above analysis, it can be seen that when generating the final feature map of the PFILSTM, the feature map information of each layer of the network is fully utilized, which is conducive to eliminating the local features with ambiguity in the low-level feature map, making the edge details of the segmentation results more abundant and less noisy. It also helps to improve the scale robustness and accuracy of the model.
4 Experimental design and experimental results analysis
To test the crack identification effectiveness of the proposed PFILSTM model, two experiments were designed. One was to compare the PFILSTM with the popular FCN8s model, SegNet model, UNet model, and DeepLabv3+ model on multiple datasets. Secondly, the PFILSTM was compared with other studies using the same evaluation indicators and datasets.
4.1 Experimental environment
All experimental models were developed and trained utilizing Python version 3.7.10 within the Pytorch framework. The computational resources employed included an Intel® Xeon® Platinum 8269CY CPU, 64GB of RAM, and an NVIDIA Geforce RTX 3080 Ti graphics card equipped with 12GB of memory. Comprehensive specifications are tabulated in Table 1.
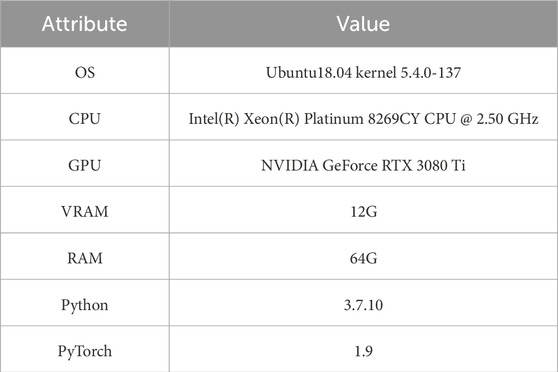
TABLE 1. Experimental environment.
4.2 Datasets and their preprocessing
Concrete buildings can be mainly divided into bridges, roads, and buildings. Limited by space, this paper starts with the concrete public crack dataset and combines private residential buildings and roads crack datasets to conduct experiments and analysis.
4.2.1 Public and private dataset
For concrete road cracks, several open datasets of the CRKWH100 (Zou et al., 2019; Lau et al., 2020), CrackTree260 (Lau et al., 2020), CrackLS315 (Zou et al., 2019), CRACK500 (Yang et al., 2019), and CrackForestDataset (CFD) (Cuilimeng, 2023) were adopted. Finally, these datasets were integrated according to their characteristics. Some images of each dataset are shown in Figure 8.
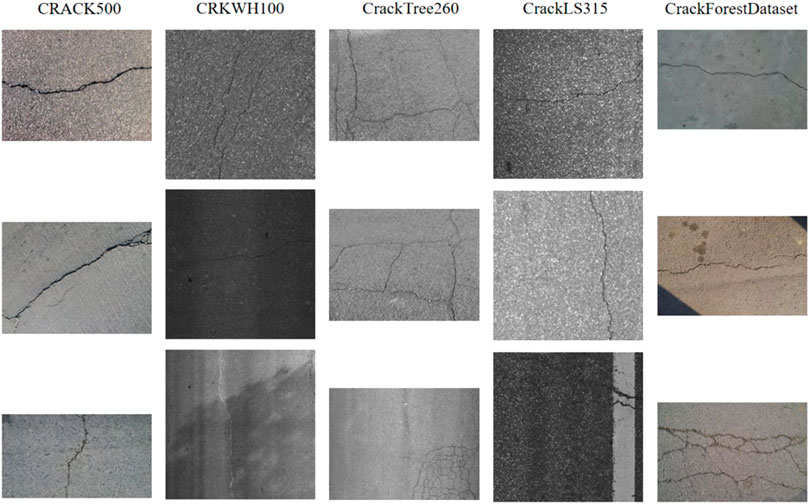
FIGURE 8. Samples from publicly available road crack datasets.
Among them, the CRACK500 dataset comes from the crack images of concrete roads in literature (Yang et al., 2019), and the total number of crack pixels in each image is more than 1,000. The dataset was divided into a training set, verification set, and test set, which contain 3,792, 696, and 2,248 images, respectively, totaling 6,736 images.
The CFD dataset, which is open source on Github, is small and contains only 118 images of cracks in urban concrete roads with a resolution of about 480 × 320.
The images in CRKWH100 and CrackLS315 were taken using linear array cameras and contain 100 and 315 images of road cracks, respectively. CrackTree260 contains 260 images of road cracks taken using a front array camera. In this paper, these three datasets were combined and named the CRACK675 dataset.
After the above integration, the final datasets used in the experiment are BUILDINGS, CRACK675, CRACK500, and CFD. Among them, the BUILDINGS dataset is the private dataset manually marked in this paper and the CRACK675 dataset contains many pictures of fine cracks. The CRACK500 dataset contains more wide-crack images, while the CFD dataset contains the least number of images and has the lowest resolution. The four datasets have different styles that allow for a more comprehensive assessment of the model’s performance in different scenarios.
Our private Residential Building Crack Dataset comprises 200 high-resolution images of fissures in deserted residential structures. These images, captured by our research team using state-of-the-art industrial cameras, are of 1,000 × 1,000 pixel resolution. Each image has been meticulously annotated with relevant labels by a team of researchers. To ensure the utmost accuracy of these annotations, we have implemented a rigorous cross-validation process on this proprietary dataset.
4.2.2 Dataset preprocessing
Preprocessing included two steps: first was the annotation of the private dataset; the second was image size cutting.
The images in the private dataset were manually marked by LabelMe software (Labelme, 2023) to obtain the crack image dataset of residential BUILDINGS used in the experiment, hereinafter referred to as the Buildings dataset.
However, the images in Figures 9, 10 have different sizes and resolutions, which will affect the subsequent deep learning algorithm, so they need to be converted into a standard format with uniform size and resolution. The pre-processing process is as follows:
(1) Divide the dataset into the training set, verification set, and test set.
(2) Cut the dataset according to the fixed size.
(3) Eliminate the images without cracks.
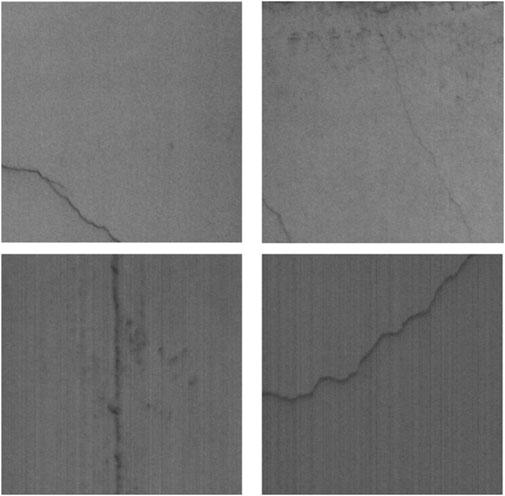
FIGURE 9. Samples of crack images (private dataset) of an abandoned residential building.

FIGURE 10. Process of experiment.
Since the CRACK500 dataset is pre-divided into training, verification, and test sets, the process for the CRACK500 dataset does not include step (1). At the same time, to maintain the original characteristics of the CRACK500 dataset, images with less than 1,000 crack pixels are removed in step (3). Table 2 shows the final partitioning results after data set preprocessing.
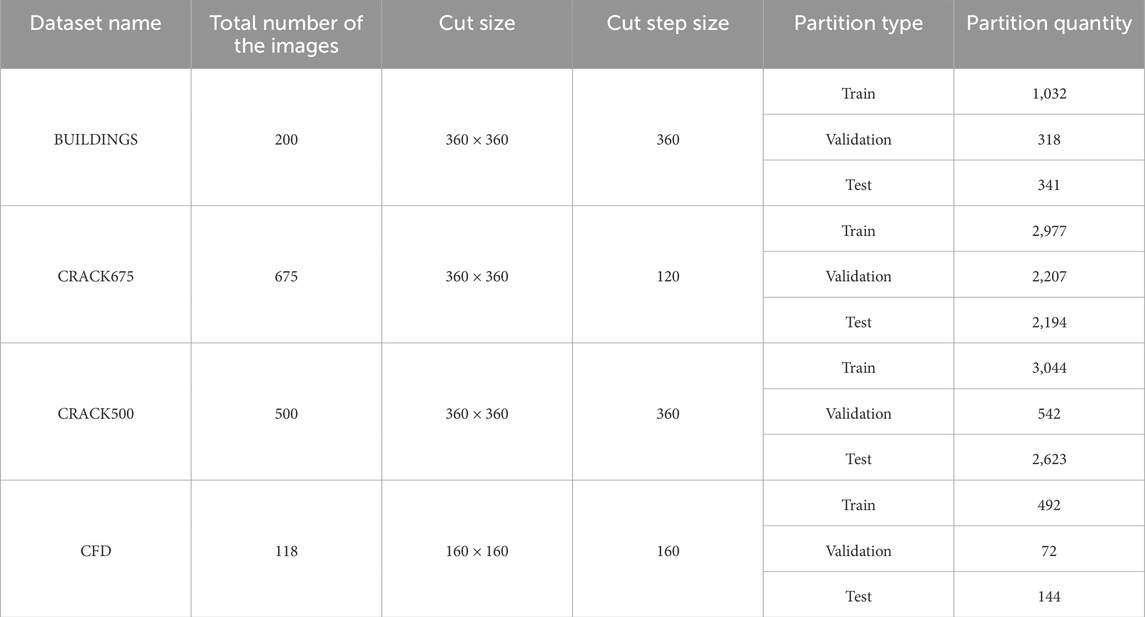
TABLE 2. The dataset preprocessing segmentation results.
4.3 Process of experiment
The experimental process is shown in Figure 10. The first step is to build the dataset for the experiment, as described in Section 4.2. The second step is the training of the model so that each model is trained on the same dataset. The third step is to use trained models to make predictions. The final step is to calculate the score of the predicted results of each model according to the evaluation index.
To compare the performance of various models, the FCN8s, UNet, SegNet, and DeepLabv3+, the PFILSTM model proposed in this paper is used to conduct experiments on the dataset in Section 4.2, and the hyperparameters of each model in the experiment are adjusted from various aspects. The hyperparameters of each model in the experiment are adjusted from various perspectives to ensure that all models are ultimately obtained under relatively optimal conditions in all aspects. Finally, batch_size was determined to be 8, the learning rate was 0.00075, and the learning rate attenuation coefficient was 0.875. In the experiment, each model was trained on all datasets for a maximum of 200 rounds, and the learning rate was attenuated when the loss on the verification set did not decrease for five consecutive rounds. Because the data in the training set, verification set, and test set do not have exactly the same distribution, a model that performs well on the verification set in a certain round does not necessarily mean that it performs well on the test set, so the experiment uses the optimal results in the last 10 training rounds in the model prediction evaluation stage.
4.4 Loss functions and optimizers
It is not difficult to see that the number of background pixels in the crack image far exceeds the number of crack pixels. For this imbalance distribution, the loss function Dice loss (Milletari et al., 2016) has been shown to handle this type of dataset well. It is a loss function for image segmentation tasks, and the basic idea is to calculate the overlapping part of the predicted result and the real result and optimize the model by minimizing the difference between the two.
The optimizer uses Adam (Kingma and Ba, 2015). It is a momentum-based algorithm which uses the historical gradient information of each parameter to ensure a smooth iteration. Compared to other optimizers, the Adam optimizer is less sensitive to the initial learning rate and the selection of hyperparameters, so it is easier to use. In addition, the Adam optimizer can converge quickly to the optimal solution, especially when dealing with large-scale data and high-dimensional parameters, and it can better adapt to different datasets and models.
4.5 Evaluation index of quantitative analysis
The 𝐹1𝑠𝑐𝑜𝑟𝑒, the mean intersection over union (mIoU), and the confusion matrix as shown in Table 3 are commonly used as indicators of the image semantic segmentation model. Next, we will separately delve into the interconnectedness and computational methodologies of three distinct evaluation metrics.
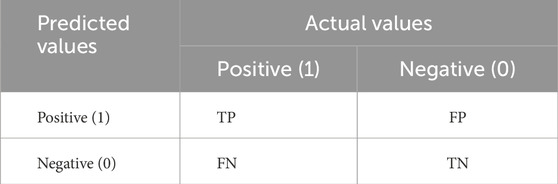
TABLE 3. Confusion matrix.
The confusion matrix serves as the foundation for computing the F1 score and mIoU, effectively highlighting the discrepancies between the pixel blocks of the model’s forecasted image and the labeled image, where T/F means that the prediction result is correct/wrong and P/N means that the sample is predicted to be correct/wrong. The combination of the two results produces four kinds of results: TP, TN, FP, and FN. The accuracy rate of prediction is defined as the proportion of samples with correct prediction results in the total number of samples, and its calculation method is shown in Formula 1. The Precision is defined as the proportion of true positive samples among the samples predicted as positive. And the calculation method as shown in Formula 2:
The predicted recall rate is defined as the proportion of the samples that are positive samples that are predicted to be positive the calculation method as shown in Formula 3:
Typically, precision and recall are considered contradictory measures bound by a certain degree of mutual constraint. To encapsulate the learner’s performance in terms of precision and recall more effectively, we introduce the 𝐹1𝑠𝑐𝑜𝑟𝑒, which is the harmonic mean of precision and recall. This score amalgamates the two evaluation indicators. The calculation method as shown in Formula 4, its calculation precision rate and recall rate of harmonic mean, Only when both precision rate and recall rate are high, the harmonic mean F1score will be higher.
Unlike F1, MIoU measures the performance of the model from another perspective, using the calculation of the intersection and union of two sets as the evaluation metric. In the semantic segmentation problem, the two sets are the sample set that is truly positive and the sample set that is predicted to be positive. The mIoU is calculated by the confusion matrix, as shown in Formula 5.
When the semantic segmentation of the cracks of the building, there is a highly unbalanced distribution of the number of pixels between cracks and background likely, more than 90% of the pixels in the crack image belong to the background, and the calculation result of Eq. 5 is usually high, so using the 𝐹1𝑠𝑐𝑜𝑟𝑒 to measure the prediction is somewhat more convincing than using the mIoU.
4.6 Training and prediction process
Figures 11–14 are the average loss curves of each model in the BUILDINGS dataset, CRACK675 dataset, CRACK500 dataset, and CFD datasets. The subdiagram (a) on the left is average training loss on the set, the subdiagram (b) on the right is the average validation loss on the set.
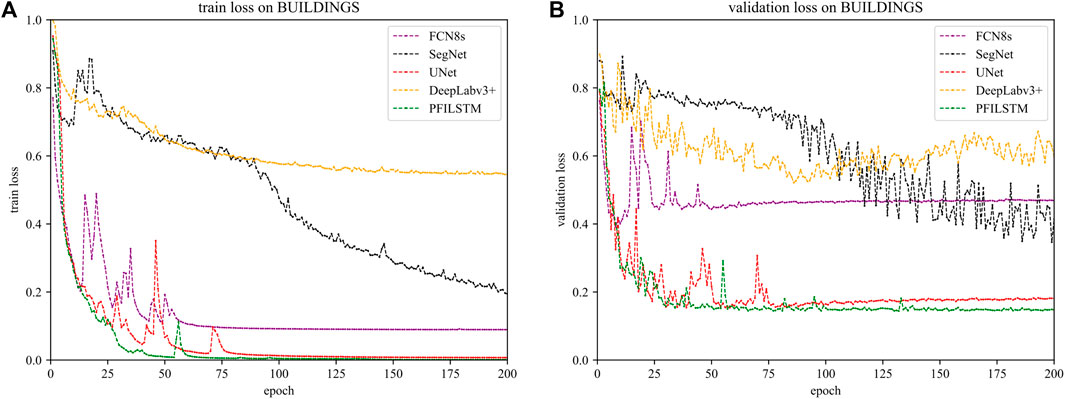
FIGURE 11. The loss of training processes (A) and verification process (B) on the BUILDINGS dataset.
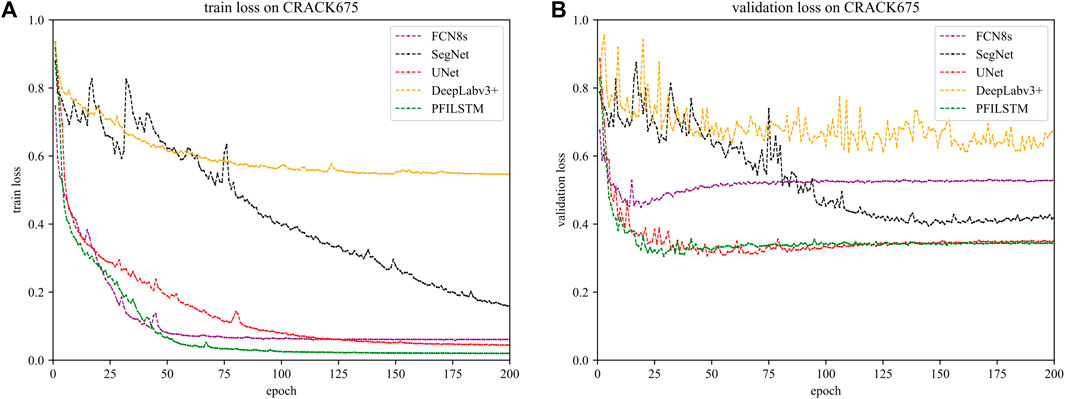
FIGURE 12. Training (A) and verification (B) loss on the CRACK675 dataset for each model.
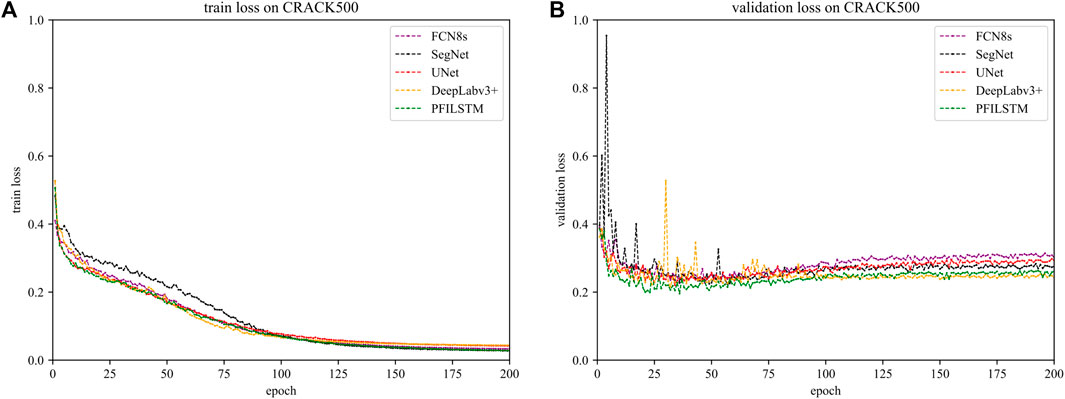
FIGURE 13. Training (A) and verification (B) on the training of each model on the CRACK500 dataset.
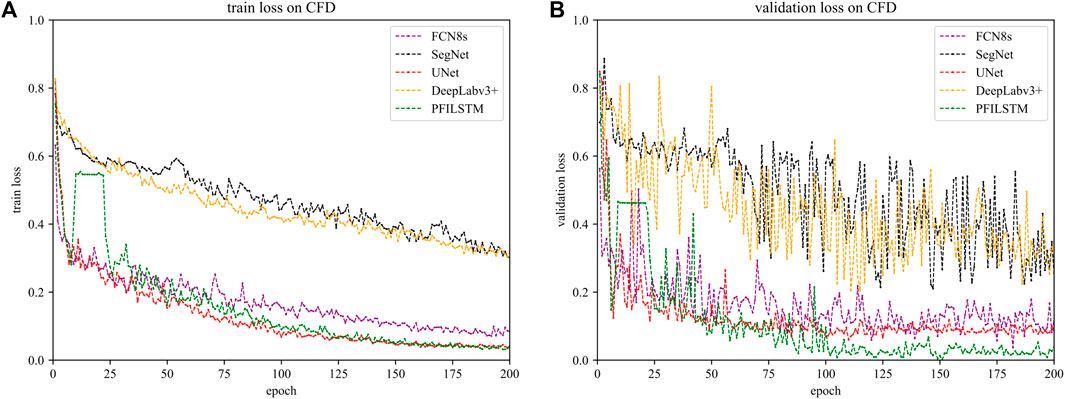
FIGURE 14. Training (A) and verification (B) loss of each model on CFD datasets.
It can be seen from Figure 11 that on the Buildings dataset, after 200 rounds of iteration, in contrast, the UNET model and the PFILSTM model training loss have fallen to a very low, but the PFILSTM model has the lowest verification loss. The training loss of the SEGNET model continues to decline. The DeepLabv3+ model is the model with the highest training loss and verification loss.
It can be seen from Figure 12A that on the CRACK675 dataset, the FCN8S model and the PFLSTM model reached fit in about 50 rounds of training, and the training loss and verification loss will be slowly reduced. To converge, the SEGNET model still has a downward trend after 200 rounds of training, but the validation loss curve does not change after 125 training rounds. It can also be seen from Figure 12B that although the training loss is relatively low, the verification loss is relatively high. This is not an overfitting phenomenon, because the verification loss and training loss curve of the FCN8S model are synchronized. In the first 40 rounds of model training, both training loss and validation loss are declining, and there is not much fluctuation afterward. The reason for this phenomenon may be that it is not uniform when dividing the dataset. There is a large gap between the distribution of training images and verification images, resulting in the FCN8S model not learning the relevant characteristics of the test set image from the training set. The PFILSTM and UNET models have low final training loss and verification loss. In contrast, PFILSTM performance is better.
It can be seen from Figure 13 that on the CRACK500 dataset, the training loss curve and verification loss curve change of the five models in the experiment are the same. SegNet verified that the loss fluctuated in the first 10 rounds of training, and the DeepLabv3+ model also appeared. It can be speculated that this was caused by a slightly higher initial learning rate because, after 25 rounds and 100 rounds of training, all models were verified. The average losses on the set and the training set have almost no significant fluctuations.
It can be seen from Figure 14 that the verification loss of the FCN8S model on the CFD dataset is also declining. It is speculated that the reason for this phenomenon is that the number of images in the CFD dataset is small and the style is relatively singular, while the CRACK675 dataset is composed of three types of datasets with a large number and changing style. Therefore, the FCN8S model can easily learn the relevant features from the training set image of the CFD dataset to fit the verification set. The volatility of the verification of the loss curve becomes larger because the number of images of the CFD dataset is too small. After 200 rounds of training, the UNET and PFILSTM models are the lowest in training. The loss of PFLSTM model is the lowest, which verifies that its strongest detection ability.
4.7 Result analysis
Figures 15–18 lists some of the prediction results on the models on the Buildings, Crack675, Crack500, and CFD datasets, and the performance of each model is judged according to subjective intuition and experience.
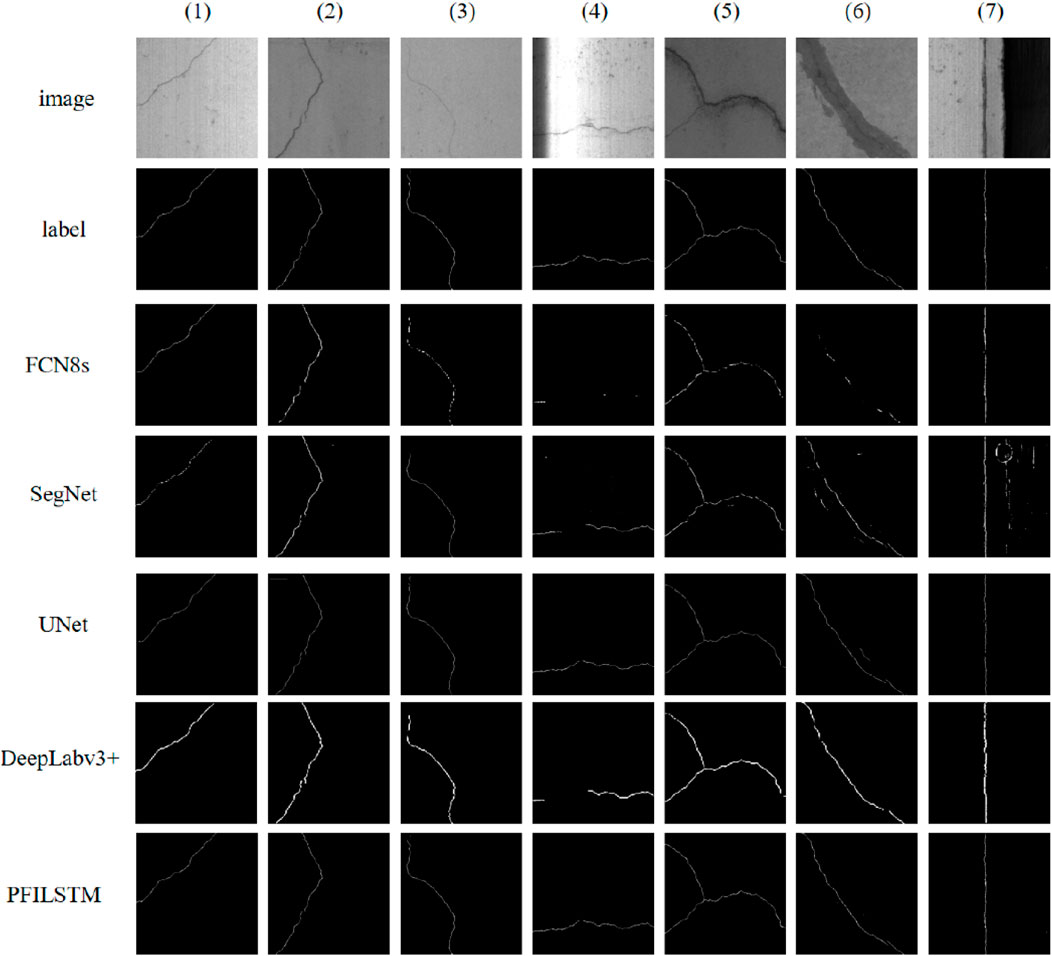
FIGURE 15. Part of the prediction results of each model on the Buildings dataset.
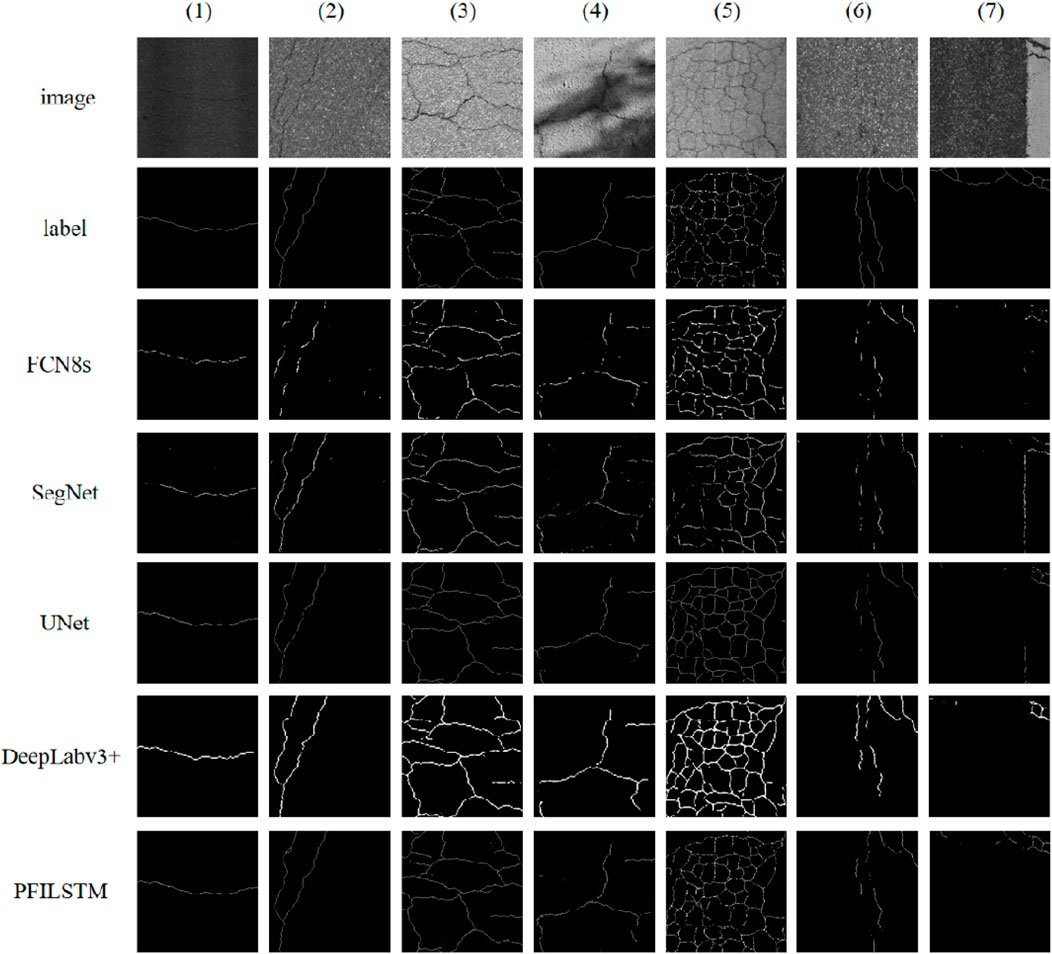
FIGURE 16. Part of the prediction results of each model on the Crack675 dataset.
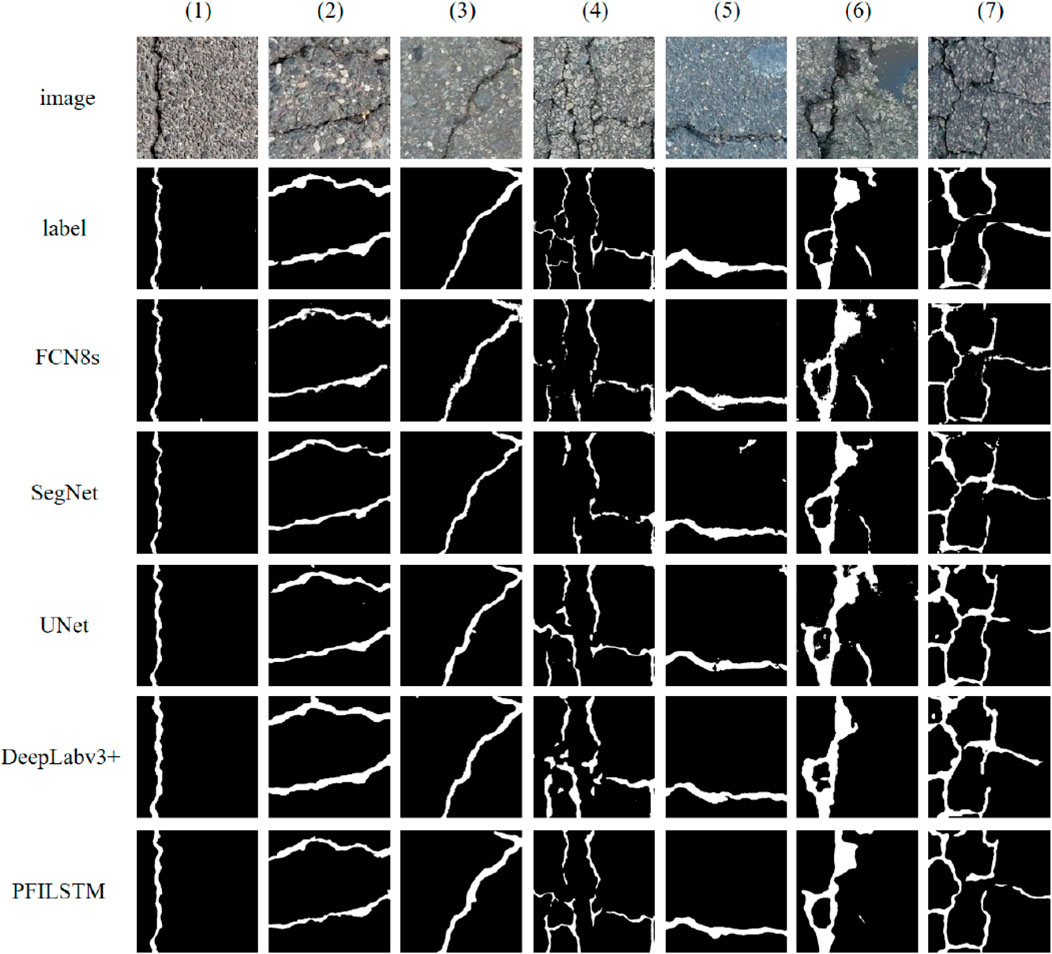
FIGURE 17. Partial predictions of each model on the CRACK500 dataset.
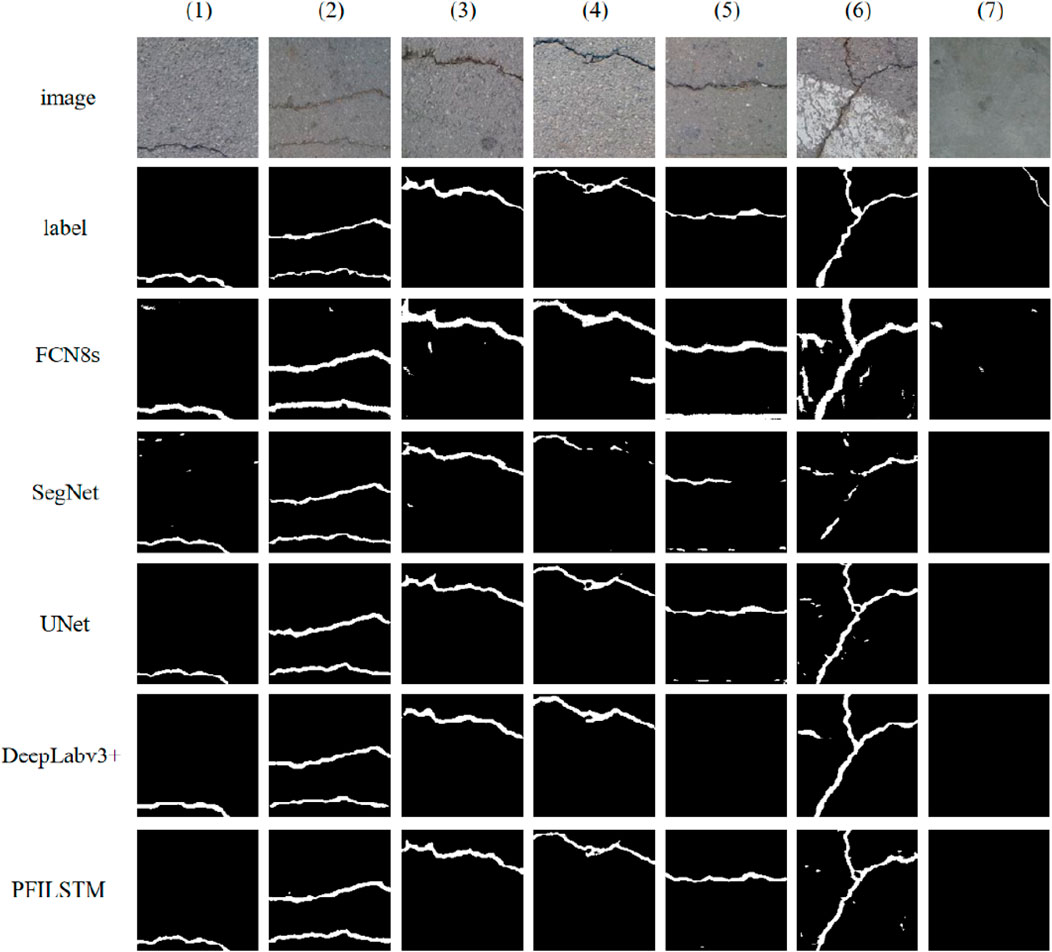
FIGURE 18. Partial predictions for each model on a CFD dataset.
In Figure 15, the FCN8S model leaks more cracks, especially in images 4 and 6. The SegNet model also leaks prediction in the fourth column, but its main problem is that it is easy to be disturbed. The interference identification is identified as cracks on the images in columns 6 and 7. The UNET model has a few predictions error on the column 6 images. DeepLabv3+ models have not all the cracks are predicted on the fourth column image, and the PFILSTM model predicts all cracks.
The FCN8s model’s predictions are found to be deficient in crack representation, thereby overlooking numerous intricate details of the cracks. This could potentially be attributed to the model’s approach when handling complex scenarios such as concrete cracks. It employs multiple rounds of downsampling and upsampling, which diminishes the resolution of the output image. This results in a loss of detailed information about the cracks and introduces a blurring effect. Furthermore, the model’s convolutional network structure might have an inadequate receptive field size, hindering its ability to perform precise segmentation. Consequently, the model’s predictions suggest a lack of sufficient learning of crack characteristics, rendering it incapable of identifying all the detailed features of the cracks in the image.
The prediction results of the SegNet model exhibit more noise compared to other models, which could be a detrimental effect of “up-pooling.” Given the uneven surface of concrete roads and the presence of disturbances such as stains and shadows that are not cracks, these pseudo-cracks interfere with the neural network’s learning of correct crack features during the model’s learning process. This ultimately leads to the model learning some noise features and making predictions based on them. The encoder of the SegNet model is likely to “store” some noise locations during pooling, and subsequent sampling operations use these locations to restore the resolution of the image. Therefore, this model cannot effectively filter out the noise in the image, ultimately learning the features of the noise and displaying them in the prediction result map.
The prediction results of the UNET model lack a few cracks, but roughly determine the location of all cracks in the image.
The Crack675 dataset is a dataset composed of three datasets and the visual gaps between each model can be seen in Figure 16.
The prediction results of the DeepLabv3+ model are wider than the cracks in the label image. This analysis may have occurred because the decoder uses four times the sampling four consecutive times, causing the model to lose the detailed information on the crack edge.
From a subjective perspective, the prediction results of the PFILSTM model are generally better than the prediction results of all other models: in the first column image with lower brightness, all models can accurately predict the position of the crack; the FCN8S model is the only one that did not completely predict the cracks; the fourth column is an image of a crack with shadows. Apart from the PFILSTM model, none of the other models were able to successfully predict this image. Interestingly, the crack in the sixth column is so subtle that it is even unrecognizable to the human eye, yet all models managed to predict the location of the crack to some extent. In the seventh column image, both the SegNet model and the UNET model incorrectly predicted the presence of cracks in the sidewalk image where there were none. In contrast, the PFILSTM model predicts all the cracks, except for the cracks in columns 6 and 7 of the image there are some that are not fully predicted.
In Figure 17, all models have leakage prediction on the images in column 4, but the PFILSTM model has the least number of cracks predicted by leakage. The SegNet model predicted significant noise in the upper right of the image in column 5 under the influence of interferers; the DeepLabv3+ model and the PFILSTM model did not predict the crack in the lower right corner of the image in column 6; the cracks predicted by the PFILSTM model in the seventh column mesh image have stronger continuity.
In Figure 18, the FCN8s and SegNet models predicted more noise. The UNet model also showed noise on the predictions of images in columns 5 and 6; the FCN8s model predicts the interference under the image in column 5 as a crack; in column 6, although all models are affected by sidewalks, making the predictions noisy, the PFILSTM model gives the clearest predictions and the least interference. None of the models accurately predicted cracks in the seventh column image, which may be because the CFD dataset is too small.
The qualitative analysis above is a subjective evaluation. Figure 19 shows the precision-recall curve (PR curve) for each model on the four datasets. The closer the PR curve is to the upper right corner of the table, the larger the area enclosed by the coordinate axis, which represents the better the overall performance of the model.
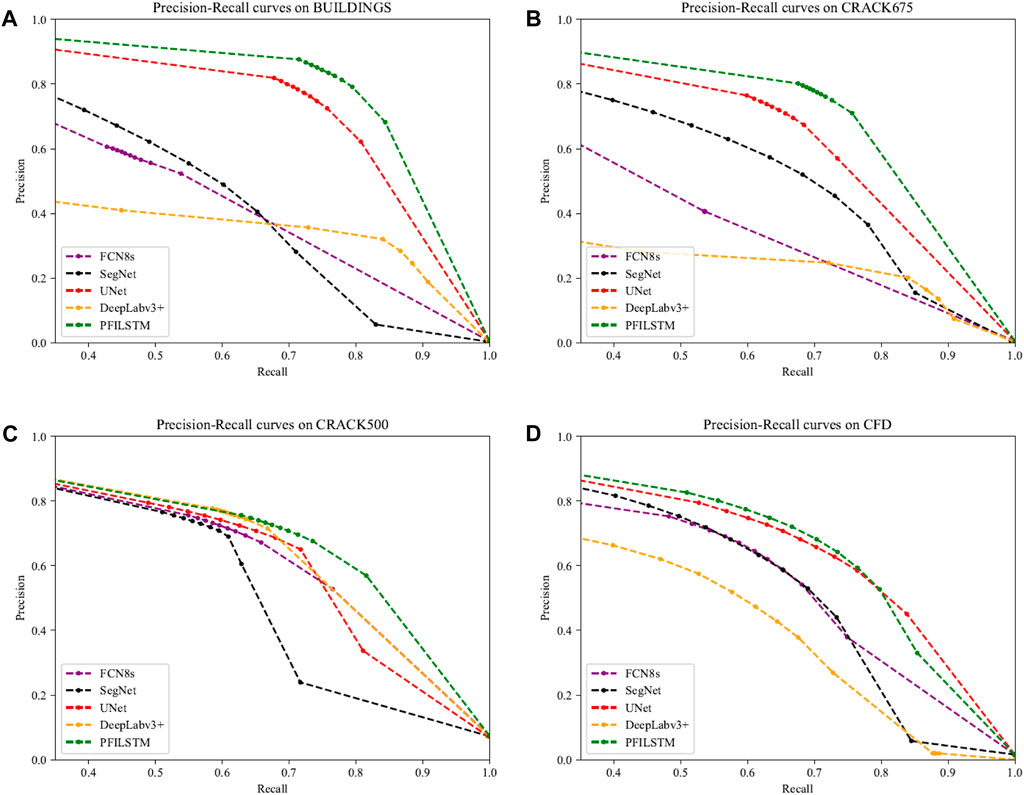
FIGURE 19. PR curves for each model on the four data sets.
In Figure 19, the PFILSTM model presented in this paper shows the greatest advantage, and the PR curves on the four datasets of the experiment are the closest to the upper right corner of the table, indicating that its performance is the best in the comparison model. In addition, the PR curves of the DeepLabv3+ model in Figures 19A, B are closest to the axes, which indicates poor performance. However, as can be seen from Figures 15, 16, the DeepLabv3+ model accurately predicts the location of the crack, but it is wider than the crack on the label, which results in a high recall, low accuracy, and therefore low overall performance, which is supported by the distribution of the individual data points in the graph. On the CRACK500 dataset with wide cracks, it can be seen from Figure 19C that the DeepLabv3+ model also performs well. In Figure 19D, it can be seen that the PR curves of the UNet model and the PFILSTM model are relatively close, so their performance is not far different on the CFD dataset.
Table 4 shows the accuracy, precision, recall, F1 score, and mIoU data of the four datasets: FCN8s, SegNet, UNet, DeepLabv3+, the PFILSTM model proposed in this paper, as well as the models from the literature (Cao et al., 2020; Xiang et al., 2020; Zhu et al., 2022; Qu et al., 2022), using the same evaluation indices and datasets.
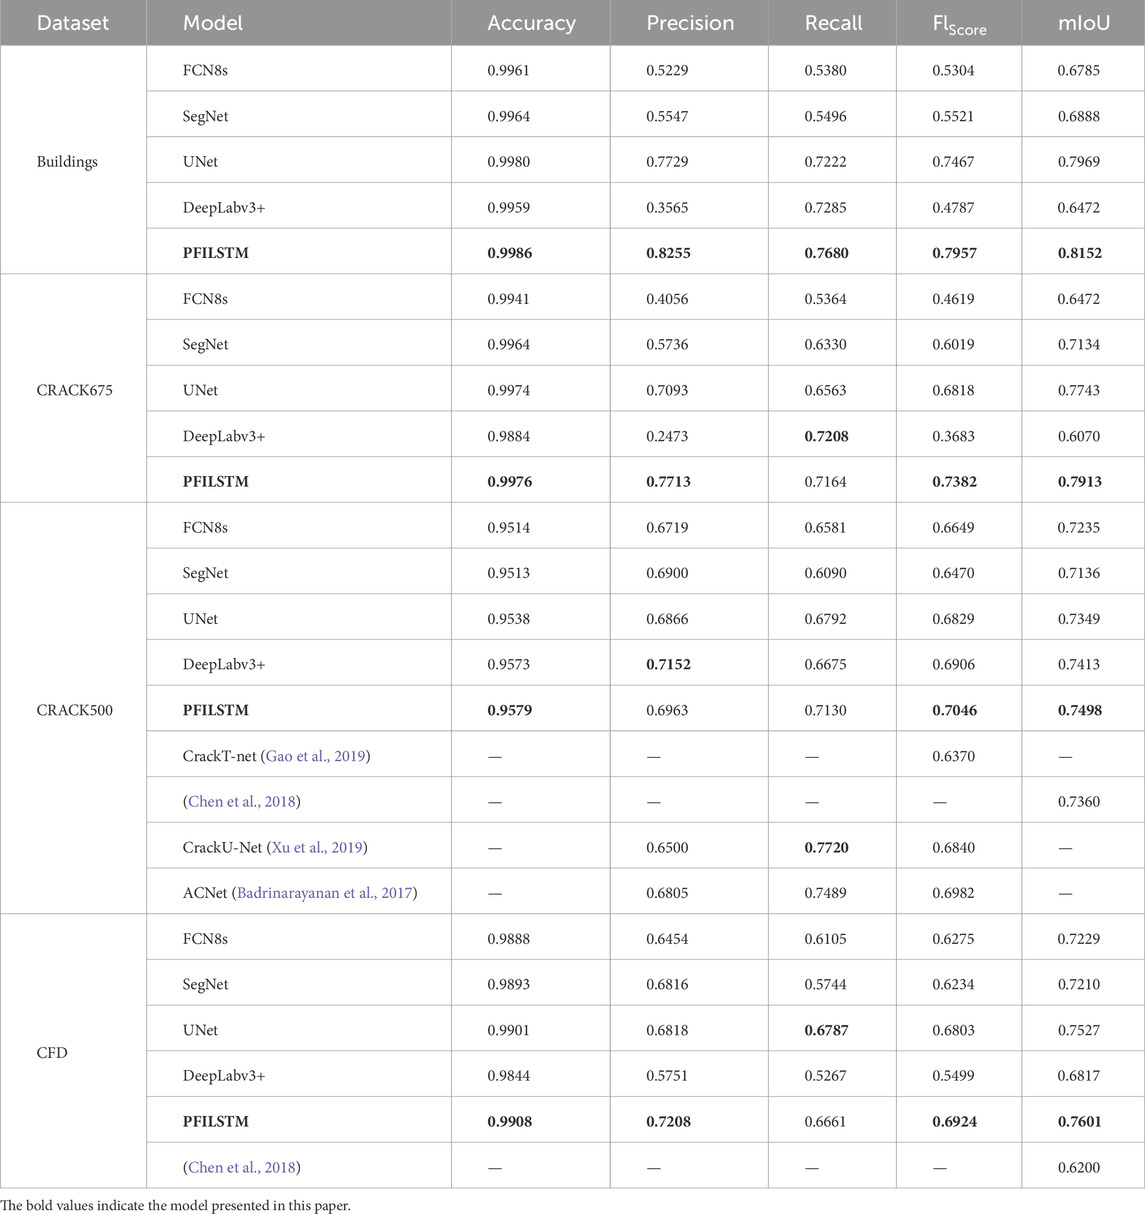
TABLE 4. Experimental results for each model on four datasets.
As can be seen from Table 4, the PFILSTM model proposed in this paper is optimal for both the F1score and mIoU on the four datasets. On the CRACK675 dataset, the F1score and mIoU of the PFILSTM model reached 0.7382 and 0.7913, respectively, which is 8.27% and 2.20% higher than the next highest UNet model, respectively. On the CRACK500 dataset, the F1score and mIoU of the PFILSTM model reached 0.7046 and 0.7498, respectively, which is 2.03% and 1.15% higher than the next highest DeepLabv3+ model, respectively. On the CFD dataset, the PFILSTM model F1score and mIoU reached 0.6924 and 0.7601, respectively, which is 1.78% and 0.98% higher than the next highest UNet model, respectively.
Compared with other methods of researchers using the same evaluation index and dataset, the F1score of the PFILSTM model is improved by 10.61% compared with the CrackT-Net (Qu et al., 2022) on the CRACK500 dataset. Compared with the literature (Xiang et al., 2020), the mIoU of the PFILSTM model is improved by 1.88%.
Compared to the CrackU-Net (Zhu et al., 2022), the F1score of the PFILSTM is 3.01% better. Compared to the ACNet (Cao et al., 2020), the F1score of the PFILSTM model is improved by 0.92%. Compared to the CrackU-Net (Zhu et al., 2022), 𝐹1𝑠𝑐𝑜𝑟𝑒 is 3.01% higher. Compared to the ACNet (Cao et al., 2020), the F1score of the PFILSTM model is 0.92% higher.
On the CFD dataset, the mIoU of the PFILSTM model increased by 22.60% compared to the literature (Xiang et al., 2020). On the BUILDINGS dataset, the F1score and mIoU of the PFILSTM model reached 0.7957 and 0.8152, respectively, which is 6.56% and 2.30% higher than the next highest UNet model, respectively.
It can also be seen from the table that the UNet model is suboptimal on the three datasets, the CRACK675, CFD, and BUILDINGS. The FCN8s model and DeepLabv3+ model are more suitable for the CRACK500 datasets, but their performance on other datasets is not good. The performance of the SegNet model does not have many bright spots.
Comprehensive analysis of experimental comparison results shows that the PFILSTM model designed in this paper can learn better crack features and can better eliminate the influence of interference factors in the image, which is a great improvement on the problems of the low recognition accuracy and poor robustness in existing studies.
5 Conclusion
Focusing on the problems of low accuracy and poor robustness in existing building crack identification research, this paper proposes a PFILSTM model. Based on the “U" model, the model introduces the advantages of long short-term memory mechanisms and pyramid features, uses the memory mechanisms to learn the correlation between features at all levels of the image, optimizes the crack feature information, screens the interference feature information, and then uses the pyramid feature to further integrate the multi-scale context information, so that the final semantic segmentation result is better.
To test the effect of the PFILSTM model, the comparison experiments with the FCN8s, SegNet, UNet, DeepLabv3+, and literature (Cao et al., 2020; Xiang et al., 2020; Zhu et al., 2022; Qu et al., 2022) models were completed on three public datasets and one private dataset, and the qualitative and quantitative analysis results showed that the PFILSTM model had the best effect.
As for the CFD and CRACK500 datasets, the effect of the PFILSTM model does not differ from other models, indicating that there is still room for improvement in the model designed in this paper, and this problem will continue to be studied in the future.
Data availability statement
The original contributions presented in the study are included in the article/Supplementary Material, further inquiries can be directed to the corresponding authors.
Author contributions
BC: Writing–original draft, Funding acquisition. MF: Writing–original draft. KL: Writing–review and editing. YG: Writing–original draft. YW: Writing–review and editing. YC: Validation, Writing–review and editing. SY: Writing–review and editing. JS: Writing–review and editing.
Funding
The author(s) declare financial support was received for the research, authorship, and/or publication of this article. This work was supported by the Fund of National Engineering and Research Center for Mountainous Highways (GSGZJ-2022-04), Key Laboratory of Wind Resistance Technology of Bridge Structure and Transportation Industry (Tongji University) open project (KLWRTBMC22-01), Chongqing Construction Science and Technology Plan Project (2023-0069), Water Resources Science and Technology Program of Hunan Province (XSKJ2023059-32), and National Science Foundation of China (60272091, 60373109, and 51808075).
Conflict of interest
The authors declare that the research was conducted in the absence of any commercial or financial relationships that could be construed as a potential conflict of interest.
The reviewer XL declared a shared affiliation with the author KL to the handling editor at the time of review.
Publisher’s note
All claims expressed in this article are solely those of the authors and do not necessarily represent those of their affiliated organizations, or those of the publisher, the editors and the reviewers. Any product that may be evaluated in this article, or claim that may be made by its manufacturer, is not guaranteed or endorsed by the publisher.
References
Asadi Shamsabadi, E., Xu, C., Rao, A. S., Nguyen, T., Ngo, T., and Dias-da-Costa, D. (2022). Vision transformer-based autonomous crack detection on asphalt and concrete surfaces. Automation Constr. 140, 104316, 104316. doi:10.1016/j.autcon.2022.104316
Badrinarayanan, V., Kendall, A., and Cipolla, R. (2017). Segnet: a deep convolutional encoder-decoder architecture for image segmentation. IEEE Trans. pattern analysis Mach. Intell. 39 (12), 2481–2495. doi:10.1109/tpami.2016.2644615
Berman, M., Triki, A. R., and Blaschko, M. B. (2018). “The lovasz-softmax loss: a tractable surrogate for the optimization of the intersection-overunion measure in neural networks,” in IEEE/CVF Conference on Computer Vision and Pattern Recognition, Salt Lake City, UT, USA, 18-23 June 2018 (IEEE), 4413–4421.
Cao, J., Yang, G., and Yang, X. (2020). Deep learning pavement crack detection based on attention mechanism. J. Computer-Aided Des. Comput. Graph. 32 (8), 10. doi:10.1109/AEECA55500.2022.9918950
Chen, L. C., Papandreou, G., Kokkinos, I., Murphy, K., and Yuille, A. L. (2017). Deeplab: semantic image segmentation with deep convolutional nets, atrous convolution, and fully connected crfs. IEEE Trans. pattern analysis Mach. Intell. 40 (4), 834–848. doi:10.1109/tpami.2017.2699184
Chen, L. C., Zhu, Y., and Papandreou, G. (2018). “Encoder-decoder with atrous separable convolution for semantic image segmentation,” in The European Conference on Computer Vision (Spinger), 801–818. doi:10.1007/978-3-030-01234-2_492
Cuilimeng (2023). CrackForest dataset. Avaliable at: https://github.com/cuilimeng/CrackForest-dataset.
Deng, L., Chu, H., and Long, L. (2023). Review of crack detection in civil infrastructure based on deep learning. China J. Highw. Transp. 36 (2), 1–21. doi:10.3969/j.issn.1001-7372.2023.02.001
Gao, C., Yan, J., Zhou, S., Varshney, P. K., and Liu, H. (2019). Long short-term memory-based deep recurrent neural networks for target tracking. Inf. Sci. 502, 279–296. doi:10.1016/j.ins.2019.06.039
Jieh-Haur, C., Su, M.-C., Cao, R., Hsu, S.-C., and Lu, J.-C. (2017). A self organizing map optimization based image recognition and processing model for bridge crack inspection. Automation Constr. 73, 58–66. doi:10.1016/j.autcon.2016.08.033
Kingma, D. P., and Ba, J. (2015). Adam: a method for stochastic optimization. arXiv. doi:10.48550/arXiv.1412.6980
Labelme (2023). Wkentaro. Avaliable at: https://github.com/wkentaro/labelme/releases.
Lau, S. L., Chong, E. K., Yang, X., and Wang, X. (2020). Automated pavement crack segmentation using u-net-based convolutional neural network. IEEE Access 8, 114892–114899. doi:10.1109/access.2020.3003638
Li, G., Zhao, X., Du, K., Ru, F., and Zhang, Y. (2017). Recognition and evaluation of bridge cracks with modified active contour model and greedy search-based support vector machine. Automation Constr. 78, 51–61. doi:10.1016/j.autcon.2017.01.019
Lin, T. Y., Dollár, P., and Girshick, R. (2017). “Feature pyramid networks for object detection,” in 2017 IEEE Conference on computer vision and pattern recognition, Honolulu, HI, USA, 21-26 July 2017 (IEEE), 2117–2125.
Liu, J., Wang, Z., and Xu, M. (2020). DeepMTT: a deep learning maneuvering target-tracking algorithm based on bidirectional LSTM network. Inf. Fusion 53, 289–304. doi:10.1016/j.inffus.2019.06.012
Liu, W., Anguelov, D., and Erhan, D. (2016). “SSD: single shot multibox detector,” in Proceedings, Part I computer vision–ECCV 2016: 14th European conference (Amsterdam, The Netherlands: Spinger), 21–37.
Liu, Y., Justin, K., and Yeoh, W. (2021). Automated crack pattern recognition from images for condition assessment of concrete structures. Automation Constr. 128, 103765. doi:10.1016/j.autcon.2021.103765
Liu, Z., Gu, X., Chen, J., Wang, D., Chen, Y., and Wang, L. (2023). Automatic recognition of pavement cracks from combined GPR B-scan and C-scan images using multiscale feature fusion deep neural networks. Automation Constr. 146, 104698, 104698. doi:10.1016/j.autcon.2022.104698
Long, J., Shelhamer, E., and Darrell, T. (2015). Fully convolutional networks for semantic segmentation[C]. IEEE Conf. Comput. Vis. pattern Recognit. 2015, 3431–3440. doi:10.1109/CVPRW.2017.156
Milletari, F., Navab, N., and Ahmadi, S. A. (2016). “V-net: fully convolutional neural networks for volumetric medical image segmentation,” in 4th International Conference on 3D Vision (3DV), Stanford, CA, USA, 25-28 October 2016 (IEEE), 565–571.
Qu, Z., Li, Y., and Zhou, Q. (2022). Crackt-net: a method of convolutional neural network and transformer for crack segmentation. J. Electron. Imaging 31 (2), 23040. doi:10.1117/1.JEI.31.2.023040
Ronneberger, O., Fischer, P., and Brox, T. (2015). “U-net: convolutional networks for biomedical image segmentation,” in Medical Image Computing and Computer-Assisted Intervention—MICCAI (Spinger), 234–241. doi:10.1007/978-3-319-24574-4_28
Stollenga, M. F., Byeon, W., and Liwicki, M. (2015). “Parallel multi-dimensional LSTM, with application to fast biomedical volumetric image segmentation,” in The 28th International Conference on Neural Information Processing Systems (ACM), 2998–3006. doi:10.1007/978-3-319-24574-4_282
Xiang, X., Zhang, Y., and El Saddik, A. (2020). Pavement crack detection network based on pyramid structure and attention mechanism. IET Image Process. 14 (8), 1580–1586. doi:10.1049/iet-ipr.2019.0973
Xu, F., Ma, H., and Sun, J. (2019). “LSTM multi-modal unet for brain tumor segmentation,” in 4th international conference on image, vision, and computing (ICIVC), Xiamen, China, 05-07 July 2019 (IEEE), 236–240.
Yang, F., Zhang, L., Yu, S., Prokhorov, D., Mei, X., and Ling, H. (2019). Feature pyramid and hierarchical boosting network for pavement crack detection. IEEE Trans. Intelligent Transp. Syst. 21 (4), 1525–1535. doi:10.1109/tits.2019.2910595
Yu, F., and Koltun, V. (2016). Multi-scale context aggregation by dilated convolutions. arXiv. doi:10.48550/arXiv.1511.07122
Zhao, H., Shi, J., and Qi, X. (2017). “Pyramid scene parsing network,” in 2017 IEEE Conference on computer vision and pattern recognition, Honolulu, HI, USA, 21-26 July 2017 (IEEE), 2881–2890.
Zhu, Y., Wang, H., and Li, K., (2022). A High-precision pavement crack detection network structure:crack U-Net. Comput. Sci. 49 (01), 204–211. doi:10.7544/issn1000-1239.2022.20210122
Keywords: crack detection, deep learning, neural network, image segmentation, PFILSTM
Citation: Chen B, Fan M, Li K, Gao Y, Wang Y, Chen Y, Yin S and Sun J (2024) The PFILSTM model: a crack recognition method based on pyramid features and memory mechanisms. Front. Mater. 10:1347176. doi: 10.3389/fmats.2023.1347176
Received: 30 November 2023; Accepted: 26 December 2023;
Published: 14 February 2024.
Edited by:
Yang Zou, Chongqing Jiaotong University, ChinaReviewed by:
Xiaohua Li, Chongqing University, ChinaKun Xu, Beijing University of Technology, China
Lei Yan, Central South University, China
Copyright © 2024 Chen, Fan, Li, Gao, Wang, Chen, Yin and Sun. This is an open-access article distributed under the terms of the Creative Commons Attribution License (CC BY). The use, distribution or reproduction in other forums is permitted, provided the original author(s) and the copyright owner(s) are credited and that the original publication in this journal is cited, in accordance with accepted academic practice. No use, distribution or reproduction is permitted which does not comply with these terms.
*Correspondence: Mingyu Fan, ZmY5OEAxNjMuY29t; Ke Li, a2VsaS1icmlkZ2VAY3F1LmVkdS5jbg==