 Ying Xu1,2
 Zhongyi Zhang
 Jinjin Ge
94% of researchers rate our articles as excellent or good
Learn more about the work of our research integrity team to safeguard the quality of each article we publish.
Find out more
ORIGINAL RESEARCH article
Front. Mater. , 15 January 2024
Sec. Mechanics of Materials
Volume 10 - 2023 | https://doi.org/10.3389/fmats.2023.1338348
In this study, through a series of static mechanical tests and split Hopkinson pressure bar (SHPB) dynamic impact tests, the static and dynamic mechanical parameters of yellow sandstone are determined, and the Holmquist–Johnson–Cook model parameters of the rock are determined by the test data and theoretical calculation. The feasibility of a numerical model is verified, based on which the SHPB impact process under different axial pressure is subjected to numerical analysis. The results show that with increasing impact load, the degree of rock breakage increases, and the dynamic compressive strength and dynamic elastic modulus increase continuously. With the application and increase of axial pressure, the dynamic compressive strength and dynamic elastic modulus of the rock decrease gradually under the same impact load, and the maximum cumulative strain keeps increasing, indicating that under the influence of axial pressure, micro-cracks in the rock have initially developed and expanded. With increasing axial pressure, the rock is more vulnerable to breakage, and its weakening degree keeps increasing. The energy utilization rate of one-dimensional dynamic and static combined loading is affected by the axial compression ratio and impact load. At low axial compression ratio, the rock has high impact resistance but high energy utilization rate; at high axial compression ratio, the rock has low impact resistance but low energy utilization rate. Therefore, the combination of axial compression ratio and impact velocity can improve the crushing effect and energy utilization rate on the premise of clear crushing form requirements.
In the field of mining engineering, researchers have long been concerned with the problem of rock fragmentation. Currently, the method used most commonly for breaking rocks is explosive blasting, which is cheap, simple, and likely to dominate for a long time to come (Wang et al., 2022). By contrast, mechanical rock breaking is expensive and suitable for crushing only soft rocks, not hard ones; it is characterized by low working efficiency, high mechanical equipment loss, and high economic cost, which is why blasting is the main rock-breaking method for mining engineering now and likely in the future (Gan et al., 2019).
As shallow resources is depleted, it becomes imperative for mining projects to go deeper (Ranjith et al., 2017). Deep rock masses are in a unique environment characterized by the so-called three highs and one disturbance, i.e., high in-situ stress, high temperature, high karst water pressure, and intense mining disturbance. Unlike a shallow rock mass, the fracture process of a deep rock mass under dynamic load is largely dependent on its ground stress environment. At the same time, due to the unique mechanical environment, the deep rock mass is also facing the threat of rock burst and rock burst, so it is particularly important to deeply study the mechanical characteristics of deep rock mass under dynamic load (Luo et al., 2023a; Luo et al., 2023b). In response to this problem, as early as 1972 (Christensen et al., 1972), proposed the influence of confining pressure on rock impact dynamics tests, and since then there has been much research and many gratifying results. In the blasting excavation design of an underground hydropower station (Lu et al., 2012), found that when the crustal stress exceeds 10–12 MPa, the blasting scheme designed for shallow rock masses is no longer applicable, indicating again that the high ground stress of deep rock masses cannot be ignored.
To explore further the dynamic mechanical properties and fracture characteristics of rocks under the coupled influence of crustal stress and explosion load (Zhang et al., 2020), conducted blasting tests under static stress on sandstone samples by means of a servo press, and by combining high-speed photography and digital image correlation technology, they studied how the static stress influenced the evolution of the specimen surface strain field and the law governing crack propagation. (Yi et al., 2018) used a theoretical model to explain the mechanism whereby crustal stress influences blasting crack growth, and they carried out numerical simulations of four cases under different crustal stress conditions; it was found that crack growth was controlled by explosion load near the hole, while high crustal stress affected crack growth in the far field. (He and Yang, 2018) used a static–dynamic loading test device and a high-speed camera to study the deformation characteristics of deep rocks under the action of blasting, and they obtained the strain field and crack propagation of rocks under confining pressure. (Zheng et al., 2024) found that the damage to the loaded rock increased as the load increased, and the growth rate reached the maximum in the plastic deformation and failure stages, which provides a reference for the study of dynamic failure of rock under preload.
To investigate comprehensively the coupled effects of crustal stress and blasting load, it is first necessary to clarify the dynamic mechanical characteristics and crushing effect of rock masses under different horizontal confining pressures. Furthermore, considering the inherent properties of rock formations, it is essential to establish an accurate load model for deep rock and elucidate the interaction mechanisms pertaining to energy storage and the dissipation of interfering energy within the rock matrix. This comprehensive understanding will allow for deep understanding of both the static load-induced dynamic mechanical properties of rock and the intricacies of rock blasting mechanisms (Zhu et al., 2016). As we all know, rock blasting is a dynamic process at high strain rate, because of the complexity of rock blasting, it is very difficult to obtain the dynamic mechanical parameters of materials by explosion test, so the split Hopkinson pressure bar (SHPB) has been used widely to study the dynamic mechanical properties of deep rock masses and has produced fruitful results (Li et al., 2008; Bailly et al., 2011; Omidvar et al., 2012; Yin et al., 2016).
Based on the above analysis, it can be seen that the improved SHPB device is currently used to carry out relevant research mainly on the tendency, occurrence mechanism and dynamic criterion of rock burst in deep rocks. Some scholars have used the improved SHPB test device to carry out research on rock breakage with various kinds of rocks as research objects. As rock blasting is a high strain rate failure process, it is difficult for experimental devices to achieve such a high strain rate loading and apply a high level of ground stress, so there are few studies in this field. To lay a foundation for studying the laws governing deep rock blasting, this paper takes yellow sandstone as the research object and uses numerical simulations to explore in depth the dynamic mechanical parameters of rock samples and the law linking energy dissipation with axial compression ratio, and it provides a novel and effective method for researching the dynamic mechanical characteristics of deep rock.
Yellow sandstone with good integrity and homogeneity was selected as the research object, and the rock was processed into standard samples according to the method recommended by the International Society of Rock Mechanics (Fairhurst and Hudson, 1999). Uniaxial compression tests were performed on cylindrical specimens (⌀50 mm × 100 mm), and dynamic impact tests were performed on round cake specimens (⌀50 mm × 25 mm). The two ends of a specimen were perpendicular to the axis, the maximum deviation was within 0.25°, and the end surface roughness was less than 0.1 mm. Tables 1, 2 give the results of the static compressive and tensile tests, respectively.

TABLE 1. Results of uniaxial compression tests.
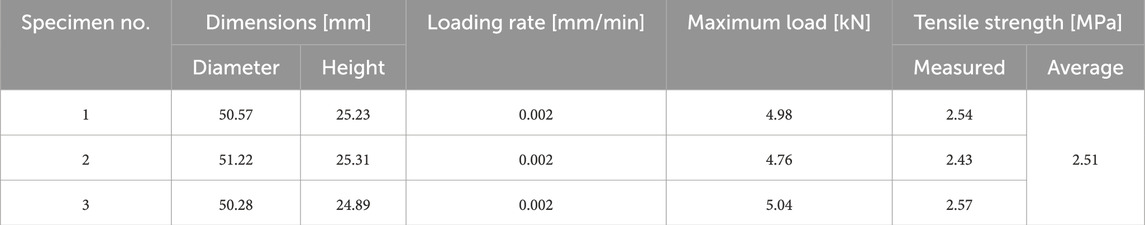
TABLE 2. Results of splitting tensile tests.
The tests were performed using an SHPB apparatus, The impact, incidence, transmission, and absorption rods of the system were all made of 40Cr alloy steel with an elastic modulus of 210 GPa, a Poisson’s ratio of 0.28, and a longitudinal wave velocity of 5,410 m/s. The lengths of the incident and transmission rods were 2,000 mm and 1,500 mm, respectively, and their diameter was 50 mm. The punch was a spindle type that could generate a half-sine stress wave to realize loading with constant strain rate. The acquisition equipment was an SDY2107A super-dynamic strain gauge and a DL850E oscilloscope.
The impact load corresponds to the bullet impact velocity, and the greater the latter, the greater the rock strain rate. From pre-testing of the specimens, five impact loads were determined, i.e., 0.2 MPa, 0.25 MPa, 0.3 MPa, 0.35 MPa, and 0.4 MPa, and three parallel test blocks were set for each air pressure. Before a test, appropriate amounts of Vaseline were applied to the end faces of the incident and transmission rods, and after the test, sample fragments were collected and stored in a marked sealed bag.
To process the test data, the three-wave method (Diyuan et al., 2020; Li et al., 2020) was used to obtain the dynamic mechanical parameters of the specimens during impact compression. The three-wave method are shown in Eqs 1–3
where σ is the stress, ε is the strain,
In the process of impact test, whether the stress balance can be achieved at both ends of the specimen is the key to the success of the test, so it is necessary to verify the stress balance of the specimen. Figure 1 shows the impact waveform and stress balance diagram of the specimen. It can be found that the sum of incident stress and reflection stress of the specimen is almost equal to the transmitted stress, as is the case of other specimens, indicating that the stress balance condition is met. The impact test data are shown in Table 3, in order to save space, only one set of test data for each impact load is listed.
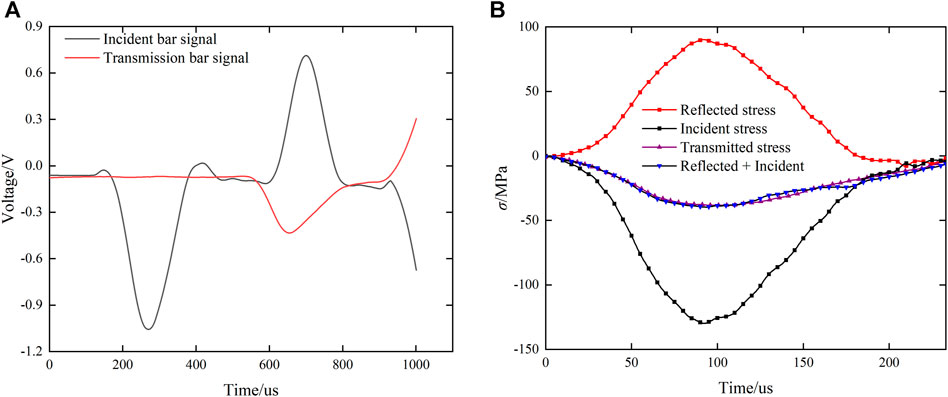
FIGURE 1. Stress balance of the sample: (A) Typical waveform diagram when the impact load is 0.25 MPa; (B) Specimen stress balance verification.
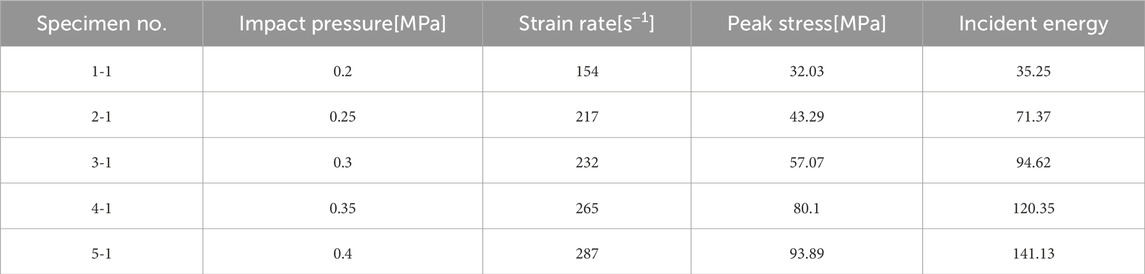
TABLE 3. SHPB test data.
The LS-DYNA finite-element analysis software was used to reconstruct the whole process of sandstone sample failure under SHPB impact. For the modeling, the SolidWorks-3D drawing software and the HyperMesh finite-element pre-processing software were used to establish models and partition grids, and then the LS-PrePost software was used to define keywords. Finally, a solver was used to solve the problem.
The finite-element model was established according to the actual size of the SHPB test system: the lengths of the incident and transmission rods were 2,000 mm and 1,500 mm, respectively, their end diameter was 50 mm, and all the rods were made of 40Cr alloy steel. MAT_ELASTIC constitutive model No. 001 in the LS-DYNA software was used for the material model of the incident and transmission rods, MAT-JOHNSON-HOLMQUIST-CONCRETE constitutive model No. 111 was used for the material model, and the g-cm-us system was used for the model, There is no clear concept of units in LS-DYNA, and all units are self-defined. There are four basic parameters in numerical analysis (length, mass, time and temperature, respectively). Before LS-DYNA calculation, the basic units of these four parameters need to be determined, and then the units of the remaining parameters, such as force, pressure and energy, need to be derived from these four basic units. In the cm-g-us unit system, the unit of pressure is 1e-5 MPa. In order to verify the accuracy of the model, the impact load was simulated by loading the incident waveform on the end face of the incident rod. The numerical calculation model is shown in Figure 2.
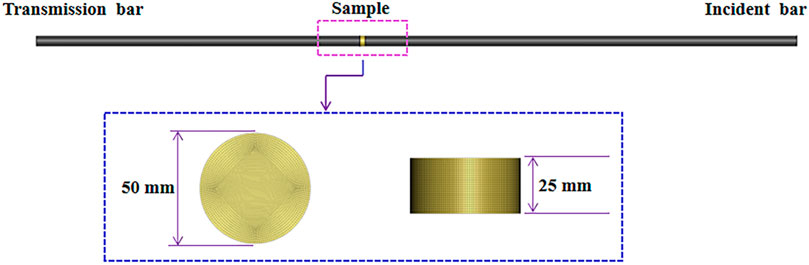
FIGURE 2. SHPB numerical model.
Because the material and end-face size of the incident and transmission rods were the same, those rods were set as one PART, the sample was set as one PART, and the *CONTACT_ERODING_SURFACE_TO_SURFACE erosion contact algorithm was used between them. The rock sample was set as the slave contact surface, and the rod was set as the master contact surface.
The measured sample density was 2.01 g/cm3, and from Tables 1, 2, the sample compressive strength was 24.8 MPa, the tensile strength was 2.51 MPa, the Poisson’s ratio was 0.22, and the elastic modulus was 2.45 GPa. The shear modulus G and bulk modulus K were determined by Eqs 4 and 5
where E is the specimen elastic modulus, giving G = 1.664 GPa and K = 2.42 GPa.
As shown in Figure 3, the Holmquist–Johnson–Cook (HJC) model was used to describe the relationship between hydrostatic pressure P and volumetric strain µ, which is divided into three stages: elastic, plastic, and compaction (Liu et al., 2020). The first stage (OA) is the linear elastic stage (P ≤ Pcrush), when the hydrostatic pressure and volumetric strain are related linearly, such as Eq. 6
where K = Pcrush/µcrush, with Pcrush and µcrush being the elastic-limit hydrostatic pressure and corresponding volumetric strain, respectively. The second stage (AB) is the plastic stage (Pcrush < P < Plock), when the cavities in the material are gradually compressed to produce plastic deformation, and its expression is shown in Eq. 7
where µlock is the volumetric strain corresponding to the compacting hydrostatic pressure Plock. The third stage (BC) is the compaction stage (Plock < P), when the material has been completely destroyed, and its expression is shown in Eq. 8
where
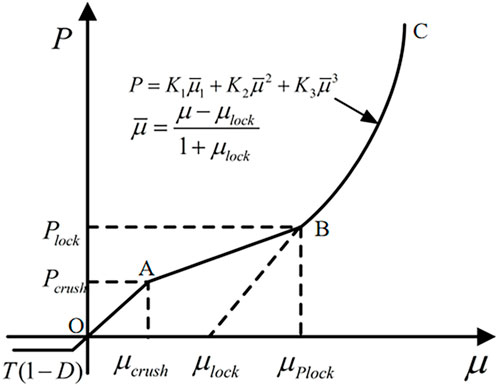
FIGURE 3. Curve of equation of state from Holmquist–Johnson–Cook (HJC) model.
The limit surface of the HJC model is described as a function of damage, strain rate, and hydrostatic pressure (Kong et al., 2016), and its failure surface can be expressed as Eq. 9
where
The damage is usually formed by the accumulation of equivalent plastic strain and plastic volumetric strain, and its evolution equation can be expressed as Eq. 10
where D is the damage factor,
The basic physical and mechanical tests led to the determination of four basic parameters, i.e., fc, ρ, T, and G. According to the theory of plastic yield surfaces, when the damage parameter is D = 0 and the strain rate effect is not considered, we have
Because the model parameter A is obtained from the cohesion force c, i.e., A = c/fc, according to the Mohr–Coulomb strength criterion, c can be obtained by
where θ is the internal friction angle, and σ1 and σ3 are the maximum and minimum principal stresses at static compression failure, respectively. Eq. 12 shows that triaxial compression data are needed to determine the cohesion force c. In this regard, the method proposed by (Pan et al., 2022) is referenced herein. Because the Hoek–Brown criterion is better for describing the strength characteristics of rocks under triaxial compression, the empirical data can be obtained by using the Hoek–Brown empirical formula, i.e.,
where σci is the uniaxial compressive strength, and mb, S, and a are rock-related constants that are generally taken as 24, 1, and 0.5, respectively. Since σ3 is the confining pressure of the triaxial compressive test, the value of σ3 can be set by ourselves, and the compressive strength σ1 under different confining pressures can be obtained according to Eq. 13. After setting different values of σ3, static compressive strength data under different confining pressures can be obtained, Table 4 give presents several sets of data. As shown in Figure 4A, several groups of data in Table 4 are linearly fitted and further combined with Eq. 12, we can get
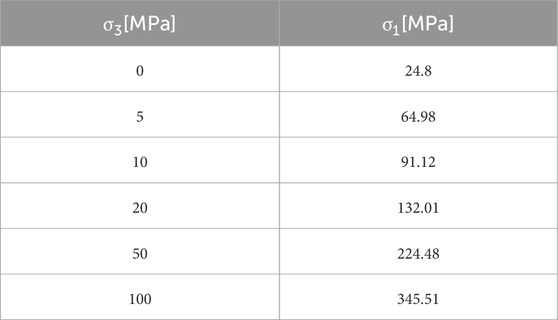
TABLE 4. Triaxial compressive strength under different confining pressures.
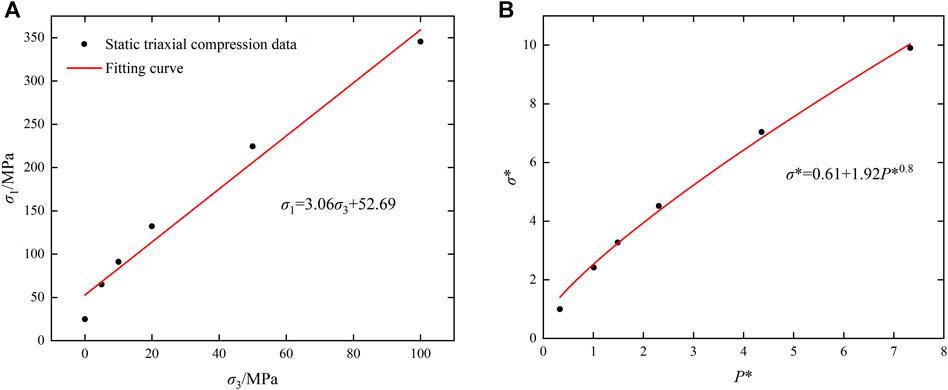
FIGURE 4. Data fitting: (A) Mohr–Coulomb-criterion fitting; (B) Yield-surface fitting.
From Eq. 14, we obtain θ = 30.49°, c = 15.09 MPa, and A = 0.61. Thus, Eq. 11 becomes
Multiple sets of σ*–P* data can be obtained by bringing the above static compressive strength data under different confining pressures into Eqs 15 and (16). As shown in Figure 4B, multiple groups of data were fitted using
The parameter C is a constant related to the strain rate and can be obtained from the previous SHPB and static test data. For uniaxial tests with σ3 = 0, the rock mechanical parameters at different strain rates can be obtained by combining Eqs 15 and (16).
In fact, the change of rock dynamic strength is not only related to strain rate but is also affected by hydrostatic pressure. As shown in Figure 5, we used the method proposed by (Holmquist et al., 1993) to eliminate the influence of hydrostatic pressure. Starting from the maximum normalized tensile strength T*, data points under different strain rates are connected, and then a straight line parallel to the vertical axis is drawn at the constant normalized hydrostatic pressure P* = 1/3. The intersection points of this line and lines with different slopes correspond to the strength of different strain rates under the same normalized hydrostatic pressure P* = 1/3, thus eliminating the influence of hydrostatic pressure. Plotting normalized-strength data points under different strain rates gave C = 0.00108, and the fitting results are shown in Figure 6.
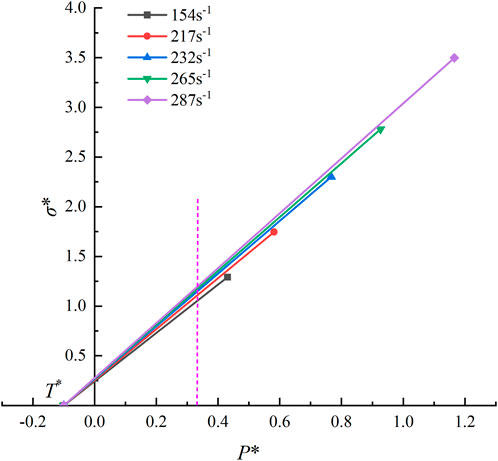
FIGURE 5. Eliminating hydrostatic pressure effects.
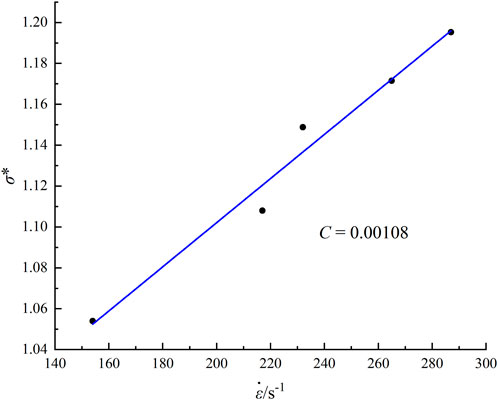
FIGURE 6. Determining parameter C.
(Holmquist et al., 1993) reasoned that the damage parameter has nothing to do with the strength of the material, so the values herein were calculated according to the original literature, i.e., D2 = 1.0 and EFmin = 0.01. Meanwhile, D1 can be calculated by Eq. 17
and we obtain D1 = 0.0375. The pressure parameters Pcrush and µcrush are the hydrostatic pressure and volumetric strain at the elastic limit, respectively, with values of Pcrush = fc/3 = 8.267 MPa and µcrush = Pcrush/K = 0.00566. The parameter µlock represents the volumetric strain at the compaction limit state and can be calculated by Eq. 18
where ρg is the compaction density. The compaction density of the present test samples was 2.15 g/cm3, giving µlock = 0.069.
For rock materials, the values of K1, K2, and K3 come from the test data of (Larson and Anderson, 1980) and are fitted via
TABLE 5. HJC model parameters for sandstone samples.
By referring to the method in Reference (Li et al., 2014), the effectiveness of the model is verified by comparing the waveform obtained by numerical simulation with the test waveform. Figure 7 compares the reflection and transmission waveforms obtained experimentally and numerically under two different values of the impact load, and the corresponding waveforms agree well. Also, Figure 8 shows the stress–strain curves obtained experimentally and numerically under four different values of the air pressures, and the numerical results are quite close to the experimental ones, which also verifies the accuracy of the numerical model in another aspect.
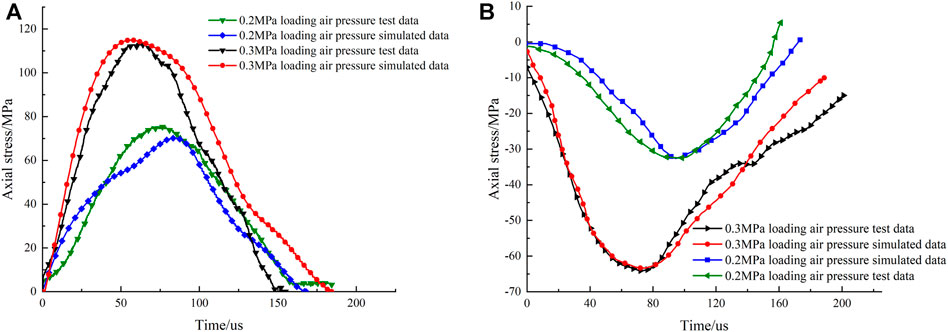
FIGURE 7. Waveform verification: comparison of (A) reflection and (B) transmission waveforms.
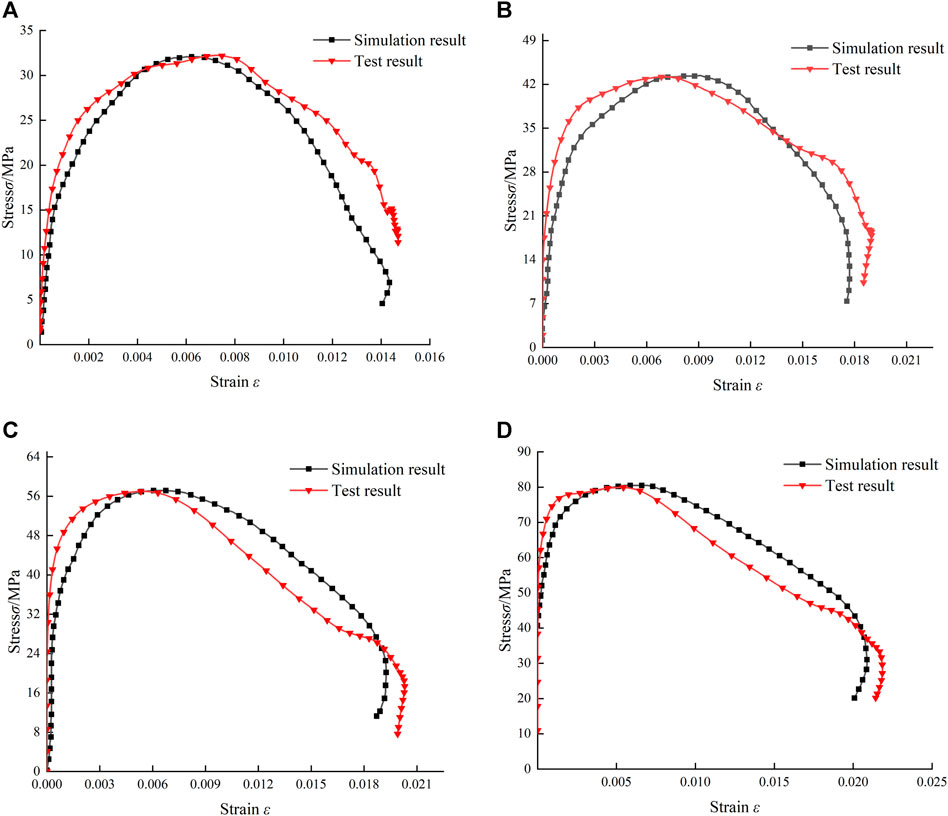
FIGURE 8. Comparison of numerical and experimental stress–strain curves: (A) 0.2 MPa; (B) 0.25 MPa; (C) 0.3 MPa; (D) 0.35 MPa.
The uniaxial compressive strength of the rock samples was 24.8 MPa, and axial static pressure in the experiments was set to be zero, 6.2 MPa, 12.4 MPa, and 18.6 MPa, i.e., 0%, 25%, 50%, and 75% of the uniaxial compressive strength of the rock, respectively. The four incident wave shapes obtained experimentally under impact load of 0.2 MPa, 0.25 MPa, 0.3 MPa, and 0.35 MPa were selected for loading under the four axial loads, and the simulation method was the same as that without confining pressure. For one-dimensional combined dynamic and static loading, the specimens were already affected by preload before being subjected to impact load, and the DR method was used to apply axial static pressure in the numerical simulations.
DR method is a stress initialization method, which can apply stress to the relevant elements of the model, and obtain a steady-state analysis result as the initial condition of the numerical model for subsequent dynamic analysis. He stress initialization using DR method is divided into two steps. The first step is to perform implicit analysis and output the dynain file using the keyword *INTERFACE_SPRINGBACK_LSDYNA, The implicit analysis is static analysis here; In the second step, use the keyword *INCLUDE to Import the dynain file for subsequent dynamic analysis. In subsequent dynamic analysis, The axial pressure is always loaded.
Figure 9A is a diagram of the axial pressure, and Figure 9B shows that the pressure has been successfully applied to the specimen.
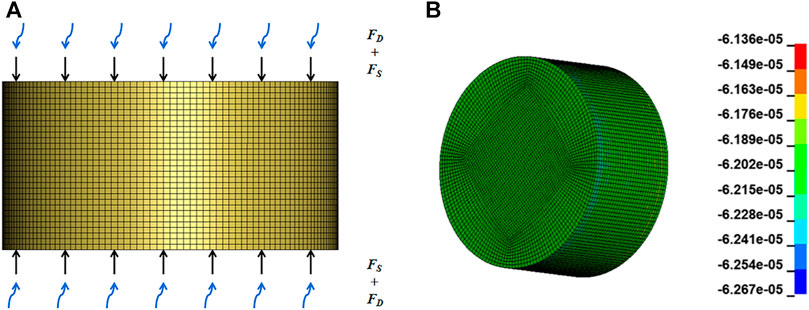
FIGURE 9. Sample stress conditions and prestress cloud diagram under axial pressure: (A) force diagram; (B) specimen stress nebula at an axial pressure of 6.2 MPa.
To better explore how axial static pressure affects SHPB results, the above numerical analysis method was used to study the dynamic mechanical characteristics of rock samples under different coaxial pressures. For the convenience of comparative analysis, numerical simulation data are still used when the axial pressure is zero. According to previous research (Wang et al., 2020), one-dimensional stress wave theory is also applicable when elastic rods and specimens are subjected to combined dynamic and static loading. From the numerical simulation results and the calculation formula of one-dimensional stress wave theory, stress–strain curves of rock specimens under different impact loads and different coaxial pressures were obtained, as shown in Figure 10.
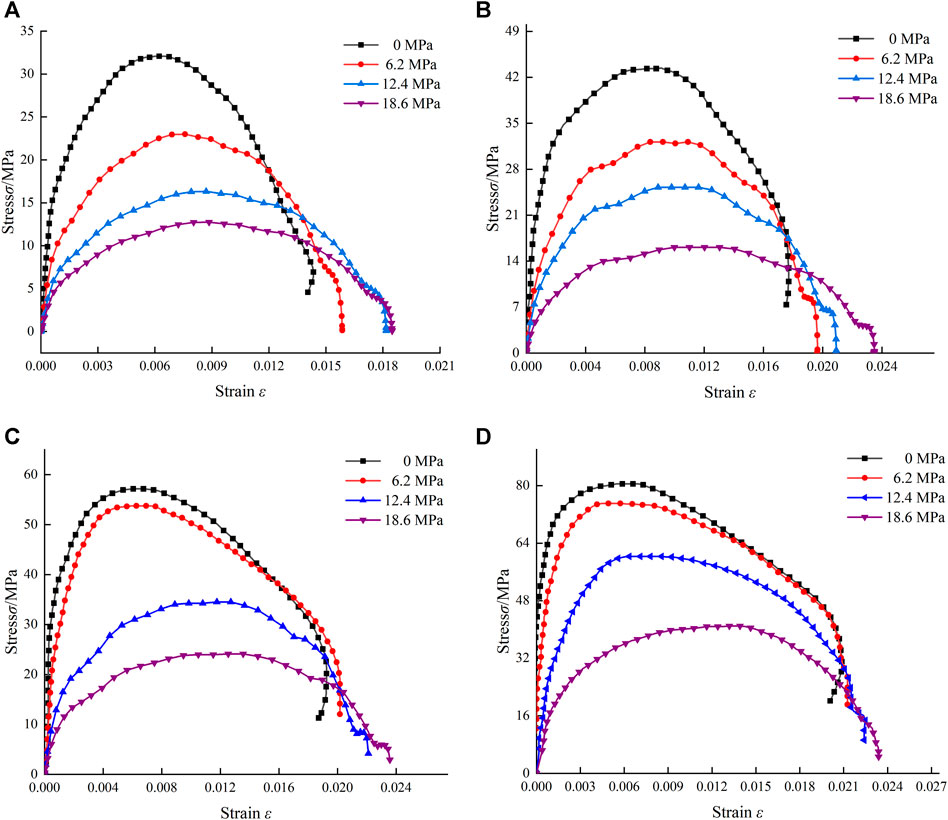
FIGURE 10. Stress–strain relationship of specimens under different axial pressures: (A) 0.2 MPa; (B) 0.25 MPa; (C) 0.3 MPa; (D) 0.35 MPa.
As can be seen from Figure 10, for a given impact load, the slope of the stress–strain curve decreases gradually with increasing axial pressure, as does the peak stress. The results show that for this type of rock, axial pressure weakens its strength, which is helpful for rock crushing. When the axial pressure is zero, the phenomenon of strain rebound (i.e., stress reduction and strain contraction) appears in the post-peak phase of the dynamic stress–strain curve, mainly because part of the elastic energy is stored in the specimen. However, with increasing axial pressure, strain rebound no longer occurs. Taking the stress–strain curve for an impact load of 0.3 MPa, it can be seen that with increasing axial pressure, strain rebound transforms gradually into stress drop, the reason being that most of the energy carried by the incident wave and the static press energy are used for deformation and fracture and crack propagation of the specimen, and only a small part of the energy is stored in the form of elastic energy inside the specimen.
With the increase of axial pressure, the dynamic compressive strength of rock specimens decreases gradually, which is due to the Poisson effect. With the application and increase of axial pressure, due to the existence of Poisson effect, radial tensile stress will be generated inside the specimen. Due to the low tensile strength of the specimen, the specimen will produce splitting tensile failure, which ultimately leads to the decline of its own bearing capacity.
From the perspective of strain analysis, when the impact load is 0.2 MPa and the axial pressure is zero, the maximum cumulative strain is 0.014382, and when the axial pressure is 6.2 MPa, the maximum cumulative strain is 10% higher than that when the axial pressure is zero. When the axial pressure is 12.4 MPa, the maximum cumulative strain increases by 14.3% compared with that when the axial pressure is 6.2 MPa. When the axial pressure is 18.6 MPa, the maximum cumulative strain increases by 2% compared with that when the axial pressure is 12.4 MPa. As can be seen, the cumulative strain increases with increasing axial pressure: for axial pressure in the range of 0–12.4 MPa, the strain growth rate increases gradually; in the range of 12.4–18.6 MPa, the maximum cumulative strain increases by 2%, and the strain growth rate decreases rapidly and is much lower than that in the range of 0–12.4 MPa.
When the impact load is 0.25 MPa and the axial pressure is zero, the maximum cumulative strain is 0.01758, and when the axial pressure is 6.2 MPa, the maximum cumulative strain is 11.7% higher than that when the axial pressure is zero. When the axial pressure is 12.4 MPa, the maximum cumulative strain is 7% higher than that when the axial pressure is 6.2 MPa. When the axial pressure is 18.6 MPa, the maximum cumulative strain is increased by 9.5% compared with that when the axial pressure in 12.4 MPa. With increasing axial pressure, the strain continues to increase, but the growth rate changes. For axial pressure in the range of 0–6.2 MPa, the strain growth rate increases slightly compared with that when the impact pressure is 0.2 MPa, while in the range of 6.2–18.6 MPa, the strain growth rate decreases rapidly and then increases slowly.
When the impact load is 0.30 MPa and the axial pressure is zero, the maximum cumulative strain is 0.0192, and when the axial pressure is 6.2 MPa, the maximum cumulative strain is 4.2% higher than that when the axial pressure is zero. When the axial pressure is 12.4 MPa, the maximum cumulative strain is 10% higher than that when the axial pressure is 6.2 MPa. When the axial pressure is 18.6 MPa, the maximum cumulative strain is 6.8% higher than that when the axial pressure is 12.4 MPa. With increasing axial pressure, the strain increases continuously. In the range of 0–6.2 MPa, the strain growth rate decreases significantly, while in the range of 6.2–18.6 MPa, the strain growth first increases and then decreases.
When the impact load is 0.35 MPa and the axial pressure is zero, the maximum cumulative strain is 0.0209, and when the axial pressure is 6.2 MPa, the maximum cumulative strain is 1.6% higher than that when the axial pressure is zero. When the axial pressure is 12.4 MPa, the maximum cumulative strain increases by 5.7% compared with that when the axial pressure is 6.2 MPa. When the axial pressure is 18.6 MPa, the maximum cumulative strain is 4.2% higher than that when the axial pressure is 12.4 MPa. With increasing axial pressure, the strain increases continuously. For axial pressure in the range of 0–6.2 MPa, the strain growth rate is lower, while in the range of 6.2–18.6 MPa, the strain growth rate increases rapidly and then decreases slowly.
According to the above analysis, for this type of rock under a given impact load, the peak stress decreases gradually and the maximum cumulative strain increases continuously with increasing axial pressure. The reason for this is that the axial compression does not cause pore compaction in the rock but does close the internal micro-cracks completely; internal damage then begins to occur, and new micro-cracks are generated gradually, which contributes further to the expansion of internal cracks in the rock. With increasing axial pressure, the degree of rock weakening continues to increase. Under different combination of impact pressure and axial pressure, the growth rate of the maximum cumulative strain is different, and a suitable combination of impact pressure and axial pressure can obtain better crushing effect.
Figure 11 shows how the sandstone impact strength varies with strain rate under different axial compression. As can be seen, under a given axial pressure, the impact strength increases with increasing strain rate, showing an obvious positive correlation, and the function
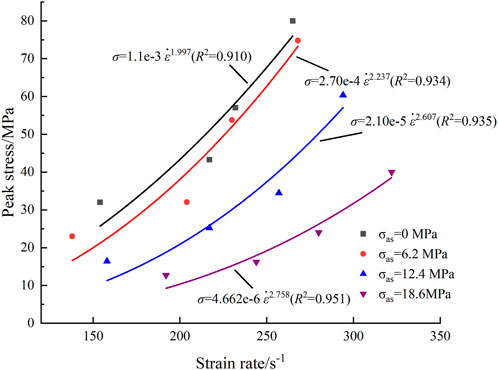
FIGURE 11. Variation of sandstone impact strength with strain rate under different axial compression.
To reflect the relationship between rock impact strength and axial pressure and strain rate under axial static pressure in a more comprehensive and three-dimensional manner, Figure 12 shows the functional relationships between axial static pressure and the coefficients a and b of the function
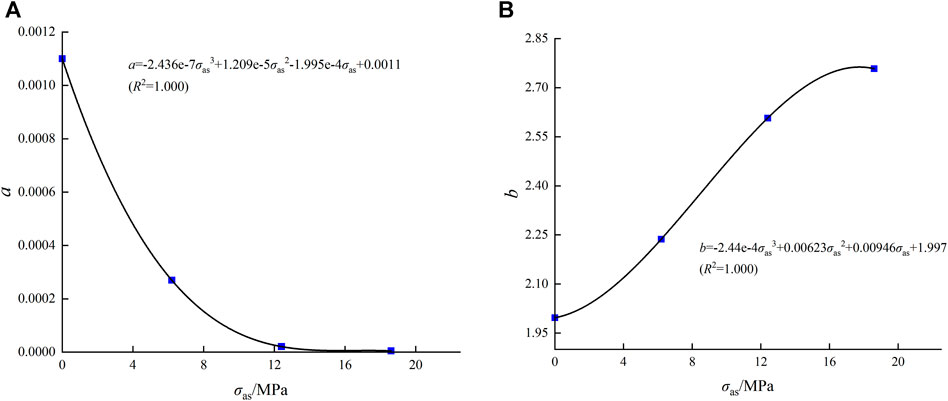
FIGURE 12. Variation of coefficients (A) a and (B) b with axial pressure.
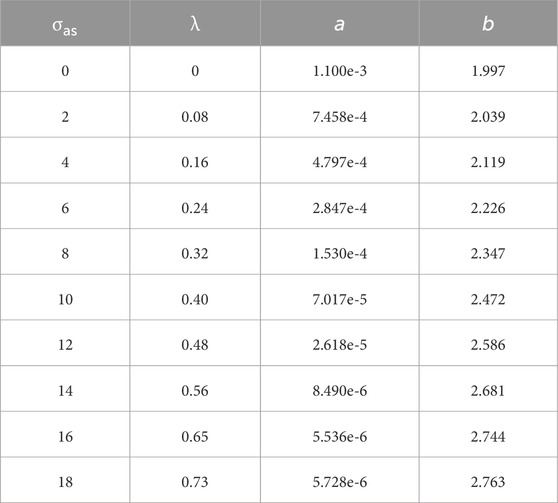
TABLE 6. Coefficient values under different coaxial pressure.
To characterize the axial compression more intuitively, the ratio between it and the uniaxial compressive strength is defined as the axial compression ratio λ, and the data in Table 6 can be used to obtain the relationship among impact strength, axial compression ratio, and strain rate. Figure 13 shows how the rock impact strength changes with strain rate under different coaxial compression. As can be seen, for given λ, the impact strength increases with increasing strain rate, which is consistent with conventional impact tests. When λ is in the range of 0–0.4, the curves of impact strength versus strain rate are very close. When λ is increased to 0.48, the rate of impact-strength increase with increasing strain rate decreases, and when λ is increased further to 0.56–0.73, that rate decreases even more.
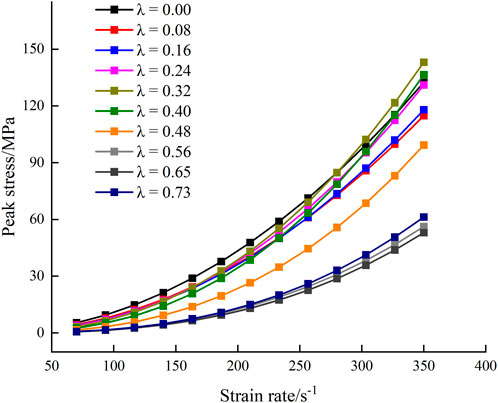
FIGURE 13. Variation of impact strength of sandstone with strain rate under different values of axial compression ratio λ.
Therefore, when crushing rock, it is necessary to select the appropriate axial compression ratio: too large a value will reduce the strain-rate sensitivity of the rock, resulting in low energy utilization rate, while too low a value will make the dynamic strength of the rock high, which is not conducive to crushing. Also, underground engineering rock masses are affected by crustal stress, which is equivalent to applying a certain prestress inside the rock. Therefore, in underground construction, the construction scheme should be designed with comprehensive consideration of the crustal stress level and dynamic mechanical properties of the rock under prestress to achieve better engineering results.
Elastic modulus is an important parameter when measuring rock stiffness characteristics, and the dynamic elastic modulus of rock under static pressure is important in underground engineering construction. In the present study, for convenience of comparison and based on the validity of the present numerical model, the dynamic elastic modulus of the studied rock was calculated from the numerical stress–strain curves under different coaxial pressures. The secant modulus was also calculated, and the calculation points were taken as 20% and 80% of the maximum stress value, as shown in Figure 14.
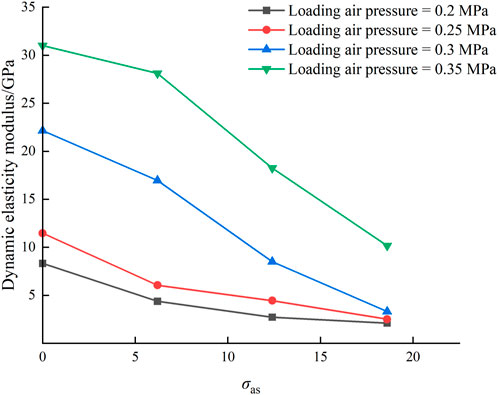
FIGURE 14. Variation of dynamic elastic modulus of rock under different axial pressures.
Overall, the dynamic elastic modulus of the sandstone samples increases with increasing impact load and decreases with increasing axial static pressure under a given impact load. From Figure 14, the slope of each line segment can be used to measure the change amplitude of the dynamic mode. When the axial pressure is 0–6.2 MPa, the slopes of the line segments from low to high impact load are −0.64, −0.87, −0.83 and −0.46; when the axial pressure is 6.2–12.4 MPa, the respective slopes are −0.27, −0.26, −1.37 and −1.59; when the axial pressure is 12.4–18.6 MPa, the respective slopes are −0.01, −0.31, −0.84, and −1.30.
From the above calculations and analysis, when the axial pressure is 0–6.2 MPa, Rate of change of dynamic elastic modulus is slightly less than that of 0.25 MPa and 0.3 MPa at the impact load of 0.2 MPa and 0.35 MPa, but the overall reduction is similar. When the axial pressure is 6.2–12.4 MPa, the decrease of dynamic elastic modulus slows down when the impact load is low, but it accelerates abruptly with increasing impact load. When the axial pressure is 12.4–18.6 MPa, with increasing impact load, the dynamic elastic modulus decreases more and more, and the two are positively correlated.
In general, when the impact pressure is higher, the sample dynamic modulus is larger, indicating that the sample is more difficult to break. This is very understandable, when the impact pressure increases, the dynamic compressive strength of the sample also increases, and the sample is more difficult to break. Under the same impact pressure, with the increase of axial pressure, the sample dynamic modulus gradually decreases, indicating that the sample is more vulnerable to breakage, which is also consistent with the conclusion in Section 4.1.
When the axial pressure is 6.2–12.4 MPa, which is equivalent to 25%–50% of the uniaxial compressive strength, and the impact load is relatively high, the change range of the dynamic modulus is the largest, indicating that the resistance to elastic deformation of the sample decreases most obviously. As the axial pressure continues to increase to the range of 12.4∼18.6 MPa, the decrease of dynamic elastic modulus is relatively slow, which indicates that simply increasing the axial pressure is not conducive to the effective use of energy, and selecting the appropriate axial pressure can better solve this problem.
According to the SHPB test principle, the energy WS(t) absorbed by the specimen in a dynamic impact test can be calculated by Eq. 19
where
where A0, C0, and E0 are the cross-sectional area, wave velocity, and elastic modulus of the elastic bar, respectively, and
The absorbed energy WS(t) of the specimen can be divided into three parts, i.e., crushing energy dissipation WFD(t), ejection energy dissipation WK(t), and other energy dissipation WO(t). The crushing energy dissipation is used for crack propagation and forming a new fracture surface, and WK(t) is the kinetic energy carried by the specimen when breaks and flies out. WO(t) includes sound energy, heat energy, radiation energy, and other energy consumption. Because the crushing energy WFD(t) accounts for more than 95% of WS(t) while WK(t) and WO(t) account for a small proportion and are difficult to measure, WFD(t) can be approximated by WS(t) as shown in Eq. 23
To better analyze the energy dissipation characteristics of the sandstone specimens and exclude the influence of their size, the crushing energy dissipation density
Given above are the methods for calculating the energy associated with each part in the SHPB test, and those energies under axial static pressure can be calculated accordingly. Similarly, for convenience of comparison and based on the validity of the present numerical model, Figure 15 shows the relationship between impact incident energy and unit-volume absorbed energy under different coaxial pressure and no axial pressure based on the numerical results. When fitting the data, EI is the incident energy, and the fitting relationship for the energy of each part under different coaxial pressure is shown in Eqs 25–28
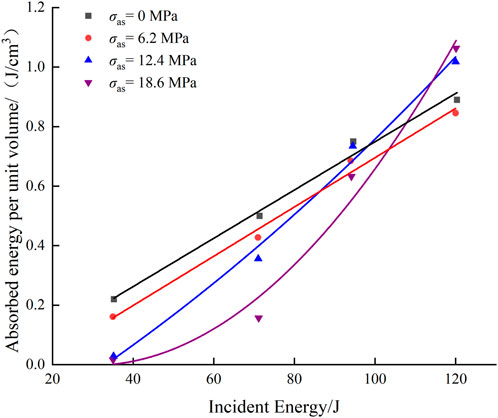
FIGURE 15. Relationship between absorbed and incident energy per unit volume of rock under different axial pressures.
As can be seen from Figure 15, the relationship between the absorbed energy per unit volume of rock and the impact incident energy can be fitted by a polynomial function. When σas = 0, the absorbed energy per unit volume of rock increases with increasing incident energy, the growth rate of the fitting curve is relatively slow. The absorbed energy per unit volume increases from 0.22 J/cm3 to 0.89 J/cm3. When σas = 6.2 MPa, the unit-volume absorbed energy increases from 0.1613 J/cm3 to 0.8452 J/cm3, and the change law of the fitting curve is very similar to that for σas = 0, but the value is lower than that of the rock unit-volume absorbed energy when σas = 0. When σas = 12.4 MPa, the absorbed energy per unit volume increases from 0.0285 J/cm3 to 1.018 J/cm3. In terms of change trend, the growth rate of the fitted curve is much higher than that for σas = 0 and 6.2 MPa, and the starting point of the curve is close to zero, which is much smaller than the previous two. When σas = 18.6 MPa, the absorbed energy per unit volume increases from 0.0167 J/cm3 to 1.063 J/cm3. The two endpoints of the fitted curve are close to those for σas = 12.4 MPa, but the starting value is lower and the end value is higher. The overall rise rate of the curve increases gradually from slow to fast.
The above analysis shows that the energy dissipation of rock samples under one-dimensional dynamic and static combined loading is affected by the axial compression ratio and external impact load. When σas = 6.2 MPa (25% of the uniaxial compressive strength of the sample), the absorbed energy per unit volume of the rock is slightly lower than that when σas = 0. The reason for this is that although the sample is not unstable as a whole after being subjected to the static pressure of 6.2 MPa, part of the elastic energy is stored therein. When the sample is subjected to the impact load, the internal cracks are activated and expand rapidly, and this part of the elastic energy is released, resulting in a corresponding decrease in the sample absorption energy.
When σas = 12.4 MPa (50% of the uniaxial compressive strength of the specimen), part of the energy given to the specimen by the axial static pressure is consumed by the specimen and used for the initiation and expansion of internal micro-cracks, while the other part is still stored in the specimen in the form of elastic energy. Compared with the case for σas = 0, the stress–strain curve (Figure 11) shows that the approximate elastic section is shortened and the dynamic elastic modulus is reduced. When the rock sample is impacted, because of the initiation and expansion of internal micro-cracks, it is more prone to fracture, and the elastic energy will still be released in the further crushing process of the sample. With the increase of impact load, the elastic energy of the sample can not meet the failure requirement, and the sample needs to absorb more incident energy. The stress-strain curve shows that the cumulative strain of the sample gradually increases, indicating that the sample has a greater degree of breakage, and the energy required for failure is naturally higher. Therefore, the increase rate of the fitted curve is higher than that of the sample under low axial pressure, and the absorbed energy of the sample under large impact load is higher than that under low axial pressure.
When σas = 18.6 MPa (75% of the uniaxial compressive strength of the sample), the microcracks in the rock sample have been greatly expanded, the sample is more likely to break when subjected to impact loads, and the elastic energy stored in the sample is further reduced. In general, the absorbed energy of the sample is further reduced when the impact load is low. With increasing impact load, the damage and destruction of rock samples are continuously intensified, and the sample damage corresponds to numerous smaller fragments and powder, which is manifested as a further increase of accumulated strain in the stress–strain curve. Therefore, the starting value of the fitting curve is lower, the end value is higher, and the overall rise rate of the curve increases gradually from slow to fast. However, compared with the case for σas = 12.4 MPa, the energy utilization rate of sample failure is lower in general.
The energy utilization rate of the sample is jointly affected by axial pressure and impact load, which must be considered in order to obtain better fragmentation degree in underground engineering. On the premise of clear crushing form requirements, it is necessary to propose the optimal combination of axial compression ratio and external impact velocity to meet the requirements of engineering crushing size. Therefore, selecting the appropriate combination of axial compression ratio and impact velocity can improve the crushing effect and energy utilization rate of rock.
In the study reported herein, yellow sandstone was taken as the research object, and on the premise of model verification, its mechanical properties and deformation characteristics under one-dimensional dynamic and static combined loading were explored and compared with the results of conventional SHPB tests, along with an in-depth analysis of the influence of static pressure and impact load on rock mechanical properties and energy dissipation law. The main conclusions are as follows.
A set of rock HJC constitutive parameters was determined by basic experiments, theoretical calculations, and empirical values. Then, the finite-element software ANSYS/LS-DYNA was used to numerically simulate the rock SHPB process. By comparing the numerical and experimental results, the rock constitutive parameters and the model were shown to be valid.
With increasing impact load, the degree of rock breakage increases, and the dynamic compressive strength and dynamic elastic modulus increase continuously. With the application and increase of axial pressure, the dynamic compressive strength and dynamic elastic modulus of rocks gradually decrease under the same impact load, and the maximum cumulative strain keeps increasing, indicating that under the influence of axial pressure, micro-cracks in rocks have initially developed and expanded. With increasing axial pressure, rocks are more vulnerable to breakage, and the weakening degree of rocks keeps increasing.
The energy utilization rate of one-dimensional dynamic and static combined loading is affected by axial compression ratio and impact load. At low axial compression ratio, the rock has high impact resistance but high energy utilization rate; at high axial compression ratio, the rock has low impact resistance but low energy utilization rate. Therefore, the combination of axial compression ratio and impact velocity can improve the crushing effect and energy utilization rate on the premise of clear crushing form requirements.
The original contributions presented in the study are included in the article/supplementary material, further inquiries can be directed to the corresponding author.
YX: Methodology, Writing–review and editing. ZZ: Writing–original draft. CL: Formal Analysis, Writing–review and editing. JG: Conceptualization, Writing–review and editing.
The author(s) declare financial support was received for the research, authorship, and/or publication of this article. This work was financially supported by the National Natural Science Foundation of China (Nos. 52074009, 52274071, 52104116), Anhui Provincial Natural Science Foundation (2208085QE174), University Graduate Scientific Research Project of Anhui Province in 2021(YJS20210384).
The authors declare that the research was conducted in the absence of any commercial or financial relationships that could be construed as a potential conflict of interest.
All claims expressed in this article are solely those of the authors and do not necessarily represent those of their affiliated organizations, or those of the publisher, the editors and the reviewers. Any product that may be evaluated in this article, or claim that may be made by its manufacturer, is not guaranteed or endorsed by the publisher.
Bailly, P., Delvare, F., Vial, J., Hanus, J., Biessy, M., and Picart, D. (2011). Dynamic behavior of an aggregate material at simultaneous high pressure and strain rate: SHPB triaxial tests. Int. J. Impact Eng. 38 (2-3), 73–84. doi:10.1016/j.ijimpeng.2010.10.005
Christensen, R. J., Swanson, S. R., and Brown, W. S. (1972). Split-Hopkinson-bar tests on rock under confining pressure. Exp. Mech. 12 (11), 508–513. doi:10.1007/bf02320747
Fairhurst, C. E., and Hudson, J. A. (1999). Draft ISRM suggested method for the complete stress–strain curve for in-tact rock in uniaxial compression. Int. J. Rock Mech. Min. Sci. 36 (3), 279–289.
Gan, D. Q., Gao, F., Zhang, Y. P., Zhang, J., Niu, F., and Gan, Z. (2019). Effects of the shape and size of irregular particles on specific breakage energy under drop weight impact. Shock Vib. 2019, 1–14. doi:10.1155/2019/2318571
He, C. L., and Yang, J. (2018). Laboratory study of dynamic mechanical characteristic of granite subjected to confining pressure and cyclic blast loading. Lat. Am. J. Solids Struct. 15. doi:10.1590/1679-78254424
Holmquist, T. J., Johnson, G. R., and Cook, W. (1993). “A computational constitutive model for concrete subjected to large strains, high strain rate, and high pressures,” in Proceedings of the 1th International Symposium on Ballistic, Québec City, Canada, September, 1993, 591–600.
Kong, X., Fang, Q., Wu, H., and Peng, Y. (2016). Numerical predictions of cratering and scabbing in concrete slabs subjected to projectile impact using a modified version of HJC material model. Int. J. Impact Eng. 95, 61–71. doi:10.1016/j.ijimpeng.2016.04.014
Larson, D. B., and Anderson, G. D. (1980). Plane shock wave studies of westerly granite and nugget sandstone. Int. J. Rock Mech. Min. Sci. Geomechanics Abstr. Pergamon 17 (6), 357–363. doi:10.1016/0148-9062(80)90519-7
Li, C., Xu, Y., Chen, P., Li, H., and Lou, P. (2020). Dynamic mechanical properties and fragment fractal characteristics of fractured coal-rock-like combined bodies in split Hopkinson pressure Bar Tests. Nat. Resour. Res. 29 (5), 3179–3195. doi:10.1007/s11053-020-09656-w
Li, D. Y., Gao, F. H., Han, Z. Y., and Zhu, Q. Q. (2020). Experimental evaluation on rock failure mechanism with combined flaws in a connected geometry under coupled static-dynamic loads. Soil Dyn. Earthq. Eng. 132, 1–12. doi:10.1016/j.soildyn.2020.106088
Li, X., Zhou, Z., Lok, T.-S., Hong, L., and Yin, T. (2008). Innovative testing technique of rock subjected to coupled static and dynamic loads. Int. J. Rock Mech. Min. Sci. 45 (5), 739–748. doi:10.1016/j.ijrmms.2007.08.013
Li, X. B., Zou, Y., and Zhou, Z. L. (2014). Numerical simulation of the rock SHPB test with a special shape striker based on the discrete element method. Rock Mech. Rock Eng. 47, 1693–1709. doi:10.1007/s00603-013-0484-6
Liu, K., Wu, C., Li, X., Li, Q., Fang, J., and Liu, J. (2020). A modified HJC model for improved dynamic response of brittle materials under blasting loads. Comput. Geotechnics 123, 103584. doi:10.1016/j.compgeo.2020.103584
Lu, W., Chen, M., Geng, X., Shu, D., and Zhou, C. (2012). A study of excavation sequence and contour blasting method for underground powerhouses of hydropower stations. Tunn. Undergr. Space Technol. 29, 31–39. doi:10.1016/j.tust.2011.12.008
Luo, S., Gong, F. Q., Peng, K., and Liu, Z. X. (2023a). Influence of water on rockburst proneness of sandstone: insights from relative and absolute energy storage. Eng. Geol. 323, 107172. doi:10.1016/j.enggeo.2023.107172
Luo, S., Gong, F. Q., Peng, K., and Liu, Z. X. (2023b). Rockburst proneness considering energy characteristics and sample shape effects. J. Rock Mech. Geotechnical Eng. doi:10.1016/j.jrmge.2023.09.003
Omidvar, M., Iskander, M., and Bless, S. (2012). Stress–strain behavior of sand at high strain rates. Int. J. Impact Eng. 49, 192–213. doi:10.1016/j.ijimpeng.2012.03.004
Pan, C., Xie, L. X., Li, X., Liu, K., Gao, P. f., and Tian, L. g. (2022). Numerical investigation of effect of eccentric decoupled charge structure on blasting-induced rock damage. J. Central South Univ. 29 (2), 663–679. doi:10.1007/s11771-022-4947-3
Ranjith, P. G., Zhao, J., Ju, M., De Silva, R. V., Rathnaweera, T. D., and Bandara, A. K. (2017). Opportunities and challenges in deep mining: a brief review. Engineering 3 (4), 546–551. doi:10.1016/j.eng.2017.04.024
Tian, X. C., Tao, T. J., Lou, Q. X., and Xie, C. (2022). Modification and application of limestone HJC constitutive model under the impact load. Lithosphere 2021 (Special 7), 6443087. doi:10.2113/2022/6443087
Wang, J., Liu, Y., and Li, K. (2020). Dynamic characteristics of deep dolomite under one-dimensional static and dynamic loads. J. Institution Eng. (India) Ser. A 101 (1), 49–56. doi:10.1007/s40030-019-00424-5
Wang, S. F., Sun, L. C., Tang, Y., Jing, Y., Li, X. B., and Yao, J. R. (2022). Field application of non-blasting mechanized mining using high-frequency impact hammer in deep hard rock mine. Trans. Nonferrous Metals Soc. China 32 (9), 3051–3064. doi:10.1016/s1003-6326(22)66002-3
Yi, C. P., Johansson, D., and Greberg, J. (2018). Effects of in-situ stresses on the fracturing of rock by blasting. Comput. Geotechnics 104, 321–330. doi:10.1016/j.compgeo.2017.12.004
Yin, T., Wang, P., Li, X., Shu, R., and Ye, Z. (2016). Effects of thermal treatment on physical and mechanical characteristics of coal rock. J. Central South Univ. 23 (9), 2336–2345. doi:10.1007/s11771-016-3292-9
Zhang, F. P., Yan, G. L., Peng, J. Y., Qiu, Z., and Dai, X. (2020). Experimental study on crack formation in sandstone during crater blasting under high geological stress. Bull. Eng. Geol. Environ. 79 (3), 1323–1332. doi:10.1007/s10064-019-01665-1
Zheng, Q. Q., Qian, J. W., Zhang, H. J., Chen, Y. K., and Zhang, S. H. (2024). Velocity tomography of cross-sectional damage evolution along rock longitudinal direction under uniaxial loading. Tunn. Undergr. Space Technol. 143, 105503. doi:10.1016/j.tust.2023.105503
Keywords: rock mechanics, coupled dynamic and static loads, axial compression ratio, dynamic mechanical property, energy dissipation
Citation: Xu Y, Zhang Z, Li C and Ge J (2024) Numerical simulation on dynamic compression properties of sandstone under axial static preload. Front. Mater. 10:1338348. doi: 10.3389/fmats.2023.1338348
Received: 14 November 2023; Accepted: 27 December 2023;
Published: 15 January 2024.
Edited by:
Alberto Sapora, Polytechnic University of Turin, ItalyReviewed by:
Song Luo, Central South University, ChinaCopyright © 2024 Xu, Zhang, Li and Ge. This is an open-access article distributed under the terms of the Creative Commons Attribution License (CC BY). The use, distribution or reproduction in other forums is permitted, provided the original author(s) and the copyright owner(s) are credited and that the original publication in this journal is cited, in accordance with accepted academic practice. No use, distribution or reproduction is permitted which does not comply with these terms.
*Correspondence: Zhongyi Zhang, zzyaust1994@163.comenp5YXVzdDE5OTRAMTYzLmNvbQ==
Disclaimer: All claims expressed in this article are solely those of the authors and do not necessarily represent those of their affiliated organizations, or those of the publisher, the editors and the reviewers. Any product that may be evaluated in this article or claim that may be made by its manufacturer is not guaranteed or endorsed by the publisher.
Research integrity at Frontiers
Learn more about the work of our research integrity team to safeguard the quality of each article we publish.