
94% of researchers rate our articles as excellent or good
Learn more about the work of our research integrity team to safeguard the quality of each article we publish.
Find out more
ORIGINAL RESEARCH article
Front. Mater. , 30 January 2024
Sec. Polymeric and Composite Materials
Volume 10 - 2023 | https://doi.org/10.3389/fmats.2023.1336837
 Vijaykumar S. Jatti1
 Shahid Tamboli1Sarfaraj Shaikh1
 Nitin S. Solke1Vikas Gulia1Vinaykumar S. Jatti1Nitin K. Khedkar1
 Sachin Salunkhe2,3*
 Marek Pagáč4
 Emad S. Abouel Nasr5
This research focuses on the relationship between the tensile strength of PLA material and several 3D printing parameters, such as infill density, layer height, print speed, and extrusion temperature, utilizing the Fused Deposition Modeling (FDM) method of Additive Manufacturing (AM). Tensile strength of the samples was determined in compliance with ASTM D638 standard, and the experiments were carried out according to a planned arrangement. Six distinct methods were used to optimize the tensile strength: Particle Swarm Optimization (PSO), Teaching Learning Based Optimization (TLBO), Genetic Algorithm (GA), Simulated Annealing (SA), and Cohort Intelligence (CI). Several runs of the optimization methods demonstrated their consistency in producing the same values of tensile strength, indicating their reliability. The optimization results showed that JAYA performed better than the other algorithms, resulting in a material with the maximum tensile strength of 55.475 N/mm2. Validation experiments were carried out to confirm the efficacy of these algorithms. The results showed that the ideal input parameters produced tensile strength values that closely matched the anticipated values with a low percentage error. The benefits of applying these algorithms to improve the tensile strength of PLA materials for 3D printing are demonstrated by this study, which also offers insightful information about how to optimize FDM procedures.
Additive Manufacturing, sometimes known as 3D printing, is one of the most notable technological developments of the modern age. Building a three-dimensional object layer by layer from a computer-aided design (CAD) model is what it involves. Although this technology has several varieties, FDM is the particular subject of this study. Depending on the material choices and printing parameters selected, FDM can create objects with a variety of mechanical qualities. Several investigations have been conducted in this area, many of which use statistical analysis to identify the critical factors affecting the tensile strength of materials. It is important to remember that different operational ranges and different sets of parameters used in these various researches may cause changes in the results. To gain an overview of the work done in this field, a thorough examination of research completed by many scholars in the past is described in the paragraphs below. Shashikumar and Sreekanth (Shashikumar and Sreekanth, 2023) employed FDM to assess the mechanical characteristics of 3D-printed specimens, taking into account factors like raster orientation and layer thickness, using thermoplastic materials like Nylon 6 (which is semicrystalline) and Acrylonitrile Butadiene Styrene (ABS) (which is amorphous). The study involved printing samples with various raster orientation angles (0, 90, +45/-45, and 0/90°) and different layer thicknesses (0.1, 0.2, 0.3, and 0.4 mm). The key mechanical properties under investigation included the modulus of elasticity, ultimate tensile strength, maximum force, and maximum elongation, with the aim of identifying the most favorable parameters. Rezaeian et al. (2022) emphasized the influence of printing parameters on the tensile behavior of both amorphous and crystalline polymers fabricated through FDM, This study focuses on investigating how the printing speed affects the tensile and fracture strength of components made from ABS using the FDM technique. The research utilizes four different printing speeds, namely, 10, 30, 50, and 70 mm/s, to create dog-bone and Semi-Circular Bending (SCB) specimens. Based on the experimental findings, specimens printed at a speed of 70 mm/s exhibit the best performance. Tran et al. employed (Tran et al., 2022a) a straightforward yet highly effective method to improve the tensile strength of carbon fiber (CF)/ABS and glass fiber (GF)/ABS specimens produced through fused filament fabrication (FFF). The approach involves using a significantly elevated printing temperature while deactivating the cooling fan, leading to the overheating of the extruded ABS composite melt. This overheating enhances the maximum bearing load, tensile strength, and Young’s modulus when compared to their conventionally printed counterparts. Kumar et al. (Raam Kumar and Shakthivel, 2023) focused on a comparative analysis involving the 3D printing of ABS specimens using three commercial printers (such as Ultimaker and Stratasys and a newly developed, locally-made printer). This study varied tool path, material consumption and changes in production time through variations in raster angles. The results revealed that the newly designed printer requires less time for production and consumes less material compared to the existing commercial printers. Anerao et al. (2023) incorporated rice husk biochar into polylactic acid (PLA) to develop a bio composite filament suitable for use in the FDM 3D printing process. The experimental design employed Taguchi L16, and the significance of process parameters was assessed through variance analysis (ANOVA). The highest flexural modulus was achieved with 3% biochar, 100% infill density, and a 0.1 mm layer thickness. In addition to the individual test results, a multi-criteria decision-making model, TOPSIS, was employed to rank the mechanical performance. In order to optimize the mechanical properties of 3D printed objects, the study recommended using a layer thickness of 0.2 mm, an infill density of 100%, and a raster angle of 0° as the FDM process parameters. Yu et al. (2023) introduced a novel concept known as the “continuous printing filament hypothesis” based on a mesoscopic analysis. This hypothesis aims to describe the interconnection status of glass fiber reinforced polymer (GFRP) filaments during FFF 3D printing. This study investigated the fundamental orthotropic mechanical parameters and meticulously designs 24 variations of printing laminates. Ultimate tensile strengths (UTS) were tested and simulated for both cross-stacking (2/8, 4/6, 5/5) and angle-stacking (30°, 45°, 60°) configurations. Experimental results revealed that the lower layers of composites exhibit greater ultimate resistance due to their layer-by-layer characteristics. Fountas et al. (2022) focused on investigating how various Fused Deposition Modeling parameters impact the ultimate tensile strength of 3D-printed organic and biocompatible PLA with wood flour. To carry out this investigation, Taguchi’s experimental design methodology, involving orthogonal array experiments, was employed to manufacture test specimens, following ASTM D638-10 Type I specifications, and to generate results related to stress-strain curves and UTS. The independent FFF parameters under examination include layer thickness (LT), nozzle temperature (NT), raster deposition angle (RDA), and printing speed (PS). Zhang et al. (2019) introduced a data-driven predictive model that takes into account the printing process, with a specific focus on Fused Deposition Modeling (FDM) as a representative case study. The model employed temperature and vibration data to uncover the thermal and mechanical behavior occurring at each printing layer, along with process variations. A Long Short-term Memory (LSTM) network was used to capture the inter-relationships among different printing layers. Tran et al. (2022b) provided guidance for researchers and FFF practitioners in assessing methods to enhance the mechanical strength of polymer printed parts for various real-world applications. The paper categorizes, assesses, and compares a wide range of recent publications that discuss improvements in tensile properties for FFF printed parts in both longitudinal and transverse directions. Hikmat et al. (2021) employed Taguchi’s mixed model fractional factorial design, conducting eighteen experiments where PLA specimens were 3D printed on an FDM printer and subsequently tested for tensile strength using a universal testing machine. Subsequently, the optimal combination of parameters was determined using the Signal-to-Noise ratio (S/N), and the Analysis of Variance (ANOVA) was used to identify significant parameters and assess their effects on tensile strength. Among these parameters, build orientation (specifically, being on-edge), nozzle diameter (0.5), and infill density (100%) were found to be statistically significant and had a substantial impact on the tensile strength. Sola et al. (2023) explored the need for standardization in AM, with a specific focus on mechanical testing. It then delves into the challenges encountered when applying existing standards to measure the tensile properties of polymer parts manufactured through FFF, also known as FDM. The existing standards fall short in accounting for the various printing parameters that influence the mechanical behavior of FFF parts. The literature review, complemented by the experimental results, underscores that until dedicated standards become available, caution should be exercised when applying existing tensile testing standards. The review by Nazir et al. (Nazir et al., 2023) provides insights into the current advancements and potential commercial applications of 3D-printed composites reinforced with natural fibers or biomass. The study underscores that 3D printing technology can effectively serve various purposes, such as producing electroactive papers, fuel cell membranes, adhesives, wastewater treatment solutions, and biosensors. Palaniyappan et al. (2022) used organic fillers and a honeycomb lattice structure in the creation of novel bio-composite materials for 3D printing represents a practical and eco-friendly approach for producing lightweight biopolymeric components. This study aims to investigate the impact of introducing a hexagonal lattice structure into a polymeric composite made from walnut shells and PLA, using theFDM method. Various printing process parameters, including nozzle temperature, layer height, infill density, and printing speed, were adjusted to optimize the tensile strength and dimensional accuracy of the resulting components. Tarrés et al. (2018) utilized two biobased polyethylenes (BioPE) and thermomechanical pulp (TMP) fibers to create biocomposites, with a specific focus on examining the influence of TMP fibers on mechanical properties. The research quantified the increase in the viscosity of the molten biocomposites and linked it to the incorporation of TMP fibers, ranging from 0% to 30% by weight. Gauss and Pickering (2023) developed novel method to disperse nanofibrillated cellulose (CNF) within polylactic acid (PLA) composites for 3D printing applications. The nanofibers underwent modification by grafting PLA onto their surface through in-situ polymerization of L-lactide. This modification altered the interaction between the fibers and PLA, allowing for the creation of reinforced microparticles using a Pickering emulsion technique.
This study examines how the parameters of the 3D printing process affect tensile strength. Additionally, a multiple regression equation connecting 3D printing parameters and tensile strength is established. To achieve the best tensile strength with the best 3D printing process parameter settings, a comparative comparison of optimization strategies was conducted utilizing Simulated Annealing, Teaching Learning Based Optimization, Particle Swarm Optimization, and Cohort Intelligence. The experiment results on the FDM OF PLA material utilizing an Ender 3 3D printer are presented in this paper in an orderly fashion. The experimental design, materials, and procedure parameters used in the investigation are all described in the materials and techniques section. A predetermined experimental plan consisting of a series of tests was followed when varying the parameters of the 3D printing print process, such as the Infill Percentage, Layer height, Print speed, and Extrusion temperature. A mathematical model that could forecast how the process parameters would react was then created using the Tensile Strength data that was gathered throughout the investigation. Ultimately, six distinct optimization methods are applied and discussed: Particle Swarm Optimization, Simulated Annealing, Genetic Algorithm, Teaching Learning Based Optimization, and Cohort Intelligence. The data on Tensile Strength for every parameter is shown in the results section, which is then followed by a discussion of the findings and new perspectives obtained from the research. The study’s conclusion are finally summarized in the conclusion section.
The Fused Deposition Modeling method, uses thermoplastic polymers such as polylactic acid to build three-dimensional objects layer by layer. This process involves preparing a computer-aided design model, converting it into an appropriate file format, then using specialist software to slice the file into thin horizontal layers. These layers produce a set of G-code, or guidelines, that the 3D printer must adhere to while printing. The PLA filament, a biodegradable substance made from renewable resources, is heated by the printer’s extruder before being deposited onto the build platform through a nozzle. The object is built layer by layer as the extruder moves in the X and Y dimensions and the build platform moves in the Z direction. The final 3D item is created when the PLA material fuses with the preceding layer and hardens as it cools. Complex geometries or overhangs may require support structures during printing, and post-processing techniques like sanding or painting can be used to get the right finish. The Creality Ender 3 machine, depicted in Figure 1A, was utilized to create Fused Deposition Modeling (FDM) samples, featuring a 220 × 220 × 250 mm bed size. The Creality Ender 3 machine, depicted in Figure 1A, was utilized to create Fused Deposition Modeling (FDM) samples, featuring a 220 × 220 × 250 mm bed size. The Creality Ender 3 3D printer was used to carry out the FDM trials. Popular and dependable, the desktop 3D printer Creality Ender 3 is renowned for its open-frame design, low cost of ownership, and simplicity of assembly. It has a heated bed and a single extruder configured in the Bowden manner. PLA of 1.75 mm diameter filament of Wol3D make was used in this study. 3D printing was performed within controlled environmental conditions, maintaining a humidity level of 50% and a temperature of 23°C.
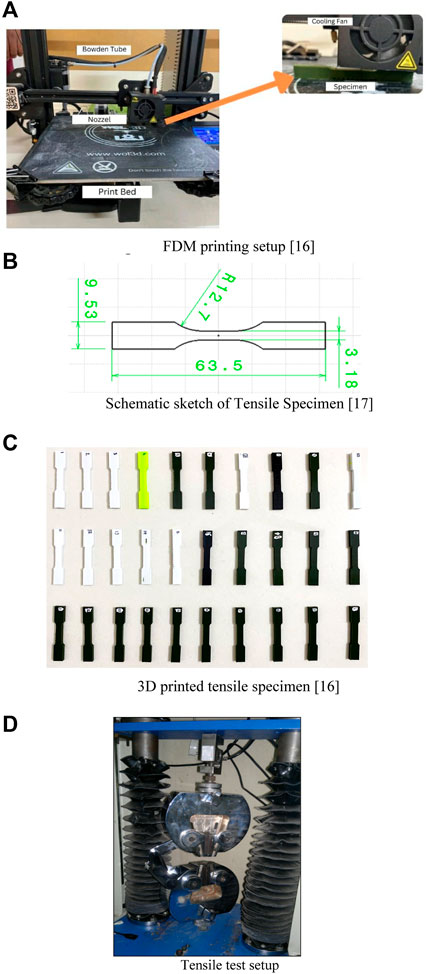
FIGURE 1. (A) FDM printing setup (Potnis et al., 2023). (B) Schematic sketch of Tensile Specimen (Jatti et al., 2022). (C) 3D printed tensile specimen (Potnis et al., 2023). (D) Tensile test setup.
The tensile specimens’ dimensions, as indicated in Figure 1B, were 63.5 × 9.53 × 3.2 mm, meeting the specifications of the ASTM D638 standard. Figure 1C depicts the actual 3D printed tensile specimens.
Three fundamental components make up Design of Experiments (DOE): factors, levels, and responses. Levels are the unique arrangements or values assigned to every component. Design matrices, which are tables with all possible combinations of levels across different parameters, are used to aid DOE. For example, Table 1 shows the parameters of the 3D printing method and the related levels that were examined in the current study.
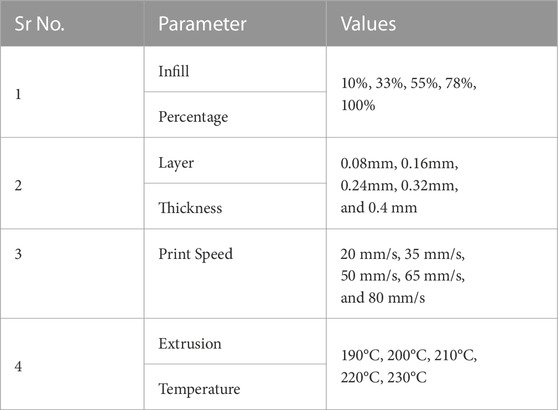
TABLE 1. FDM input parameters.
In Table 2, the experimental runs are displayed according to the central composite design of response surface methodology, along with the observed values of the response variable. To conduct the tensile tests, specimens were prepared and examined in adherence to the ASTM D638 standard. The tensile testing was carried out using a universal Testing Machine from VEEKAY TESTLAB as shown in Figure 1D.
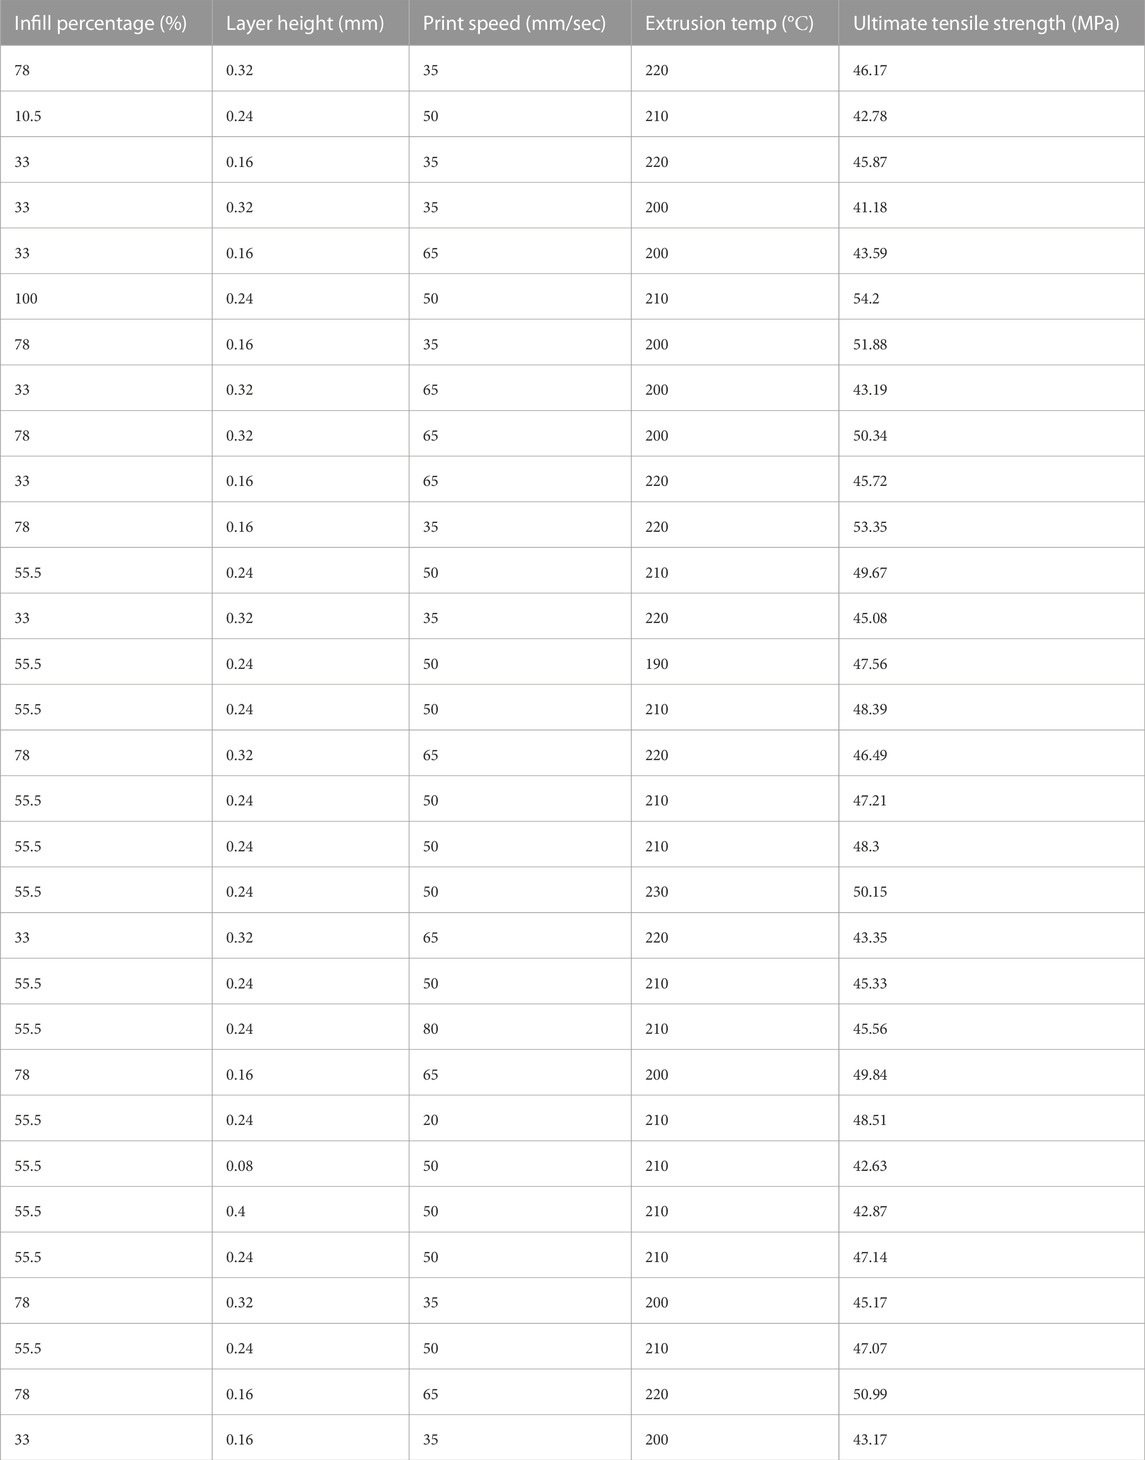
TABLE 2. Input and output parameters (Jatti et al., 2022; Mishra and Jatti, 2023; Mishra and Jatti, 2023; Mishra et al., 2023).
Synthetic data, often known as artificial data, was produced to help in the optimization process. Generating synthetic data is creating data that mimics actual data characteristics while making sure sensitive information is left out. In this instance, the data was produced using a MathWorks MATLAB method, yielding 102 values in total. We then used this freshly created dataset for the remaining steps of our optimization procedure.
Using experimental data, a regression equation was first created to predict tensile strength. Tensile strength is one of the anticipated results that this equation accounts for, along with input characteristics like print speed, layer height, extrusion temperature, and infill %. The multiple regression equation will be used to predict tensile strength. This equation, along with an optimization method, made it possible to significantly improve the algorithm’s performance and achieve more accurate results in this specific study.
Six distinct optimization strategies were used in this study to increase tensile strength. Finding the parameter settings that would produce the best results, as judged by a particular performance indicator, was the main objective. The JAYA Algorithm, Teaching Learning-Based Optimization, Genetic Algorithm, Simulated Annealing, Particle Swarm Optimization, and Cohort Intelligence are the optimization techniques used in this study, respectively. Figures 2–7 depict the flow chart for the aforementioned algorithms.
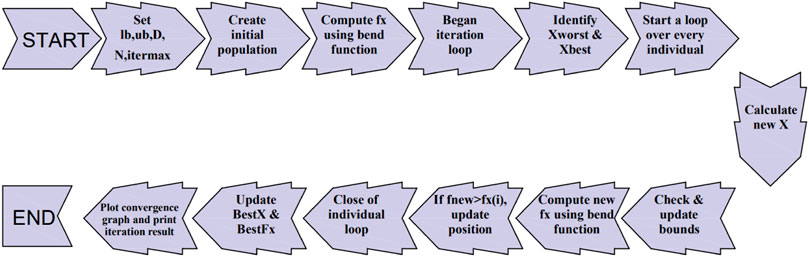
FIGURE 2. Jaya algorithm.
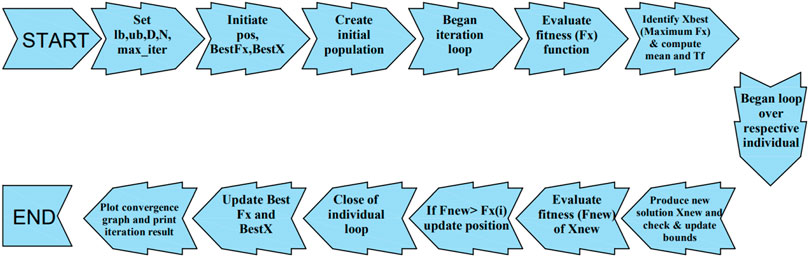
FIGURE 3. Teaching learning algorithm.
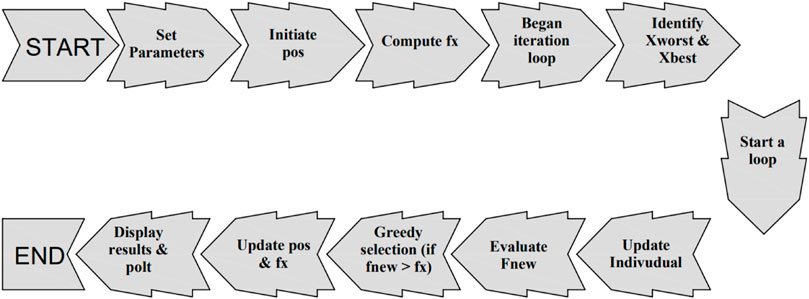
FIGURE 4. Cohort intelligence algorithm.
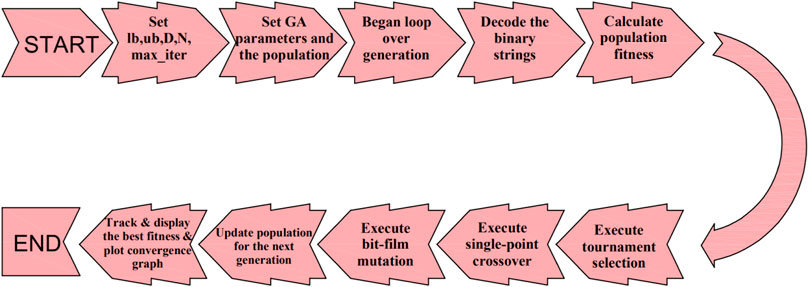
FIGURE 5. Genetic algorithm.
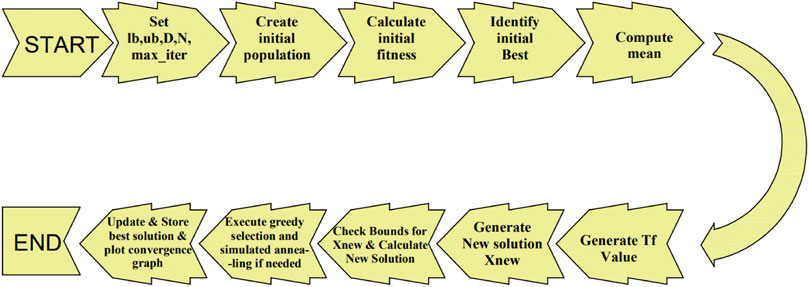
FIGURE 6. Simulated annealing algorithm.
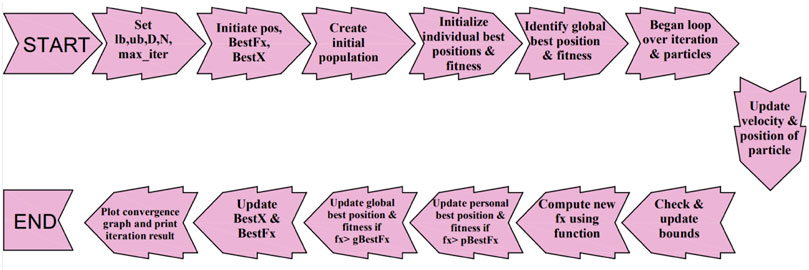
FIGURE 7. Particle swarm algorithm.
A material’s tensile strength indicates how well it can tolerate deformation under load. Several factors, such as Infill Percentage, Layer Height, Print Speed, and Extrusion Temperature, can have a substantial impact on it. Several investigations into the effects of these variables have highlighted how important it is to choose the right values in order to obtain the required Tensile Strength. Tensile strength increases with increasing Infill Percentage, Layer Height, and Extrusion Temperature; nevertheless, increased Print Speed has a marginally detrimental effect. Reduced Infill Percentage leads to reduced material density, which makes the produced part weaker since there is insufficient internal support. As a result, these components are more likely to fracture under stress. Conversely, raising the Infill Percentage makes the part stronger, which raises the tensile strength. It is important to keep in mind that changing more than one parameter at a time will typically result in more noticeable changes in properties.
The experimental data are analyzed using F test (Standard analysis) and analysis of variance (ANOVA). ANOVA analysis is required to determine how process parameters affect performance metrics or parameters. The F-test is used to assess the relevance of process parameters. The most significant component is often one with a p-value of less than 0.05 and at least 95% confidence levels. Based on ANOVA it was found that infill percentage is most significant parameter followed by layer height, extrusion temperature and printing speed (Table 3).

TABLE 3. ANOVA for ultimate test strength
For optimization purpose the function for tensile strength is obtained given in Eq 1.
where, X = Tensile Strength, y1 = Infill percentage, y2 = Layer height, y3 = Print speed, y4 = Extrusion temp.
The optimization problem is mathematical expressed as below:
Objective Function:
Maximize X = 25.841 + 0.084y1 -0.57667y2 +0.0392y3 + 0.04989y4.
Subjected to constraints:
Lower bound = [2.6142, 0.07720, 190]
Upper bound = [101.0779, 0.4404, 82.5129, 230]
The Jaya Algorithm is a simple yet incredibly powerful optimization method designed to find the best answer to a particular issue. It works by improving a population of possible solutions iteratively in an effort to converge on the best one. It evaluates the objective function for every member of the population in every iteration, enabling it to discern between the best and worst options. This algorithm promotes collaboration among individuals by updating the population jointly, as opposed to emphasizing competition or selection. All members of the population are guided toward the best solution while the substandard options are excluded; this cooperative movement is made possible by linear interpolation between members. The JAYA algorithm is a parameter-less optimization algorithm that collaboratively finds better solutions to update the population. The JAYA algorithm has demonstrated remarkable efficacy in optimizing complex functions with numerous input parameters, even in the absence of any algorithm-specific parameters. The best fitness value of 55.475 for the Tensile Strength function with these configuration choices obtained, as shown in the Figure 8. This strategy worked well since it was straightforward and only required the beginning population and the objective function.
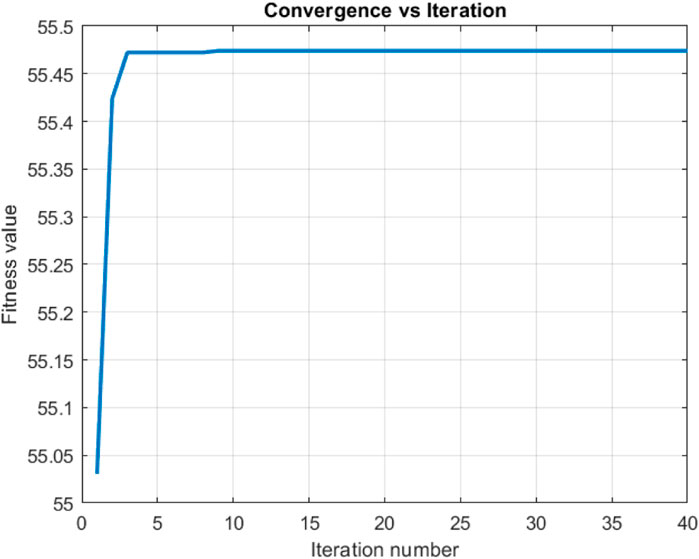
FIGURE 8. JAYA Algorithm: fitness value versus iteration number.
An optimization technique called Teaching Learning Based Optimization (TLBO) is inspired by the dynamics of teaching and learning in a classroom. Its main objective is to replicate the teaching and learning processes in order to get the best answer. It accomplishes this by combining exploration and exploitation tactics to enhance a population of viable solutions. Better solutions are exchanged, and TLBO promotes this, much like the teaching phase where knowledge is transferred among individuals. People modify their solutions in a parallel learning phase using the knowledge they have learned. Every iteration involves TLBO evaluating each population member’s objective function to determine the average and optimal solutions. The method iteratively improves the overall fitness of the solutions by going through these phases for a predetermined number of times. The population size and the number of iterations are the only two parameters needed by the Teaching Learning based Optimization method; no further algorithm-specific parameters are needed. It focuses on the processes of knowledge transfer via student-teacher interaction and knowledge transfer via student-student interaction. Both the teacher phase and the learner phase are how the algorithm operates. The population size and number of iterations were 30 and 50, respectively. With the previously specified parameters, it was able to reach the maximum fitness value of 55.473 as seen from Figure 9. The simplicity and efficacy of this method are particularly evident when it comes to solving optimization problems with complex solution spaces or unclear gradient information.
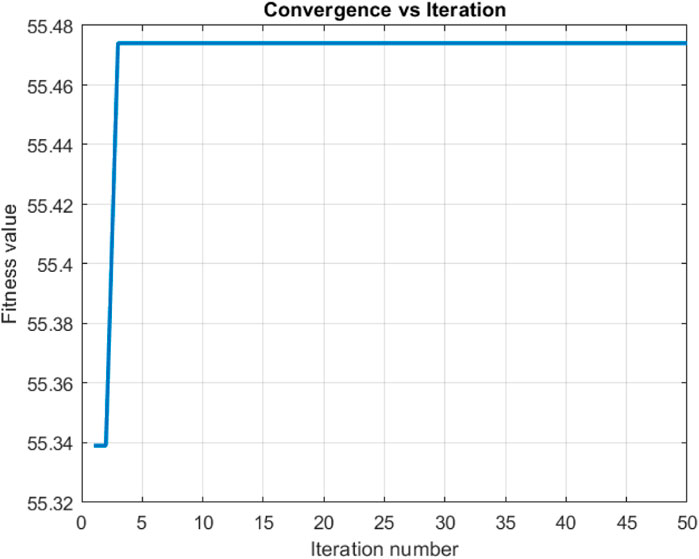
FIGURE 9. Teaching learning based optimization: fitness value versus iteration number.
An optimization method influenced by how cohorts or groups behave in the natural world. It is intended to use collaboration and the kind of collective intelligence found in natural systems to solve challenging optimization problems. It accomplishes this by applying an intelligence algorithm to analyze cohort data, such as customer behavior, and producing the best possible outcome. A customer who tries to imitate a behavior is likely to grow personally from such features. Cohort applicants will use this concept to accomplish common goals in self-organizing systems. It is a group of contenders interacting and contending with one another. In essence, the idea of a cohort stems from social people’s propensity to imitate, absorb, and adjust to the traits of others. A cohort of candidates usually exhibits a particular pattern of behavior that can improve the candidates’ own behavior. A candidate is likely to take on these traits in an attempt to emulate a specific behavior that possesses certain features in order to enhance their own behavior. With these parameters, we were able to achieve, as the figure illustrates, an ideal function tensile strength value of 54.104, depicted from Figure 10. Because everything worked well, it turned out to be beneficial.
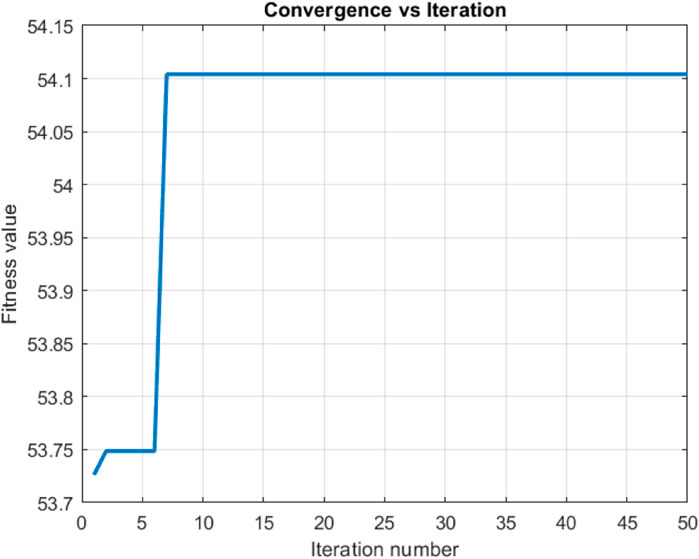
FIGURE 10. Cohort intelligence: fitness value versus iteration number.
An approach to problem solving known as the Genetic Algorithm imitates the evolutionary concepts seen in biological systems. Chromosomes are a population of possible solutions that this algorithm manages and directs the evolution of over a series of generations. The processes of crossover, mutation, and selection aid in this evolution, which ultimately aims to increase the population’s overall fitness. This resembles the natural processes of genetic recombination and survival of the fittest. Every iteration, the GA evaluates each member of the population’s fitness according to an objective function. In contrast to crossover, which mimics genetic recombination by exchanging genetic information among chosen people, selection entails choosing individuals based on their fitness. To increase diversity and exploration, mutation introduces haphazard changes in the genetic composition of progeny.
A mix of pattern search and GA to maximize the function. With a crossover fraction of 0.9 in the GA component of the optimizer, 90% of the genes on the parent chromosomes were used to make the child. The fitness scaling prop, which scales the fitness values according to their percentage to the population’s overall fitness, was the fitness scaling function that was employed. Selection roulette served as the selection function, choosing individuals for reproduction according to their fitness levels. Using a heuristic method, the crossover function integrates genetic material from two parent chromosomes. Mutation power, a crossover mutation that introduces unique variations into the population by adding a random value to the gene with a given probability, was the crossover mutation employed.
Until a termination condition is satisfied—which could be reaching a maximum number of generations or a suitable fitness level—the algorithm keeps going through this iterative loop. A fitness value of 54.8888 was found from this optimization as seen from Figure 11. The GA shown efficacy in effectively navigating the solution space and pinpointing the ideal input parameter values that provide the intended result. These outcomes highlight how well the GA performs when optimizing intricate functions with several input parameters.
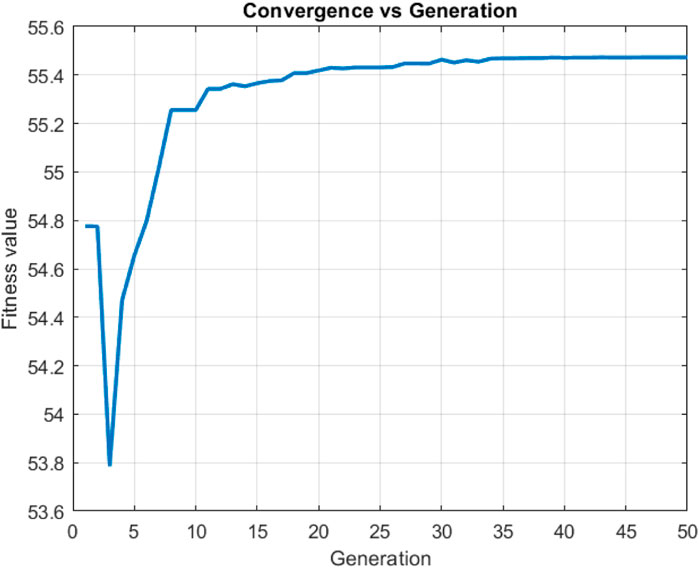
FIGURE 11. Genetic algorithm: fitness value versus iteration number.
The gradual cooling technique used in material science to minimize flaws and reach a stable state served as the model for the optimization technique known as “simulated annealing.” This method simulates the heating and cooling stages by using a temperature variable. The algorithm starts by creating a random trial point. It then uses a probability distribution, which is affected by the current temperature, to calculate the distance between the trial point and the current point. It then evaluates the goal function at the trial point. The trial point becomes the new solution if the objective function value there is greater than the value at the current point.
With a chance dependent on the temperature and the extent of the objective function’s decline, the trial point may nevertheless take over as the new current point even if it produces a poorer objective function value.
Because the SA algorithm was set up using data type double, decimal values for input parameters can be handled. The default function, which accepts moves that produce a lower fitness value than the present state, was set as the acceptance function. During the optimization process, the temperature is lowered exponentially by the temperature function, which was temperature exp. We were able to narrow down the search space and identify the ideal input parameters that produced the required outcomes by combining the SA algorithm with the hybrid optimizer for pattern search.
By using this method, we were able to obtain an ideal fitness value of 55.344, seen in Figure 12. When it comes to methodically examining several solutions and determining the ideal input parameters to attain the intended result, Simulated Annealing has shown to be incredibly successful. This result highlights the Simulated Annealing algorithm’s effectiveness in simplifying and optimizing intricate functions with a large number of input parameters.
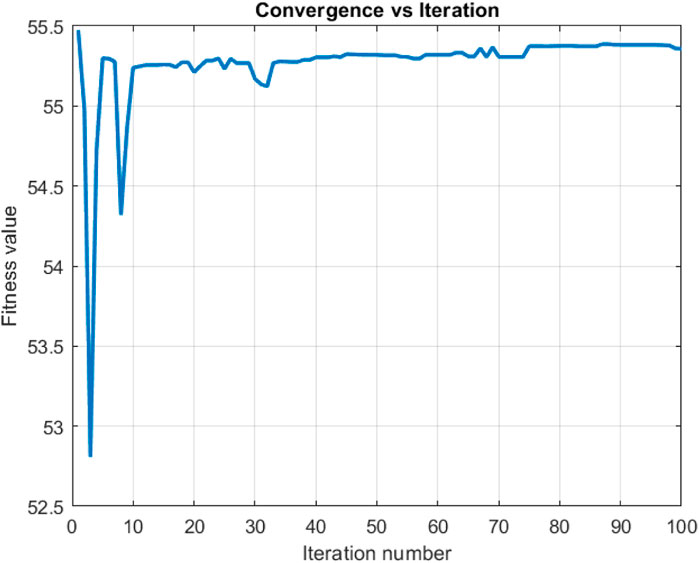
FIGURE 12. Simulated annealing: fitness value versus iteration number.
The optimization method known as particle swarm optimization (PSO) is inspired by the group dynamics of natural phenomena such as fish schools and bird flocks. Its main goal is to simulate the social interactions and movement of particles inside a swarm in order to find the optimal solution to a problem. With this approach, the best solution is found by a population of particles working together to explore the search space. As a prospective solution, each particle moves across the search space at a different speed and place according to its own experience as well as the collective knowledge of the swarm. Each particle’s optimal solution is known as its “personal best,” while the optimal solution attained by the entire swarm is known as the “global best.” Particles adjust their velocities according to the global best and their own best during each cycle.
With a minimum neighbor fraction of 0.25 set, the PSO algorithm ensures that every particle has a minimum of 25% of its neighbors within its local search space. The particle’s movement is influenced by the global best position only to the extent that the social adjective weight (1.2) is controlled. Setting the self-adjective weight to 1.49 modifies the particle’s propensity to gravitate toward its optimal position.
Following this idea, we used the PSO method to obtain an ideal fitness value of 55.474, as seen in Figure 13. PSO has shown to be an extremely effective technique for methodically exploring the solution space and determining the ideal values of the input parameters that result in the desired output. This result emphasizes how well the PSO method optimizes complicated functions with several input parameters while keeping things simple.
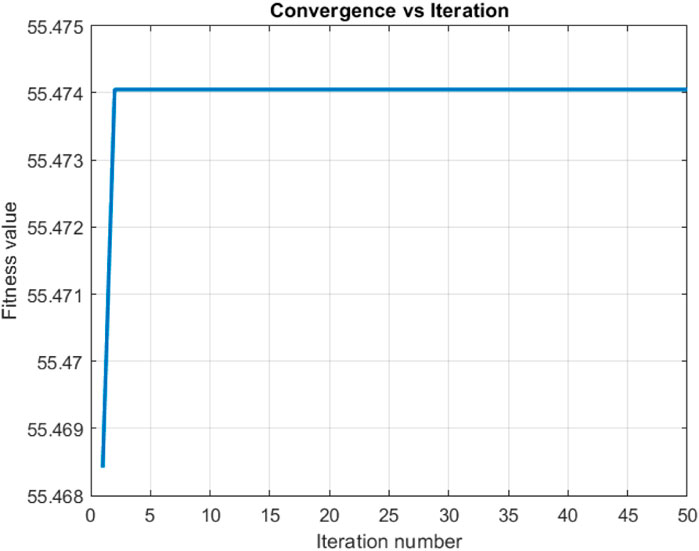
FIGURE 13. Particle swarm optimization: fitness value versus iteration.
Table 4 displays the results of 100 repetitions using the JAYA Algorithm, Simulated Annealing, Genetic Algorithm, Particle Swarm Optimization, Teaching Learning Optimization, and Cohort Intelligence. These optimization techniques’ remarkable consistency in output demonstrates how well they work to solve optimization problems in a variety of fields. In particular, the JAYA method fared better than the others for optimizing tensile strength, with Cohort Intelligence, Particle Swarm Optimization, and Teaching Learning-based Optimization coming in close second and third. Remarkably, these techniques demonstrated low standard deviations in their performance during the 100 runs, highlighting their dependability and resilience in producing excellent outcomes.
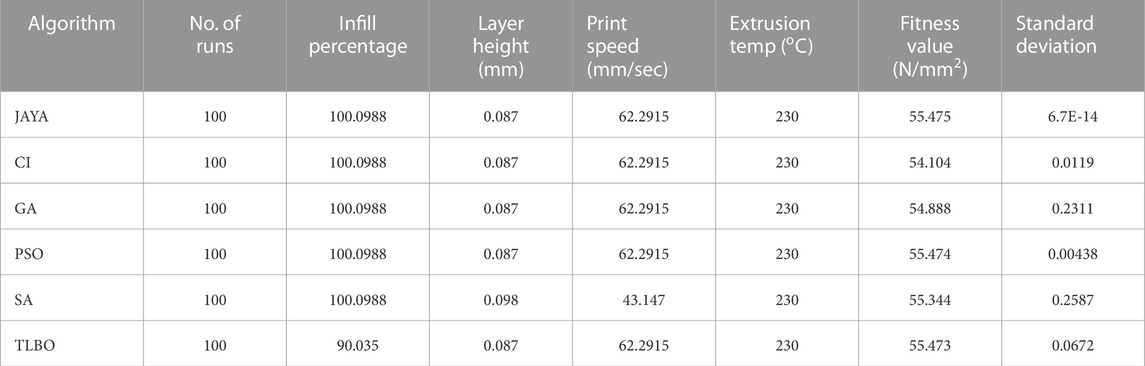
TABLE 4. Comparative analysis of optimization techniques.
Validating the appropriate process parameter setting for achieving the best performance measure values is the last phase in this investigation. In the course of the confirmation experiments, the analysis yielded optimal settings for the relevant parameters, while the most economical level was established for the inconsequential ones. In order to determine whether the real mean of the performance measure value falls within the two confidence intervals, at least three validation experiments must be carried out. The actual mean of the performance measure value is then compared with the estimated mean of the performance measure value. In this study six validation experiments were performed for each optimization technique. The values from these studies are shown in Table 5, where they are contrasted to the values that the algorithms predicted. The percentage error had to be calculated for the comparison. The results showed that the model’s experimental validation showed a good match between the predicted values and the actual outcomes, indicating a high degree of prediction accuracy.
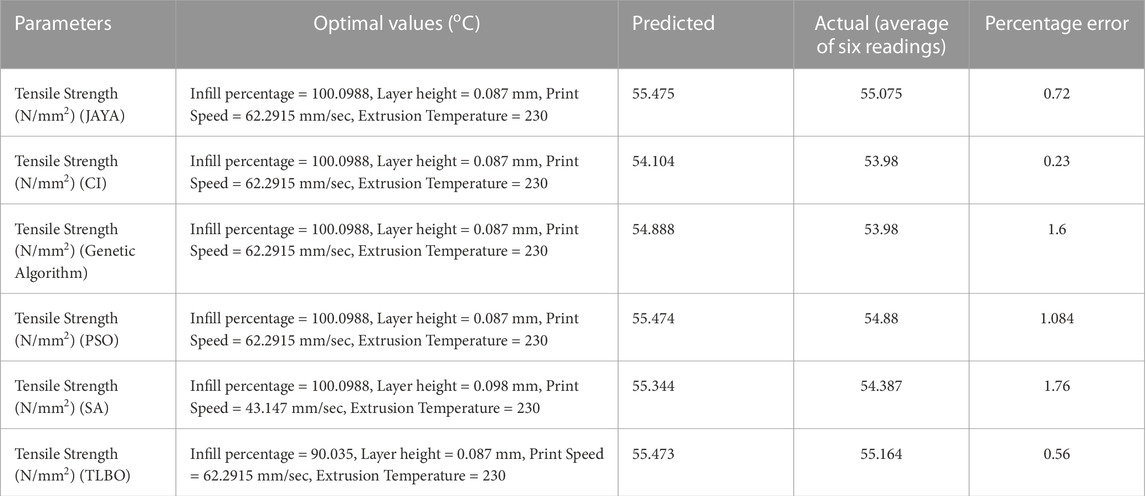
TABLE 5. Validation test.
The results of the study might only apply to PLA, and the optimization algorithms’ application to other 3D printing materials with different mechanical characteristics and behaviors might vary. Findings from a specific FDM machine—like the previously stated Creality Ender 3—might not translate to other 3D printers with dissimilar build volumes, settings, or technological specs. Differences in real-world printing settings, such as changes in temperature and humidity, may not have been taken into consideration in this study. These differences can have an impact on the performance of the printer and PLA material. The study may have limited our understanding of the full capability of the optimization algorithms by not examining a wide range of parameters for each approach. Uncertainties can be introduced and the repeatability of results impacted by variations in experimental setups, such as minor variations in filament batches or machine calibration. In summary, optimization algorithms have the potential to enhance 3D printing procedures; however, their practical implementation requires that their features be carefully evaluated, that parameters be adjusted, and that the unique circumstances of the research—such as the PLA material and FDM machine employed—be acknowledged.
The current work used the CI, GA, SA, JAYA, TLBO, and PSO algorithms to optimize the Fused Deposition Modeling (FDM) method in order to 3D print PLA material with the maximum potential tensile strength. The following are the main observations:
1. Tensile strength is maximized when using a lower layer height, a higher infill percentage, a medium extrusion temperature, and a medium printing speed.
2. JAYA algorithm outperformed PSO, GA, SA, JAYA, and TLBO in optimizing the process.
3. The algorithms’ robustness was tested through multiple runs, and consistent tensile strength values were obtained. Found that all algorithms are capable in optimizing the tensile strength.
4. Validation experiments affirmed that the optimal input parameter settings determined by the algorithms resulted in tensile strength values closely matching the predicted values.
5. These findings have implications for various fields that utilize 3D printing technologies and provide a valuable direction for future research in the realm of Additive Manufacturing.
The original contributions presented in the study are included in the article/Supplementary material, further inquiries can be directed to the corresponding author.
VjJ: Conceptualization, Formal Analysis, Funding acquisition, Investigation, Methodology, Supervision, Writing–original draft, Writing–review and editing. ST: Data curation, Funding acquisition, Investigation, Project administration, Writing–review and editing. SrS: Data curation, Project administration, Software, Visualization, Writing–review and editing. NS: Conceptualization, Data curation, Formal Analysis, Resources, Writing–original draft. VG: Conceptualization, Data curation, Project administration, Resources, Validation, Writing–review and editing. VnJ: Conceptualization, Data curation, Funding acquisition, Methodology, Project administration, Writing–original draft. NK: Conceptualization, Resources, Supervision, Validation, Writing–review and editing. ScS: Funding acquisition, Methodology, Software, Validation, Visualization, Writing–original draft. MP: Data curation, Funding acquisition, Project administration, Software, Writing–review and editing. EA: Funding acquisition, Software, Supervision, Validation, Writing–review and editing.
The author(s) declare financial support was received for the research, authorship, and/or publication of this article. The authors thank King Saud University for funding this work through the Researchers Supporting Project number (RSP2024R164), King Saud University, Riyadh, Saudi Arabia.
This paper was completed in association with the project “Materials and Technologies for Sustainable Development -MATUR,” registration no. CZ.02.01.01/00/22_008/0004631 financed by the Structural Funds of the European Union project.
The authors declare that the research was conducted in the absence of any commercial or financial relationships that could be construed as a potential conflict of interest.
All claims expressed in this article are solely those of the authors and do not necessarily represent those of their affiliated organizations, or those of the publisher, the editors and the reviewers. Any product that may be evaluated in this article, or claim that may be made by its manufacturer, is not guaranteed or endorsed by the publisher.
Anerao, P., Kulkarni, A., Munde, Y., Shinde, A., and Das, O. (2023). Biochar reinforced PLA composite for fused deposition modelling (FDM): a parametric study on mechanical performance. Compos. Part C Open Access 12, 100406. doi:10.1016/j.jcomc.2023.100406
Fountas, N. A., Kechagias, J. D., Zaoutsos, S. P., and Vaxevanidis, N. M. (2022). Experimental and statistical study on the effects of fused filament fabrication parameters on the tensile strength of hybrid PLA/Wood fabricated parts. Procedia Struct. Integr. 41, 638–645. doi:10.1016/j.prostr.2022.05.072
Gauss, C., and Pickering, K. L. (2023). A new method for producing polylactic acid biocomposites for 3D printing with improved tensile and thermo-mechanical performance using grafted nanofibrillated cellulose. Addit. Manuf. 61, 103346. doi:10.1016/j.addma.2022.103346
Hikmat, M., Rostam, S., and Ahmed, Y. M. (2021). Investigation of tensile property-based Taguchi method of PLA parts fabricated by FDM 3D printing technology. Results Eng. 11, 100264. doi:10.1016/j.rineng.2021.100264
Jatti, V. S., Sapre, M. S., Jatti, A. V., and Khedkar, N. K. (2022). Mechanical properties of 3D-printed components using fused deposition modeling: optimization using the desirability approach and machine learning regressor. Appl. Syst. Innov. 5 (6), 112. doi:10.3390/asi5060112
Mishra, A., and Jatti, V. S. (2023a). Neurosymbolic artificial intelligence (NSAI) based algorithm for predicting the impact strength of additive manufactured polylactic acid (PLA) specimens. Eng. Res. Express 5, 035017. doi:10.1088/2631-8695/ace610
Mishra, A., and Jatti, V. S. (2023b). Novel coupled genetic algorithm–machine learning approach for predicting surface roughness in fused deposition modeling of polylactic acid specimens. J. Materi Eng Perform. doi:10.1007/s11665-023-08379-2
Mishra, A., Jatti, V. S., Sefene, E. M., and Paliwal, S. (2023). Explainable artificial intelligence (XAI) and supervised machine learning-based algorithms for prediction of surface roughness of additively manufactured polylactic acid (PLA) specimens. Appl. Mech. 4, 668–698. doi:10.3390/applmech4020034
Nazir, M. H., Al-Marzouqi, A. H., Ahmed, W., and Zaneldin, E. (2023). The potential of adopting natural fibers reinforcements for fused deposition modeling: characterization and implications. Heliyon 9 (4), e15023. doi:10.1016/j.heliyon.2023.e15023
Palaniyappan, S., Veeman, D., Sivakumar, N. K., and Natrayan, L. (2022). Development and optimization of lattice structure on the walnut shell reinforced PLA composite for the tensile strength and dimensional error properties. Structures 45, 163–178. doi:10.1016/j.istruc.2022.09.023
Potnis, M. S., Singh, A., Jatti, V. S., Sapre, M. S., Pathak, S., Joshi, S., et al. (2023). Part quality investigation in fused deposition modelling using machine learning classifiers. Int. J. Interact. Des. Manuf. doi:10.1007/s12008-023-01493-4
Raam Kumar, S., and Shakthivel, M. R. (2023). Comparative study on the influence of tool path variation in Fused Deposition Modeling Machine. Mater. Today Proc. doi:10.1016/j.matpr.2023.07.255
Rezaeian, P., Ayatollahi, M. R., Nabavi-Kivi, A., and Razavi, N. (2022). Effect of printing speed on tensile and fracture behavior of ABS specimens produced by fused deposition modeling. Eng. Fract. Mech. 266, 108393. doi:10.1016/j.engfracmech.2022.108393
Shashikumar, S., and Sreekanth, M. S. (2023). The effect of printing parameters on tensile properties of thermoplastics prepared by fused deposition modeling (FDM) based additive manufacturing technique. Mater. Today Proc. 90, 256–261. doi:10.1016/j.matpr.2023.06.212
Sola, A., Chong, W. J., Pejak Simunec, D., Li, Y., Trinchi, A., Kyratzis, I. L., et al. (2023). Open challenges in tensile testing of additively manufactured polymers: a literature survey and a case study in fused filament fabrication. Polym. Test. 117, 107859. doi:10.1016/j.polymertesting.2022.107859
Tarrés, Q., Melbø, J. K., Delgado-Aguilar, M., Espinach, F. X., Mutjé, P., and Chinga-Carrasco, G. (2018). Bio-polyethylene reinforced with thermomechanical pulp fibers: mechanical and micromechanical characterization and its application in 3D-printing by fused deposition modelling. Compos. Part B Eng. 153, 70–77. doi:10.1016/j.compositesb.2018.07.009
Tran, T. Q., Canturri, C., Deng, X., Tham, C. L., and Ng, F. L. (2022a). Enhanced tensile strength of acrylonitrile butadiene styrene composite specimens fabricated by overheat fused filament fabrication printing. Compos. Part B Eng. 235, 109783. doi:10.1016/j.compositesb.2022.109783
Tran, T. Q., Ng, F. L., Kai, J. T. Y., Feih, S., and Nai, M. L. S. (2022b). Tensile strength enhancement of fused filament fabrication printed parts: a review of process improvement approaches and respective impact. Addit. Manuf. 54, 102724. doi:10.1016/j.addma.2022.102724
Yu, X., Yao, T.-Y., Xiong, J.-H., Zhao, Y., Zhou, Y.-J., and Jing, Y. (2023). Mesoscopic analysis and intra-layer progressive failure model of fused filament fabrication 3D printing GFRP. Constr. Build. Mater. 406, 133285. doi:10.1016/j.conbuildmat.2023.133285
Keywords: tensile strength, fused deposition modeling, JAYA algorithm, teaching learning based optimization, particle swarm optimization, cohort intelligence
Citation: Jatti VS, Tamboli S, Shaikh S, Solke NS, Gulia V, Jatti VS, Khedkar NK, Salunkhe S, Pagáč M and Abouel Nasr ES (2024) Optimization of tensile strength in 3D printed PLA parts via meta-heuristic approaches: a comparative study. Front. Mater. 10:1336837. doi: 10.3389/fmats.2023.1336837
Received: 11 November 2023; Accepted: 15 December 2023;
Published: 30 January 2024.
Edited by:
Natrayan L., Saveetha University, IndiaReviewed by:
Chandrasekhara Sastry C., Indian Institute of Information Technology Design and Manufacturing Kurnool, IndiaCopyright © 2024 Jatti, Tamboli, Shaikh, Solke, Gulia, Jatti, Khedkar, Salunkhe, Pagáč and Abouel Nasr. This is an open-access article distributed under the terms of the Creative Commons Attribution License (CC BY). The use, distribution or reproduction in other forums is permitted, provided the original author(s) and the copyright owner(s) are credited and that the original publication in this journal is cited, in accordance with accepted academic practice. No use, distribution or reproduction is permitted which does not comply with these terms.
*Correspondence: Sachin Salunkhe, c2FjaGluc2FsdW5raGVAZ2F6aS5lZHUudHI=
Disclaimer: All claims expressed in this article are solely those of the authors and do not necessarily represent those of their affiliated organizations, or those of the publisher, the editors and the reviewers. Any product that may be evaluated in this article or claim that may be made by its manufacturer is not guaranteed or endorsed by the publisher.
Research integrity at Frontiers
Learn more about the work of our research integrity team to safeguard the quality of each article we publish.