
94% of researchers rate our articles as excellent or good
Learn more about the work of our research integrity team to safeguard the quality of each article we publish.
Find out more
ORIGINAL RESEARCH article
Front. Mater., 23 November 2023
Sec. Structural Materials
Volume 10 - 2023 | https://doi.org/10.3389/fmats.2023.1321892
This article is part of the Research TopicStatic and Dynamic Performance Analysis of Structures and Materials Under Complex Loads and Environmental ExcitationView all 10 articles
 Xiaoli Huang1
 Yulin Wang2*
In this study, 32 numerical models of CHST columns were established in the ABAQUS program to evaluate the effect of mid-span local defects on the impact resistance of circular hollow steel tube (CHST) columns. The simulation studies were conducted from three aspects: notch length, notch angle, and impact energy. The results showed that under a lateral impact load, the mid-span of the CHST column presented global bending failure patterns accompanied by local indentation deformation in the impact region and local buckling deformation at the bottom of the fixed end. Compared with the mid-span indentation displacement of the non-notch model, when the impact velocities were 30 km/h and 60 km/h, the horizontal notch model surpassed the maximum by 29.3% and 36.3%, the oblique notch model surpassed the maximum by 47.8% and 115.6%, and the vertical notch model only increased by 9.7% and 1.1%. The local damage area and impact force time-history curves of the vertical notch model agreed well with those of the non-notch model. Among the three notch angles, the impact plateau values of the vertical notch model and the global bending displacement in the mid-span were least affected by the notch length, notch location, and impact energy. The energy absorption of the CHST column was mainly due to indentation deformation in the mid-span, and the global bending deformation was auxiliary. Compared with the energy absorption ratio (EAR) of the non-notch model, with increased impact energy, the EAR of the vertical notch model increased by 20.2%, 13.5%, and 17.3% on average. The horizontal and oblique notch models decreased by 28.2%, 61.0%, 42.4%, and 29.1%, 62.7%, and 49.3%, respectively. The Rd of all notch models showed an overall upward trend as the impact energy increased, and the Rd of the horizontal notch model increased the most. According to the parametric analysis results, the dynamic flexural capacity prediction formula of the CHST columns section was obtained, considering the influence of notch length, notch angle, and impact energy within the parameter range of this study.
Circular steel tubes are widely used in marine, industrial, and large spatial structures such as stadiums, airports, bridges, offshore oil platforms, power towers, communication towers, and billboards. The performance of these structures in corrosive environments is critical to ensure their overall safety and extend their service life. Although anti-corrosion coatings are widely used in existing steel structures, steel components are unavoidably corroded in complex and changeable environments. Depending on the environment in which the structure is located, uniform and localized corrosion of structural members may occur, with uniform corrosion being easier to control. In addition to using anti-corrosion coatings in practical designs, thin-walled steel members can resist corrosion by adding additional thickness; however, localized corrosion is more unpredictable and difficult to perceive (Hu et al., 2014).
Several researchers have conducted a series of studies on the mechanical properties of thin-walled structures in fully corrosive environments. Under the combined action of long-term loading and chloride corrosion, the bearing capacity, stiffness, and ductility of concrete-filled steel tubes (CFST) are reduced to varying degrees (Hou et al., 2013; Han et al., 2014; Li et al., 2015; Hou et al., 2016). The bearing capacity and energy dissipation capacity of CFST are reduced under the corrosive effect of an acid rain environment (Chen et al., 2018; Yuan et al., 2018). In addition, numerous researchers have conducted comprehensive analyses of the mechanical properties of steel members under local corrosion conditions. Localized galvanic coupling corrosion significantly reduces the ultimate strength of steel tubes and changes their buckling direction. Both circumferential and longitudinal corrosion lead to deviations in the centroid of the section, and the influence of circumferential corrosion on the bearing capacity of a steel tube is greater than that of longitudinal corrosion (Wang H. et al., 2020a). To simulate local corrosion, many scholars have used artificial notches in steel members to simulate local region weakening and have proposed corresponding prediction models to calculate the residual strength of members (Jiang and Soares, 2012; Saad-Eldeen et al., 2013; Ahn et al., 2016; Liang et al., 2020). Both local hole-type and crack-type corrosion reduced the load-deformation capacity and ultimate strength of the members, and the mechanical properties of the hole-notch members were superior to those of the crack-notch members. Local buckling after the yield of the notch region primarily caused the failure of the member, and the closure phenomenon occurred in both types of corrosion notches. The double-peak phenomenon of horizontal notch members after the notch is closed is more conducive to the post-buckling behavior of steel tubes (Wang et al., 2020b; Shan et al., 2022).
However, during the normal service period of steel members, it is impossible to avoid low-frequency, frequent, and extremely harmful impact hazards, such as impact loads caused by automobiles, temporary construction facilities, mountain floods, rockfalls, explosions, earthquakes, or coastal steel members hit by ships. Although the duration of the impact load is short, its instantaneous energy is huge, which poses serious safety risks to steel members. Thus far, several scholars have studied and analyzed the impact resistance of hollow steel members. Hou (Hou, 2012) studied the mechanical properties of circular hollow steel tubes and concrete-filled steel tubes under low-velocity lateral impact and concluded that, compared with concrete-filled steel tube members, the plastic deformation area of hollow steel tube members was concentrated in the drop hammer impact area, the mid-span deflection was larger, and the local deformation was more serious. Numerous experimental studies and finite element simulation analyses were conducted under the influence of different parameters, such as impact position, repeated impact, axial preloading, impact velocity, and different section types, and the corresponding impact energy absorption relationship and empirical formulas were proposed in ref. (Zeinoddini et al., 2002; Bambach et al., 2008; Al- et al., 2011; Shan et al., 2023).
The above studies have not considered the impact of the corrosion environment on the impact performance of steel members, and it is unavoidable for steel members to encounter impact-corrosion conditions in practical engineering applications. Literature (Yulin et al., 2022) investigated the transverse impact response of concrete-filled steel tubular columns with localized corrosion and obtained the corresponding bearing capacity formulas by considering the influence of the impact surface, the length and angle of the cracks, etc., but did not consider the influence of steel fracture. However, the local defect region of the steel member is prone to fracture failure under impact loading, which is unfavorable for the impact resistance of the member. Recently, some interesting methods, such as the element-free kp-Ritz method and the numerical Galerkin method, have been developed and used to analyze the progressive damage and fracture failure of structural materials (Yin et al., 2023a; Yin et al., 2023b). Therefore, this study aims to introduce the fracture parameters of steel in a finite element analysis (FEA) based on previous studies and further explore the effects of corrosion orientation, corrosion length, and impact energy on the impact resistance of circular steel tube columns with localized corrosion.
In this study, numerical models of the lateral impact of circular hollow steel tube (CHST) columns are established using the ABAQUS program. A local notch was used to simulate the localized corrosion of the CHST columns. The impact velocity, notch angle, and notch length effects on the impact resistance and dynamic flexural bearing capacity coefficients of CHST columns were investigated. Based on the simulation results, the CHST mid-span stress development process and its overall energy dissipation mechanism were analyzed. The development trend of the mid-span damage paths of various notch models was described. Subsequently, a prediction method was proposed to consider these parameters for the cross-sectional bearing capacity of a locally notched CHST under lateral impact.
The initial CHST model was established using the ABAQUS software. The initial model had a section diameter D = 500 mm, wall thickness t = 16 mm for the steel tube, and length L = 4,000 mm. The ends of the steel tube were equipped with end plates of diameter 600 mm and thickness 25 mm. One end of the tube was provided with a fixed constraint, and the other with a simple support constraint. The drop hammer mass used in the model was 1,500 kg. The impact position was at the mid-span. The designed impact velocities (V) were 30 km/h, 45 km/h, 60 km/h, 75 km/h, and 90 km/h, and the corresponding impact energies (Ei) were 52.1 kJ, 117.2 kJ, 208.3 kJ, 325.5 kJ, and 468.8 kJ, respectively. Based on this initial model, local corrosion was simulated by setting a local penetrating notch at the mid-span of the steel tube. The width of the local notch is 16 mm. The notch model adopted semi-arc transitions at the notch ends. Simultaneously, different notch lengths (500, 375, and 250 mm) and notch angles (0o, 45o, and 90o) are designed to explore the influence of the above parameters on the dynamic response of the circular hollow steel tube under lateral impact. The specific local corrosion parameters and model numbers are listed in Table 1, and the local corrosion locations and overall model are shown in Supplementary Figure S1A,B.
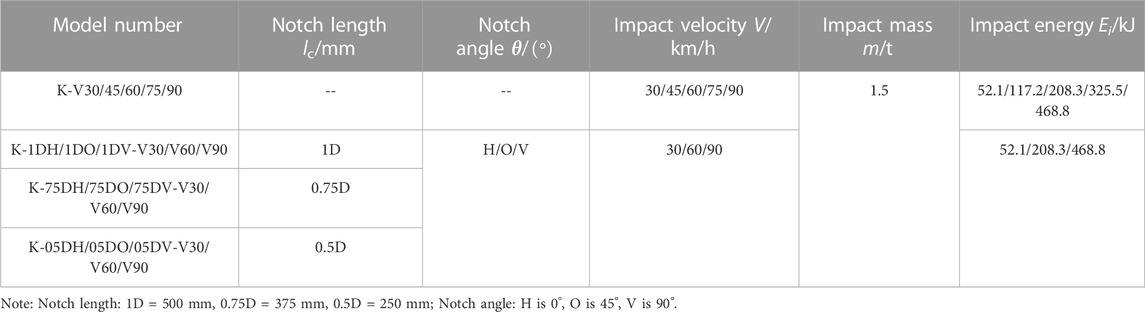
TABLE 1. Parameters of the CHST model.
Steel structures or members are subjected to high strain rates under dynamic conditions, such as high-velocity impacts and explosions. To consider the strain rate effect on steel, scholars at home and abroad have proposed strain rate effect models that can be used to predict the dynamic mechanical properties of metallic materials. The commonly used models are the Cowper-Symonds (C-S) and Johnson-Cook (J-C). The steel used in this model was the C350 steel test data provided in (Al- et al., 2011). According to the test results in (Jones, 1997), the Cowper-Symonds model (Eq. 1) with D = 40.4 s−1 and p = 5 was adopted to consider the strain-rate effect of the material. The material performance and failure parameters are listed in Table 2. In the ABAQUS material setup, an ideal elastic-plastic model based on the Von Mises yield criterion was adopted for steel. The density, yield strength, ultimate strength, elastic modulus, and Poisson’s ratio of the steel were 7,850 kg/m3, 455 MPa, 504 MPa, 200 GPa, and 0.3, respectively (Al- et al., 2011).
Where

TABLE 2. Material properties of C350 (Al- et al., 2011).
The ABAQUS finite element analysis (FEA) model is mainly composed of a circular hollow steel tube, a circular end plate, and a simplified drop hammer (impactor), as shown in Supplementary Figure S1C. The impact position was directly above the mid-span of the circular hollow steel tube. Reference points were set for the drop hammer and circular end plates to facilitate the application of the boundary conditions and impact effects. In this case, fixed and simply supported constraints were set as the reference points of the two endplates. The simply supported constraints allow the axial translation (Ux = Uy = 0) and rotational freedom corresponding to the impact direction (URy = URz = 0) of the circular hollow steel tube, whereas for the drop hammer, the translational degrees of freedom in two directions (Ux = Uz = 0) and the rotational degrees of freedom in three directions (URx = URy = URz = 0) are constrained, except for the translation in the impact direction (vertically downward).
In the finite element (FE) model setting, hard contact was used for the normal direction of the contact surface; that is, the pressure was completely transferred when the two contact surfaces were in contact, and the force was not transferred when the two contact surfaces were separated. Solid unit C3D8R was used to simulate the circular hollow steel tube and end plate. The drop hammer ignored the deformation during impact, and the discrete rigid body unit R3D4 was used for the simulation. The mesh size of the model was 40 mm, and it was locally encrypted within 500 mm of the impact position of the drop hammer to improve the model calculation accuracy. From Supplementary Figure S1D,E, it can be seen that the impact force-time history curves of the model with mesh size 40/10 mm (10 mm is the mesh size of the locally encrypted region) have good stability and accuracy through a series of mesh sensitivity checks for the model (K-V60). As can be seen from the comparison Supplementary Figure S1D,E, the model with a 40/10 mm mesh size achieves the best balance between calculation accuracy and efficiency.
To verify the validity and reliability of the numerical simulation method adopted in this study, the drop hammer tests in (Bambach et al., 2008; Zeinoddini et al., 2002) were simulated and analyzed, and the numerical simulation results were compared with the experimental results.
Bambach et al. (2008) tested a square hollow steel tube specimen (No. 50SHS) with an effective length of 700 mm. The mid-span of the specimen was impacted using a drop hammer with a mass of 600 kg at a falling velocity of 6.2 m/s. The density, elastic modulus, engineering yield stress, and Poisson’s ratio of the steel were 7,850 kg/m3, 200,000 N/mm2, 455N/mm2, and 0.3, respectively (Bambach et al., 2008). Table 3 lists the section sizes and material properties of the specimens. Supplementary Figure S2A shows a detailed diagram of the test device and the FE model. This model validation used the progressive damage and failure models available in ABAQUS/Explicit to detect and track the initiation and evolution of damage until the material unit failed completely. The model considers the equivalent plastic strain at damage initiation as the failure initiation criterion. The failure parameters, such as the strain, triaxial stress, and strain rate values used in the FE model at damage initiation, are listed in Table 4 (Al- et al., 2011).

TABLE 3. Parameters of testing specimens (Bambach et al., 2008).

TABLE 4. Material failure parameters (Al- et al., 2011).
Zeinoddini et al. (2002) conducted an experimental study on the lateral impact responses of axially pre-loaded circular steel tubes. Basic information on the specimens is presented in Table 5. In these tests, the steel tubes were pre-loaded to different axial compression levels and then impacted at mid-span with a drop hammer weighing 25.45 kg at a fall velocity of approximately 7 m/s. The test device and finite element validation model are shown in Supplementary Figure S2B. The steel tube is simulated using a 3D shell element, and the endplate and stiffening rib are simulated using a 3D solid element. Because the drop hammer hardly deforms during impact, it is simulated using a rigid shell element. The classical metal plasticity model in ABAQUS/Explicit was adopted for the steel. The density, elastic modulus, yield stress, and Poisson’s ratio of the steel tube were 7,850 kg/m3, 200,000 N/mm2, 516 N/mm2, and 0.3 respectively (Hou, 2012). The contact algorithm between the drop hammer and the steel tube is surface-to-surface contact, and the effective contact surface with high stiffness is defined as the main surface. The normal ‘hard’ contact method and tangential frictionless method are used to define the interaction between the two contact surfaces. The motion contact strengthening method was used in the model, and the contact between the two bodies was detected according to the finite sliding formula. A compressive load was applied in the axial direction of the model using a linear spring. The linear spring in the steel tube model was set according to the steps of the axial force-impact coupling model in (Hou, 2012).
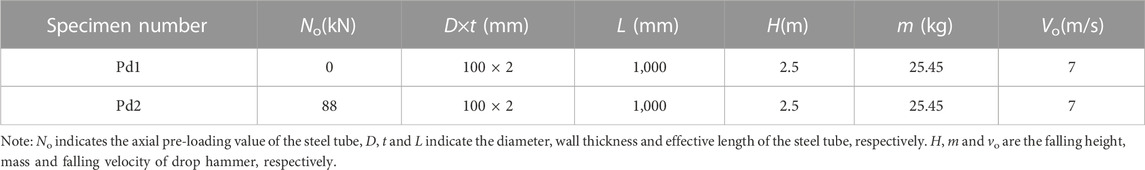
TABLE 5. Basic information of the specimens (Zeinoddini et al., 2002).
The simulation results were compared with the test results. Supplementary Figure S2C–E shows the results of comparing the impact force time-history curve and impact force-displacement curve with overall good agreement. Supplementary Figure S2F accurately simulates the complete tensile tear failure of the specimen at the support. A comparison of the experimental and simulation results shows that the damage initiation and failure criteria of the proposed model are correct when simulating the tensile failure of materials. This indicates that the material constitutive and FE models adopted in this study are reasonable and effective.
All the CHST columns were constrained with fixed simple supports in the finite element simulation. Therefore, under the lateral impact load, the failure of the entire CHST column mainly presented localized indentation and buckling failure, as shown in Supplementary Figure S3A. The plastic hinge area was concentrated in the mid-span drop hammer impact and fixed-end areas, as shown in Supplementary Figure S3B. The upper mid-span surface of the non-notched CHST column exhibited localized indentation at the contact position with the drop hammer.
With an increase in the impact energy, the localized indentation amplitude of the member increased correspondingly, as shown in Supplementary Figure S3C. When the impact velocity was 45 km/h, the mesh on the surface of the CHST model in the impact contact area was deleted, indicating that under the impact velocity, excessive local stress in the indentation area led to element failure, and the surface element lost the ability to sustain the stress. Because of the excessive local deformation of the steel tube at both ends of the impact contact area, the stress was gradually transferred from the outer surface of the steel tube to the interior until the steel in this area completely failed along the thickness direction, resulting in local cracking at an impact velocity of 60 km/h. Additionally, the bottom area of the steel tube near the fixed end began to buckle. When the impact velocity of the drop hammer reached 90 km/h, the steel tube in the mid-span contact area with the impact was completely broken, and the bottom of the steel tube near the fixed end exhibited excessive compressive stress and buckling, eventually leading to compressive fracture failure. Generally, with a gradual increase in impact velocity, the local indentation level of the impact area of the impactor and the buckling amplitude of the fixed-end area increased gradually.
CHST columns with a drop hammer impact velocity of 60 km/h were selected for a comprehensive analysis to understand the stress of the CHST column under lateral impact in detail. Supplementary Figure S3D shows the time-history curves of F/Fm, v/vm, vs/vsm, and u/um of the K-V60 model, where F、v、vs, and u are the impact force, hammer velocity, mid-span velocity, and mid-span deflection of the model respectively, and the symbols with subscript “m” represent the corresponding maximum values.
Three phases are involved in these time-history curves: 1) the ascending phase (from point O to point A): the contact between the drop hammer and the CHST causes the velocity of the CHST to increase rapidly, and when the peak velocity is reached, the velocities of both decrease almost simultaneously. As shown in Supplementary Figure S3F–H, at point A, the contact area between the CHST and drop hammer had a certain extent of indentation, but the global lateral deformation was small. Local damage occurred on the inner and outer surfaces of the steel tube in the impact area, and the middle stress in the direction of the wall thickness of the steel tube in the depression area increased gradually. The impact direction stress generated by the CHST column under the impact of the drop hammer was transferred from the middle of the section to both ends, while a large axial stress also appeared at both ends and the bottom area of the steel tube. 2) Plateau phase (from point A to point B): The drop hammer and CHST column velocities oscillate at small amplitudes and decrease significantly. At point B, the velocities of the model and drop hammer were reduced to zero, the deflection of the CHST column reached its maximum, and the impact force began to decrease. When point B was reached, the internal stress in the impact area of the steel tube spread to the edge of the end, the accumulation of local plastic deformation was too large, and ductile fracture occurred. The impact-direction stress of the section decreased significantly, whereas the axial stress increased, as shown in Supplementary Figure S3F–H. 3) Decline phase (from point B to point C): The deformation of the model begins to recover elasticity. At point C, the impact force decreased to zero, and the model began the free vibration of the rebound process at this phase, with the drop hammer moving away from the model at the final rebound velocity. When point C is reached, local complete fracture occurs at both ends of the section, the stress on both sides of the impact direction increases again with the rebound of the model, and the stress value at both ends of the top of the cross-section of the steel tube in the drop hammer contact area exceeds points A and B. The axial stress in this section was reduced. With increased rebound amplitude, the axial stress in the local fracture area changed from compressive to tensile stress.
As shown in Supplementary Figure S3E, the global energy dissipated by the CHST model (Ep, CHST) no longer increases after point B. Combined with Supplementary Figure S3D and the time-history curve of CHST kinetic energy (Ek, CHST), it can be seen that the impact force of the CHST column is close to the peak point at point A when the impact contact area has a local indentation, the CHST kinetic energy reaches the maximum. Subsequently, the kinetic energies of the drop hammer and CHST column decreased to zero simultaneously, and the bottom steel tube near the fixed end of the CHST column exhibited local indentation in the process of curve decline. The kinetic energy of the CHST column rebound in the BC section was much smaller than that in the OA section, indicating that the kinetic energy of the drop hammer (Ek, drop hammer) was mainly dissipated by the global and local deformations of the steel tube during the entire impact process. In addition, the ALLAE/ALLIE ratio was stable within 5%, indicating that the hourglass technology of the FE calculation results could be controlled, ensuring the reliability of the numerical simulation results.
Supplementary Figure S3I–J shows the time-history curves of the impact force and hourglass ratio for each non-notched model. An increase in the impact energy can increase the peak point of the impact force and the impact duration of the CHST column. However, the impact plateau value did not improve significantly, and the plateau value was basically stable at approximately 1200 kN. Compared with K-V30, the peak impact points of K-V45–K-V90 increased by 23.5%, 29.9%, 29.3%, and 42.5%, respectively, and the impact duration was extended by 6.18%, 28.1%, 47.5%, and 113.1%, respectively, whereas the impact plateau value increased by approximately 18%. In addition, the ALLAE/ALLIE ratio of each CHST column was stable at approximately 5%, which ensured reasonable validity of the material constitutive model and the established FE model. Notably, when the impact energy was large, i.e., K-V90, the proportion of hourglass energy increased, indicating variability in the impact energy on the hourglass energy. This phenomenon has also been pointed out in (Fu et al., 2021); however, the hourglass energy is within 10%, indicating that the calculation process and results are hourglass-controllable and the calculation results are reliable.
The indentation deformation of the model under the impact load reflects its deformation resistance. The residual indentation displacement after the impact rebound was compared to observe the indentation degree of each horizontal notch model. The local notch increased the global deformation, local indentation, and buckling amplitude of the model. With changes in the angle and impact energy, the CHST columns exhibited different failure patterns. Supplementary Figure S3K shows the local residual indentation deformation of the model in the mid-span impact area, where the indentation displacement is the measured value of the indentation in the mid-span section when the CHST model impact force drops to zero. For the non-notch model, with a step-by-step increase in the impact velocity, the mid-span indentation displacement of the model at all levels increased by 52.9%, 33.3%, 31.9%, and 17.3%, respectively, compared to that of the model at lower levels, as shown in Supplementary Figure S3M. In addition, when the impact velocity reached 45 km/h, the growth range of the indentation displacement gradually decreased as the impact velocity increased. This is because when the impact velocity gradually increased to 60 km/h, the steel tube at the bottom area of the fixed end of the model began to buckle outwards, and the buckling amplitude became increasingly evident with a gradual increase in the impact velocity. This indicates that when the impact potential energy in the model was low, the energy was mainly consumed by the deformation of the mid-span indentation. With an increase in the impact potential energy, the local buckling deformation at the bottom of the fixed end began absorbing a part of the impact potential energy. Consequently, the amplitude growth of the mid-span indentations slowed.
Supplementary Figure S4A shows the final failure patterns of the model with a horizontal notch at mid-span. When the impact velocity was 30 km/h, the model with the smallest notch length exhibited local damage on the surface area at both ends of the notch, and the stress distribution in the middle of the notch was small. This indicated that the local deformation at both ends of the notch was large, resulting in excessive stress. However, with an increase in the notch length, the local deformation ability increased, and the local stress at both ends of the notch decreased. With an increase in the impact velocity, a fracture occurred in the impact area of the drop hammer, and the damaged surface started from both ends of the notch and extended to both sides. Through an analysis of the influence of the impact velocity, the horizontal notch model showed local buckling at the bottom of the fixed end only when the impact velocity reached 90 km/h, as shown in Supplementary Figure S4B.
The mid-span indentation displacement of the model with impact velocities of 30 km/h and 60 km/h were compared. Supplementary Figure S4C shows that the notch length had little effect on the degree of indentation; however, increasing the impact velocity increased the mid-span indentation displacement of the model significantly. The global increase range is about 109.8%–117.8%. The global indentation displacements of the three notch models with different lengths were similar because the horizontal notch direction was consistent with the cross-sectional direction of the model. This was beneficial for the elastic recovery of the model after impact within the elastic range. The model with an impact velocity of 30 km/h exhibited no cracking in the notch area during the impact process, whereas the model with an impact velocity of 60 km/h exhibited cracking damage at both ends of the notch during the impact process, and the damage path extended to both sides. Therefore, the indentation degree of each notch length model was essentially the same after the rebound. Compared with the non-notch model, when the impact velocity was increased to 60 km/h, the displacement of the horizontal notch model increased by approximately 4%–16%. Supplementary Figure S4D shows that with an increase in impact velocity, the indentation displacement of the non-notch model increased by 103.8% and 57.7%. However, the mid-span indentation displacements of the notched model with velocities of 30 and 60 km/h were approximately 29.3% and 36.3% higher than those of the non-notched model, respectively.
Supplementary Figure S5A shows the damage pattern of the oblique notch model in the local notch area. When the impact energy is low, slight damage or cracking occurs at both ends of the notch. As the notch length increases, the range of local buckling in the impact region increases. The damage depth in the span is proportional to the increase in the impact velocity, and increasing the notch length expands the damage area of the impact area.
The increase in the impact velocity had an obvious influence on the oblique notch model. CHST models with an oblique notch length of 375 mm were used for the analysis. From the perspective of the entire impact process, when the impact velocity was 60 km/h, the impact failure of the oblique notch model exhibited two successive failure paths. Point 1 at the end of the notch appeared to fracture first, and point 2 began to fracture when the crack developed downward to point A. When the impact velocity was 90 km/h, three failure paths successively appeared in the impact damage of the notch model. The fracture began at point 3, and as it descended to point B, point 4 fractured. Until the fracture path developed to point C, the fracture failure also occurred at point 5, as shown in Supplementary Figure S5B. The global failure patterns of a typical model are presented in Supplementary Figure S5C. Similar to the horizontal notch model, local buckling occurred at the bottom of the fixed end of the model when the impact velocity reached 90 km/h; however, the buckling amplitude was smaller than that of the horizontal notch model. This may be because the oblique notch model has multiple failure paths in the mid-span notch region, in which more energy is dissipated and the buckling deformation of the end is reduced. Generally, tensile fractures (points 1 and 3), compressive fractures (points 2, 4, and 5), and local buckling were observed in the oblique notch model.
Supplementary Figure S5D compares the mid-span indentation displacements of the oblique notch model with impact velocities of 30 km/h and 60 km/h. As the notch length and impact velocity increased, the corresponding notch models improved by 183.8%, 172.9%, and 197.3%, respectively. Supplementary Figure S5E compares the indentation displacements between the oblique notch and non-notch models. Compared with the non-notch model, the maximum increases in indentation displacement were 47.8% and 115.6%, respectively. For the oblique notch model with impact velocities of 30 km/h and 60 km/h, with an increase in the notch length, the mid-span indentation displacement of the model increased by approximately 7.6% and 10.2%, respectively, on average. Compared to the horizontal notch model, the oblique notch had a greater influence on the indentation displacement in the model, and the indentation displacement of the model was proportional to the increase in notch length.
Supplementary Figure S6A shows the damage patterns in the mid-span impact region of the vertical notch model. The local deformation degree of the model increased gradually with the impact velocity, and a local closure phenomenon appeared in the middle of the notch. In addition, the local deformation of the model is less affected by the notch length. Compared with the horizontal and oblique notch models, the impact damage range and degree of the vertical notch model in local indentation and local buckling deformation were the smallest, and the vertical notch model showed better impact resistance.
In the vertical notch model, when the impact velocity reaches 60 km/h, significant damage begins to appear in the impact area. The CHST models with a vertical notch length of 375 mm (0.75D) were used for the analysis. Considering the entire impact process, when the impact velocity increased to 90 km/h, significant damage occurred in the impact area of the model. The damage patterns and paths are shown in Supplementary Figure S6B. Damage and failure began at point 1 and spread to the surroundings and both sides of the steel tube. Local buckling and fracture failure also occurred at the bottom of the fixed end. The global damage patterns of the model are shown in Supplementary Figure S6C. When the impact velocity was 60 km/h, slight buckling occurred at the end of the model. When the impact velocity reached 90 km/h, obvious local buckling and fracture failure occurred at the bottom of the fixed end, which was much greater than the damage degree of the horizontal and oblique notch models. Compared with the horizontal and oblique notch models, when the impact velocity was small, the global damage degree of the vertical notch model was lighter, showing a relatively better impact resistance performance. With increased impact velocity, the vertical notch model had the smallest mid-span indentation depth, but the most evident buckling damage occurred in the fixed-end area.
Supplementary Figure S6D shows that the notch length has little influence on the mid-span indentation displacement of the overall model. With an increase in the notch length and impact velocity, the corresponding mid-span notch model increased by 96.0%, 88.6%, and 86.1%, respectively. Supplementary Figure S6E shows that for the oblique notch model with impact velocities of 30 km/h and 60 km/h, respectively, the model’s mid-span indentation displacement increased by 3.6% and 1.9% on average with increased notch length, and the maximum increase in the indentation displacement were 9.7% and 1.1% compared with the non-notch model. In general, among the three notch models, the vertical notch model was the least affected by notch length and impact velocity, and the indentation displacement had the smallest variation range. Therefore, the vertical notch model exhibited the best impact resistance performance.
At a given impact velocity (60 km/h), the deformation and damage in the localized region of the mid-span of the model were observed. In Supplementary Figure S6F, the damage areas of the horizontal and oblique notch models rapidly expand with the cracking of the notch ends, while the vertical notch model only shows relatively stable localized damage on both sides of the notch. A simplified diagram of the damaged area in the mid-span region of the model for different notch angles and notch lengths is shown in Supplementary Figure S6G. It can be seen that with the increase of the notch length, the damaged regions of the horizontal notch and vertical notch models were essentially unaffected, while the damaged region of the oblique notch model was more affected, and its damaged region along the longitudinal and transverse directions would gradually be closer to the notch location.
The CHST column impact process can be divided into four stages: contact, common movement, peak displacement, rebound, and separation. The drop hammer was placed 5 mm away from the impact area of the CHST column because the drop hammer freefall process was not considered in the FE model. Therefore, the four stages of the entire impact process correspond to the time-history curve of the impact force and mid-span displacement in Supplementary Figure S7A. The stages are divided into an ascending phase corresponding to the common movement stage, a plateau phase corresponding to the peak displacement stage, and a descending phase corresponding to the rebound and separation stages.
In the plateau phase of the impact time-history curve, because the CHST column entered the plastic-hinge energy-dissipation stage, the model’s acceleration was relatively small and stable. The impact force at this stage reflects the dynamic restoring force level of the component and, to a certain extent, the plastic energy dissipation capacity of the model. Therefore, the calculation method for the average impact force after the peak value proposed by Wang (Wang et al., 2014) provides a reasonable estimation of the impact platform value Fp of the CHST column under lateral impact, as shown in Eq. 2.
Where wo is the global mid-span displacement when the impact force reaches the maximum Fm, um is the global maximum mid-span displacement, and F is the impact force.
Because the impact velocity was relatively small, the impact resistance of the model was less significantly affected by various factors. Therefore, the model with an impact velocity of 60 km/h was selected for comparative analysis. Supplementary Figure S7B shows that the initial damage points of both the horizontal and oblique notch models were located at the notch end, whereas those of the vertical notch models were more similar to those of the non-notch models. Compared with the initial damage time point of the non-notch model, the damage times of the horizontal and oblique notch models were approximately 6.7% and 26.7% earlier, respectively, whereas that of the vertical notch models was approximately 16.7% later. Based on the impact force value corresponding to the initial damage point of the non-notch model, the impact force values corresponding to the initial damage points of the horizontal, oblique, and vertical notch models decreased, and the reduction amplitudes were 16.9%, 28.5%, and 1%, respectively. Compared to the non-notch model, the horizontal and oblique notches increased the shock amplitude of the platform section of the impact force time-history curve, and the presence of the notch slightly prolonged the impact duration.
When the drop hammer acted directly on the notch position, the degree of damage was significantly greater than that in the non-notch model, and the impact duration was slightly longer. Supplementary Figure S7C–E compares the descending section of the impact force time-history curve of the non-notch and mid-span notch models. A notch length of 250 mm (0.5D) was used for analysis. The damaged area of the mid-span horizontal notch model expanded when the curve entered the descending phase, the impact plateau phase decreased significantly, and the oscillation was evident. The end of the plateau phase of the impact force time-history curve of the oblique notch model was recovered; however, the damage area was larger, and the degree of damage was more serious. The damage area of the vertical notch model was close to that of the non-notch model, and the performance of the impact force time-history curve at each stage was stable. Among the three notch angles, the vertical notch model exhibited the highest impact resistance.
Supplementary Figure S7F compares the impact time-history curves of the notch model under different impact velocities. With an increase in impact velocity, the impact plateau of each model increased slightly, but the plateau segment duration and the overall impact duration were significantly extended. Compared to the non-notch model with an impact velocity of 30 km/h, the overall impact duration of the non-notch model increased by 28.1% and 113.1%, and that of the horizontal notch model increased by 2.7%, 37.0%, and 56.6%, respectively. The K-05DH-V90 model exhibited a sharp increase in the impact time-history curve during the impact process. This is because the stress of the steel tube at both ends of the notch in the horizontal notch model increased sharply when in contact with the drop hammer in the face of a high impact velocity, resulting in fracture cracks in the notch area that developed along both sides (i.e., point A). The mid-span deflection of the model was almost constant. The steel tube in the area of the curved contact surface of the drop hammer was then thrust off, and the drop hammer contacted the steel tube only on two sides (i.e., point B). At this point, the mid-span deflection of the model gradually increased. The steel tube in the contact area between the two sides was damaged and destroyed, and the drop hammer continued to fall (point C). Mid-span deflection increased significantly during this time. Until the steel tube in the two-sided contact area was no longer damaged or destroyed, the kinetic energy of the drop hammer decreased (i.e., point D), and the impact force gradually decreased to zero. Similar phenomena also appeared in the impact force time-history curves of models K-75/1DH-V90 and K-05/75/1DO-V90. The fundamental reason is that the steel tube in the drop hammer contact area was damaged prematurely, resulting in the drop hammer being directly in contact with the side steel tube under a large kinetic energy. Then, the impact force time-history curve showed a sharp rise. The K-05DH-V90 model was compared with K-90, as shown in Supplementary Figure S7F. The impact plateau segment of the impact force time-history curve of the model with this phenomenon obviously increased; however, the overall impact duration was shortened to a certain extent, and the corresponding improvement and shortening ranges were approximately 77.3% and 26.5%, respectively.
A comparison of the impact plateau values of each model is shown in Supplementary Figure S3G–I. In general, the notch length did not influence the impact plateau value. When the impact velocity was 30 km/h, the impact plateau value of the model was lower than that of the non-notch model, and the impact plateau values of the oblique and horizontal notch models decreased significantly. With the increase in the impact velocity, the impact plateau value of the model gradually increased with the change in the notch angle (i.e., vertical, oblique, and horizontal). In general, the impact plateau value of the vertical notch model was the least affected by the notch length, notch location, and impact velocity, showing good impact resistance stability, whereas the increase in impact velocity effectively increased the impact plateau value of the horizontal gap model, which corresponds to the sharp rise of the impact force time-history curve in Supplementary Figure S7F.
The mid-span displacement time-history curve of the non-notch model is shown in Supplementary Figure S8A. When the impact velocities were 30 km/h and 45 km/h, the rebound amplitude of the mid-span displacement of the model was not obvious after reaching the peak, showing a wavy curve. As the impact velocity continued to increase, the mid-span displacement time-history curves of the model exhibited an obvious rebound. Overall, with a step-by-step increase in the impact velocity, the increase in the mid-span peak displacement of each stage was 203.0%, 118.1%, 105.6%, and 108.2, respectively. Supplementary Figure S8B shows that the ratios of the local indentation degree to the peak displacement under different impact velocities were 9.3%, 18.5%, 30.2%, 47.1%, and 83.6%. It was again shown that the CHST columns were dominated by global bending and local indentation deformation under lateral impact.
The influence of the notch angle and length on the model mid-span displacement is also different. The effects of changes in the notch angle and length on the mid-span displacement of the model were also different. As shown in Supplementary Figure S8C–E, compared with the non-notch models, when the impact velocity is 30 km/h, the variation ranges of peak displacement in the horizontal, oblique, and vertical notch models are 4.9%, −6.3%, and 12.5%, respectively. When the impact velocity increased to 60 km/h, the horizontal, oblique, and vertical notch models changed by −47.2%, −45.5% and 7.2%, respectively. When the velocity continued to increase to 90 km/h, the changes of peak displacement in the horizontal and oblique notch models were −50.2% and −50.5%, respectively, while that in the mid-span vertical notch model was increased by 32.4%. Therefore, the horizontal and oblique notches reduced the mid-span displacement of the model. Supplementary Figure S8F compares the mid-span displacement time-history curves of the horizontal notch model and the non-notch model when the impact velocity is 60 km/h. Based on the displacement time history curve of the K-05DH-V60 model, with the change in notch length, the change in the amplitude of the peak displacement in the span of the notch model was 15.5%, whereas that of the peak displacement in the non-notch model was 90.3%.
Overall, the global displacement of the vertical notch model with impact velocity of 30 km/h and 60 km/h was close to that of the non-notch model, and the curve trend was consistent with that of the non-notch model. With an increase in the impact velocity, the global displacement of the horizontal and oblique notch models decreased. This may be because the horizontal and oblique notch models exhibited relatively large local deformations or damage in the impact region of the drop hammer, and more impact energy was dissipated during the process of local deformation and damage; therefore, the global displacement of the model was relatively small. However, the degree of local deformation and damage in the impact area of the vertical notch model was smaller than that of the horizontal and oblique notch models, and the impact energy needed to be dissipated by the global bending deformation; therefore, the global displacement of the vertical notch model was increased. Notably, when the impact velocity was 90 km/h, the mid-span displacement curve of the vertical notch model was inconsistent with that of the horizontal and oblique notch models. This is because there was no obvious impact damage in the impact area of the drop hammer. However, the larger impact energy caused the two sides of the mid-span section and the end area to exhibit buckling and fracture, and the global bending range of the model was larger.
In this study, the rebound of the drop hammer and other energy losses were ignored, and the energy (Eg) absorbed by the global bending deformation of the CHST column was defined as the area surrounded by the impact force-displacement curve obtained by the drop hammer impact. The instantaneous kinetic energy before the impact of the drop hammer was adopted as the impact energy of the whole system, that is Ei = 0.5mv2. A typical impact force-global bending displacement curve for the CHST column is shown in Supplementary Figure S8G. Thus, the energy absorption ratio (EAR) of the global deformation of the model can be obtained as EAR = Eg/Ei. The impact resistance of the CHST column under a lateral impact load was evaluated based on the variation in the EAR of each model. Supplementary Figure S8H shows the displacement nephogram of the impact direction of the drop hammer and the global bending displacement picking position at the mid-span for the K-V30 and K-05DH-V90 models. The model EAR calculated from the top and bottom points of the mid-span section corresponding to the impact force-global bending displacement curve were compared. In Supplementary Figure S8I, the EAR calculated using the impact force-global bending displacement curve corresponding to the peak points on the top and bottom surfaces are significantly different. With an increase in the impact energy, the pick points of the top and bottom surfaces increased by 3.0%, 2.5%, 1.9%, and 1.7%, and 164.9%, 59.1%, 39.6%, and 35.1%, respectively, compared with those of the upper model. Overall, with an increase in the impact energy, the increasing trend was approximately linear, but the rate of increase gradually decreased. The EAR calculated at the top picking point was in the range of 88.5%–96.7%, while the EAR calculated at the bottom picking point was in the range of 5.5%–43.3%. The reason for the obvious difference in the EAR between the two is that when the model impact energy was low, its global bending displacement was much smaller than that of the local indentation displacement at the mid-span. In this case, the impact energy was mainly absorbed by the mid-span local deformation, whereas the energy absorbed by the global deformation of the model was very small. With an increase in impact energy, the growth rate of the global bending displacement of the model was greater than that of the local deformation; therefore, the corresponding growth rate of the bottom points was larger.
Notably, the linear rise of the impact force at the beginning of the impact in Supplementary Figure S8G occurs because the impact force increases too rapidly at the same time, while the displacement increment at the bottom is too small; therefore, a linear rise occurs at the beginning of the impact force-global bending displacement curve. In addition, a negative increase in displacement occurs after the straight upward section because the peak point is at the bottom. At the moment of the impact of the drop hammer, there was no support inside the steel tube. Under inertia, the bottom steel tube moved in the direction opposite to the impact of the drop hammer; however, the movement duration was very short.
The bottom point of the FE model is the energy absorbed by the global deformation of the model, whereas the top point contains the local and global deformations in the span. Therefore, the impact force-global bending displacement curve corresponding to the top surface point better reflects the absorption of the impact energy of the entire model. Supplementary Figure S8J shows the proportion of energy absorbed by the global and local indentation deformations in each non-notched model. With an increase in impact energy, the energy absorbed by the local indentation (top surface point) gradually decreased, whereas the energy absorbed by the global deformation (bottom surface point) gradually increased. However, the distribution of the two ratios indicated that the global impact energy of the CHST column was mainly absorbed by the local indentation deformation in the mid-span under the action of lateral impact. It is worth noting that Supplementary Figure S8H shows that the mid-span horizontal notch model is prone to local failure when the impact energy is large, resulting in the inability to obtain the top point of the mid-span cross-section to observe its energy absorption. Therefore, the impact force-global bending displacement curve corresponding to the bottom point of the notch model was used to analyze the influence of different notch lengths and notch angles on the global EAR of the model.
Supplementary Figure S8K shows that the EAR of the mid-span notch model is proportional to the improvement in impact energy, whereas the notch length has little effect on the EAR of the FE model. The vertical notch increased the EAR of the model, whereas the horizontal and oblique notches significantly decreased it. Compared with the EAR of the non-notch model, the EAR of the vertical notch model at the three impact velocities (30 km/h, 60 km/h, 90 km/h) increased by 20.2%, 13.5%, and 17.3%, respectively, whereas the EAR of the horizontal notch and oblique notch models decreased by 28.2%, 61.0%, 42.4%, and 29.1%, 62.7%, and 49.3%, respectively. Among the three notch angles, the vertical notch was beneficial for EAR improvement, whereas the oblique notch was the most unfavorable.
In general, the EAR was proportional to the increase in impact energy, and the impact energy of the model was absorbed by the local indentation deformation and global bending deformation in the span. With an increase in the impact energy, the energy absorbed by the mid-span local indentation deformation decreased gradually, and the energy absorbed by the global bending deformation increased gradually. However, most of the impact energy was absorbed mainly by the mid-span local indentation deformation.
To analyze the influence of various parameters on the dynamic flexural capacity of CHST columns, the simplified formula of the dynamic flexural capacity (Mcr) of the notch model under the action of mid-span lateral impact is defined as follows:
where Mcr is the bending moment corresponding to the maximum value of the global mid-span bending displacement of the notched model, and Mu is the bending moment corresponding to the maximum value of the mid-span global bending displacement of the non-notched model. The specific data of both are obtained from the FEA results.
Rd is the influence coefficient of the dynamic bending capacity of the model, which can also be regarded as the ratio of the maximum mid-span global bending displacement corresponding to the bending moment value (Mcr) of the notch model to the maximum mid-span global bending displacement corresponding to the bending moment (Mu) of the non-notch model, which is related to the notch length, notch angle, and impact velocity.
Supplementary Figure S9A–C shows the ratio of the dynamic bending capacity between each notch model and the non-notch model. It can be observed from the figure that when the impact velocity is low, the Rd variation trend of the notch model is inversely proportional to the increase in the notch length. With the change of notch angle (H, O, V), when the impact velocity is 30 km/h, the maximum change amplitude of model Rd is −36.5%, −11.5%, and −19.2%, respectively. With increased impact velocity, the Rd of each notch model improved overall. Because Rd is an artificially defined practical calculation factor, its local variation trend may not be monotonous. As shown in Supplementary Figure S9C, an increase in the impact velocity brings greater impact energy to the model, which causes more local damage to the impact region. When the strain rate of the material increased after the impact, the dynamic flexural capacity of the model increased without damage. However, owing to the damage to the material and the existence of a local notch, the local mesh of the model has a certain variability under a large impact energy, which leads to large fluctuations and a certain discreteness of the data. In general, with an increase in the impact velocity, the Rd of the horizontal notch model increased significantly, whereas the Rd of the oblique and vertical notch models increased slightly.
CHST columns are mainly characterized by local indentation and global bending deformation under lateral impact loads, and the appearance of local notches affects the failure pattern and failure degree of the model. An important index for measuring the impact resistance of CHST columns is the influence coefficient Rd of the dynamic bending capacity of CHST columns under an impact load. The dynamic bending strength of the model section can then be calculated. Based on a large number of FE results, this study selected the key factors affecting Rd in the FEA results, including the notch length (lc), notch angle (
where,
The units and range of application of parameters of the practical calculation formula are shown in Table 6.

TABLE 6. Application range of practical formula of Rd.
Supplementary Figure S9D–E compare the FEA values of Rd and Mcr for each notch model with the values predicted by the simplified formula. The relative error between the two results is less than 10%, which indicates that the fitting formula is in good agreement with the influence coefficient of the FE dynamic bending capacity, and the fitting accuracy is high.
In this study, the localized corrosion of a CHST was simulated by a localized penetrating notch through a series of numerical simulations. The lateral impact responses of the CHST columns were simulated using different impact energies, notch lengths, and notch angles. The following conclusions were drawn.
(1) The CHST column exhibited global bending failure under a mid-span lateral impact load, accompanied by local indentation deformation in the impact area and local buckling deformation at the bottom of the fixed end. The global and local deformation amplitudes of the model were proportional to the increase in the impact energy. Compared with the non-notch model, the horizontal notch model had a relatively stable increase in mid-span indentation displacement at impact velocities of 30 km/h and 60 km/h, with average increases of 29.3% and 36.3%, respectively. For the oblique and vertical notch models, the displacement of the mid-span indentation increased slightly with increased notch length at impact velocities of 30 km/h and 60 km/h. In this case, the maximum increase of the oblique notch model was approximately 47.8% and 115.6%, and the vertical notch model was approximately 9.7% and 1.1%, respectively. The mid-span indentation displacements of the horizontal and vertical notch models were less.
(2) The impact force time-history curve of the entire process of the CHST column can be divided into three phases: the ascending, plateau, and decline phases; the end of the plateau phase of the curve corresponds to the peak point of the mid-span displacement curve. Compared to the non-notch model, the horizontal and oblique notches increased the amplitude of oscillations in the plateau section of the impact force time-history curve, and the existence of a notch slightly prolonged the impact duration. The local damage area and impact time history curves of the vertical notch model were more consistent with those of the non-notched model, and increasing the impact energy and decreasing the notch angle increased the impact plateau value of the model gradually. Among the three notch angles, the impact plateau value of the vertical notch model and the global bending displacement in the mid-span were the least affected by the notch length and impact energy.
(3) The EAR of the model was proportional to the increase in impact energy, and the energy absorbed by the local indentation in the mid-span was significantly greater than the energy absorbed by global bending. Compared to the non-notch model EAR, at 30 km/h, 60 km/h and 90 km/h, the vertical notch model EAR increased by 20.2%, 13.5%, and 17.3% on average, whereas the horizontal notch model EAR decreased by 28.2%, 61.0%, and 42.4%, and the oblique notch model EAR decreased by 29.1%, 62.7%, and 49.3%, respectively.
(4) When the impact energy was low, the variation trend of the notch model Rd was inversely proportional to the increase in notch length. When the impact velocity is 30 km/h, the Rd of each notch model changes with the notch angles (H, O, and V), and the maximum variation range of Rd is −36.5%, −11.5%, and −19.2%, respectively; however, with the increase of impact velocity, the Rd of each notch model showed an overall upward trend, and the Rd of horizontal notch model increased the most.
(5) Based on the results of the parametric analysis, a prediction formula for the dynamic bending capacity of the CHST column section considering the influences of the notch length, notch angle, and impact energy was proposed by regression analysis, which is in good agreement with the numerical results.
The original contributions presented in the study are included in the article/Supplementary Material, further inquiries can be directed to the corresponding author.
XH: Methodology, Investigation, Writing–original draft. YW: Data curation, Conceptualization, Writing–review and editing.
The author(s) declare that no financial support was received for the research, authorship, and/or publication of this article.
The authors declare that the research was conducted in the absence of any commercial or financial relationships that could be construed as a potential conflict of interest.
All claims expressed in this article are solely those of the authors and do not necessarily represent those of their affiliated organizations, or those of the publisher, the editors and the reviewers. Any product that may be evaluated in this article, or claim that may be made by its manufacturer, is not guaranteed or endorsed by the publisher.
The Supplementary Material for this article can be found online at: https://www.frontiersin.org/articles/10.3389/fmats.2023.1321892/full#supplementary-material
Ahn, J., Choi, R. W., Jeon, H. S., Kim, S. H., and Kim, I. T. (2016). Residual compressive strength of inclined steel tubular members with local corrosion. Appl. Ocean Res. 59, 498–509. doi:10.1016/j.apor.2016.07.002
Al-Thairy, H., and Wang, Y. (2011). A numerical study of the behaviour and failure modes of axially compressed steel columns subjected to transverse impact. Int. J. Impact Eng. 38 (8), 732–744. doi:10.1016/j.ijimpeng.2011.03.005
Bambach, M., Jama, H., Zhao, X., and Grzebieta, R. (2008). Hollow and concrete filled steel hollow sections under transverse impact loads. Eng. Struct. 30 (10), 2859–2870. doi:10.1016/j.engstruct.2008.04.003
Chen, M. C., Zhang, F. M., Huang, H., Wang, C., et al. (2018). Study on seismic performance of concrete filled square steel tubes subjected to simulated acid rain attack. J. China Railw. Soc. 40 (06), 106–114.
Fu, C. J., Wang, Z. H., and Wang, K. (2021). Study on the residual bearing capacity and damage of concrete-filled steel tube (CFST) column subjected to transverse impact. Build. Sci. 37 (05), 11–20+27. doi:10.13614/j.cnki.11-1962/tu.2021.05.002
Han, L., Hou, C., and Wang, Q. (2014). Behavior of circular CFST stub columns under sustained load and chloride corrosion. J. Constr. Steel Res. 103, 23–36. doi:10.1016/j.jcsr.2014.07.021
Hou, C. C. (2012). Study on performance of circular concrete-filled steel tubular (CFST) members under low velocity transverse impact. China National Knowledge Infrastructure.
Hou, C., Han, L., Wang, Q., Hou, C., et al. (2016). Flexural behavior of circular concrete filled steel tubes (CFST) under sustained load and chloride corrosion. Thin-Walled Struct. 107, 182–196. doi:10.1016/j.tws.2016.02.020
Hou, C., Han, L., and Zhao, X. (2013). Full-range analysis on square CFST stub columns and beams under loading and chloride corrosion. Thin-Walled Struct. 68, 50–64. doi:10.1016/j.tws.2013.03.003
Hu, J., Tian, Y., Teng, H., Yu, L., and Zheng, M. (2014). The probabilistic life time prediction model of oil pipeline due to local corrosion crack. Theor. Appl. Fract. Mech., 70. doi:10.1016/j.tafmec.2014.04.002
Jiang, X., and Soares, G. C. (2012). Ultimate capacity of rectangular plates with partial depth pits under uniaxial loads. Mar. Struct. 26 (1), 27–41. doi:10.1016/j.marstruc.2011.12.005
Li, W., Han, L., and Zhao, X. (2015). Behavior of CFDST stub columns under preload, sustained load and chloride corrosion. J. Constr. Steel Res. 107, 12–23. doi:10.1016/j.jcsr.2014.12.023
Liang, F., Jingke, H., Luocun, H., Shi, H., Yu, C., Wang, S., et al. (2020). A parametric study on effects of pitting corrosion on steel plate's ultimate strength. Appl. Ocean Res. 95 (C), 102026. doi:10.1016/j.apor.2019.102026
Saad-Eldeen, S., Garbatov, Y., and Soares, G. C. (2013). Ultimate strength assessment of corroded box girders. Ocean. Eng. 58, 35–47. doi:10.1016/j.oceaneng.2012.09.019
Shan, G., Youchun, X., Sumei, Z., and Anna, D. (2023). Performance of square concrete-filled steel tubular columns under repeated lateral impact. Eng. Struct., 280. doi:10.1016/j.engstruct.2023.115719
Shan, G., Yulin, W., Lanhui, G., Xu, Y., and Iyama, J. (2022). Axial behavior of circular steel tube with localized penetrating corrosion simulated by artificial notch. Thin-Walled Struct., 172. doi:10.1016/J.TWS.2022.108944
Wang, H., Zhang, Z., Qian, H., Liu, Y., Hu, N., and Fan, F. (2020a). Galvanic corrosion induced localized defects and resulting strength reduction of circular steel tubes under axial compression: an experimental study. Thin-Walled Struct., 154. doi:10.1016/j.tws.2020.106881
Wang, R., Guo, H., and Shenoi, A. R. (2020b). Experimental and numerical study of localized pitting effect on compressive behavior of tubular members. Mar. Struct. 72 (C), 102784. doi:10.1016/j.marstruc.2020.102784
Wang, Y., Qian, X., Liew, R. J., and Zhang, M.-H. (2014). Experimental behavior of cement filled pipe-in-pipe composite structures under transverse impact. Int. J. Impact Eng., 72. doi:10.1016/j.ijimpeng.2014.05.004
Yin, B. B., Akbar, A., Yang, Z., and Liew, K. M. (2023b). Modeling progressive failure and crack evolution in a randomly distributed fiber system via a coupled phase-field cohesive model. Compos. Struct., 313. doi:10.1016/j.compstruct.2023.116959
Yin, B. B., Sun, W. K., Yang, Z., and Liew, K. M. (2023a). Modeling via peridynamics for large deformation and progressive fracture of hyperelastic materials. Comput. Methods Appl. Mech. Eng., 403. doi:10.1016/j.cma.2022.115739
Yuan, F., Chen, M., Huang, H., Xie, L., and Wang, C. (2018). Circular concrete filled steel tubular (CFST) columns under cyclic load and acid rain attack: test simulation. Thin-Walled Struct. 122, 90–101. doi:10.1016/j.tws.2017.10.005
Yulin, W., Shan, G., Youchun, X., and Li, F. (2022). Lateral impact response of concrete-filled square steel tubes with local defects. Build. 12 (7), 996. doi:10.3390/buildings12070996
Keywords: localized corrosion, steel tube, impact, numerical simulation, local indentation displacement
Citation: Huang X and Wang Y (2023) Lateral impact response of circular hollow steel tubes with mid-span localized penetrating notches. Front. Mater. 10:1321892. doi: 10.3389/fmats.2023.1321892
Received: 15 October 2023; Accepted: 09 November 2023;
Published: 23 November 2023.
Edited by:
Adesola Ademiloye, Swansea University, United KingdomReviewed by:
Wei Zhang, Fujian University of Technology, ChinaCopyright © 2023 Huang and Wang. This is an open-access article distributed under the terms of the Creative Commons Attribution License (CC BY). The use, distribution or reproduction in other forums is permitted, provided the original author(s) and the copyright owner(s) are credited and that the original publication in this journal is cited, in accordance with accepted academic practice. No use, distribution or reproduction is permitted which does not comply with these terms.
*Correspondence: Yulin Wang, MjMwMTEwODYwMDVAc3R1LmhxdS5lZHUuY24=
Disclaimer: All claims expressed in this article are solely those of the authors and do not necessarily represent those of their affiliated organizations, or those of the publisher, the editors and the reviewers. Any product that may be evaluated in this article or claim that may be made by its manufacturer is not guaranteed or endorsed by the publisher.
Research integrity at Frontiers
Learn more about the work of our research integrity team to safeguard the quality of each article we publish.