 Jing Wang
 Tianren Wang
 Yunlong Zhang*
 Xuesong Qian
- School of Transportation Science and Engineering, Jilin Jianzhu University, Changchun, China
Using glass sand as a substitute for sand in high-performance concrete not only conserves resources but also helps protect the environment. This study replaced manufactured sand with glass sand and added carbon fiber to prepare high-performance shotcrete. Its mechanical and self-sensing properties were then tested separately. The findings suggest that with an increase in glass sand content, the compressive strength of high-performance shotcrete initially rises and subsequently declines. When the replacement ratio of glass sand is 75%, the compressive strength exhibits its maximum value, whereas an increase in the glass sand content leads to a reduction in both splitting tensile strength and flexural strength. Although increasing carbon fiber content does not significantly contribute to compressive strength, it significantly improves flexural strength and splitting tensile strength. In addition, when testing the self-sensing performance of the material, it was found that its self-sensing performance increased significantly with increasing carbon fiber content but decreased with increasing glass sand content. Finally, an Ansys APDL simulation using the relevant parameters of the optimal group of mechanical properties was performed to model a tunnel and verify its feasibility and validity. This study provides a theoretical and practical reference for future engineering applications.
1 Introduction
Concrete stands as one of the most extensively employed construction materials in contemporary building practices. Its numerous benefits encompass ease of shaping, minimal energy requirements, exceptional longevity, cost-effectiveness, and strong compatibility with steel. Nevertheless, concrete does exhibit certain drawbacks, including brittleness and relatively limited tensile strength, constraining its extensive application in specific domains. Shotcrete is one of the more typical engineering applications of concrete. In tunnel construction, traffic tunnels are usually lined with a composite lining, with the initial ground support being of the sprayed anchor type and the secondary lining serving as a safety reserve. Although the composite lining in the bearing mechanism is reasonable and reflects the “first time, after the stiffness” principle, its conservative engineering measures lead to slow construction speed and also increase the cost of the entire project. Therefore, attention is beginning to focus on the use of a single shotcrete lining as a permanent lining (Larive et al., 2020; Neuner et al., 2020; Shi et al., 2023). To meet relevant technical requirements and realistic demands, high-performance concrete (HPC) was developed. High-performance concrete has better workability, mechanical properties, and durability than conventional concrete (Biolzi et al., 1997; Song and Hwang, 2004; Lim and Ozbakkaloglu, 2014; Kou and Poon, 2015).
High-performance shotcrete (HPS) refers to the enhancement of the properties of conventional shotcrete, including workability, strength, and durability, in order to confer it with excellent pumpable and sprayable characteristics, high strength, and exceptional durability. Different mineral admixtures like fly ash, silica fume, slag, and various other substances are frequently utilized in the fabrication of high-performance concrete (Cong et al., 1992; Gražulytė et al., 2020). The utilization of these admixtures improves the mechanical properties of concrete by promoting pozzolanic reactivity, reducing permeability, and enhancing durability. The incorporation of fibers in sprayed concrete can effectively enhance its strength and toughness while mitigating the risk of cracking (Juan, 2009; Khooshechin and Tanzadeh, 2018). However, this can also influence the fluidity of the concrete, thereby partially constraining the advancement of fiber-reinforced shotcrete. Reactive powder concrete, an ultra-high-strength concrete, is created by blending active materials like cement and mineral admixtures, in addition to the inclusion of fibers (Richard and Marcel, 1995). Although notable progress has been made in the realm of high-performance shotcrete, the field of sprayed reactive powder concrete is still in its nascent stages. Wang (Zhang et al., 2022), for the first time, amalgamated reactive powder concrete with sprayed concrete to produce ultra-high performance concrete with a strength exceeding 110 MPa.
However, both reactive powder concrete and reactive powder shotcrete contain river sand, manufactured sand, or quartz sand (Helmi et al., 2016; Ji et al., 2021). Sand can play the role of lubrication, skeleton, and filler in concrete. Quartz sand not only causes environmental pollution, but its dust is so fine that it can be suspended in the air. Prolonged inhalation of dust containing quartz sand may lead to silicosis, impacting respiratory function. River sand has long been subjected to water erosion and has a smooth surface. Compared with manufactured sand, it can make concrete more mobile. However, river sand resources are very limited and the mining process can seriously damage the ecological balance of the river, harm the living environment of aquatic organisms, and some regions have banned mining of river sand. Manufactured sand is made by mechanically crushing mountain rock. Compared with river sand, the raw materials for manufactured sand are easy to obtain. However, because it is mechanically crushed, the particles are angular, have rough surfaces, and have poor mobility. Its mining process also directly destroys the structure of the mountain and disrupts the ecological balance. Glass is regarded as a favorable alternative to sand due to its favorable chemical and physical attributes (Du and Tan, 2013). Relevant scholars have successfully produced glass sand from recycled waste glass to partially or completely replace sand in concrete, confirming the feasibility of using glass sand in concrete (Tamanna et al., 2020). Although there are many studies on the use of glass sand to replace manufactured sand in normal concrete and all have achieved positive results, there are fewer studies related to the use of glass sand in RPC and no application in sprayed activated powder concrete has been found so far. Therefore, there is a need to carry out relevant characterization studies on reactive powder shotcrete with glass aggregate.
As the project advances, the performance criteria for concrete tunnel linings are becoming increasingly intricate and diverse. Concrete is mandated to exhibit high fluidity, self-compaction, elevated strength, exceptional durability, enhanced serviceability, and an extended service life. Therefore, there is a need to inspect the concrete in real-time and to check the deformation and damage of the structure during its life cycle. This practice is known as Structural Health Monitoring (SHM). According to the results of related literature (Huang et al., 2007; Chen and Ansari, 2010; Imai and Feng, 2012; Ai et al., 2016), conventional monitoring systems often use supplementary or embedded sensors for the detection of damage and cracks in structural systems. However, the longevity of these supplementary or embedded sensors is notably constrained when measured against the expected service life of the infrastructure. Consequently, frequent replacements are necessitated, resulting in escalated costs. To address these inherent limitations in monitoring systems dependent on such additional or embedded sensors, extensive research has been dedicated to the investigation of smart building materials endowed with innate self-sensing capabilities in recent years (Fu et al., 1998; Chung, 1999; Han et al., 2015; Erdem et al., 2017). These self-sensing smart building materials can detect stress/strain, damage, and crack formation by monitoring changes in electrical resistivity during mechanical loading (Han et al., 2015). It has been shown that carbon fiber-reinforced composite materials (Chen and Chung, 1996; Wen and Chung, 2001; Chung, 2002), cementitious composites containing functional nanofillers (Han et al., 2009; Han et al., 2011; Azhari and Banthia, 2012), and self-sensing fiber-reinforced cementitious composites (Lin et al., 2011; Ranade et al., 2014; Downey et al., 2017) exhibit this self-sensing capability. This provides a basis for realizing self-monitoring of tunnel linings. Sun (Yunlong et al., 2022) used carbon fibers to successfully prepare reactive powder concrete with self-sensing capability, which possessed self-sensing capability while reaching a compressive strength of more than 100 MPa. Although the self-sensing capability of carbon fiber concrete has been quite studied and certain results have been achieved, the self-sensing capability of carbon fiber in sprayed high-performance concrete is still relatively low, hence, there is a compelling need for conducting future research in this area.
This study explores the application of glass sand in high-performance shotcrete. The use of this technology can protect the environment, reduce pollution, and contribute to the sustainable development of high-performance shotcrete. Considering the unclear impact of glass sand on high-performance shotcrete properties, this study investigates how varying glass sand replacement ratios affect the mechanical characteristics of concrete materials in high-performance shotcrete by substituting different quantities of glass sand for manufactured sand. Carbon fibers and different admixtures are also added to provide the self-sensing capability of the tunnel while ensuring toughness and strength. Based on this, mechanical indices such as compressive strength, splitting tensile strength, and flexural strength were used in this study to evaluate the physical properties of the components. The pressure sensitivity was tested by plugging the specimens into a circuit as an evaluation criterion for self-sensing capability. A tunnel model was then simulated using Ansys APDL to verify its feasibility in project conditions.
2 Materials and methods
2.1 Raw materials
In this test, cement with a compressive strength of 52.5 MPa according to the standard (GB 175-2007, 2007) (GB175-2020, 2020) was used to produce all the concrete mixtures. Manufactured sand was screened to ensure a continuous particle size distribution. The gradation curves are shown in Figure 1. Silica fume was tested by Gansu Sanyuan Silica Material Co., fly ash was produced by Hebei Shengyi Mineral Products Trading Co., metakaolin was K-1300W type high activity metakaolin purchased from Inner Mongolia Chao Brand New Material Co. Glass sand aggregate was 100 mesh (0.15 mm), glass sand produced by Ningbo Hongyang Washing Equipment Co. Tables 1, 2 provides an in-depth analysis of the chemical and physical attributes of cement, silica fume, fly ash, manufactured sand, metakaolin, and glass sand. Throughout the experimental phase, carbon fibers, measuring 6 mm in length, boasting an aspect ratio of 1000, and possessing an impressive tensile strength of 3,950 MPa, were systematically incorporated into all mixtures. Furthermore, a polycarboxylate superplasticizer with a solid content of 38% was consistently employed in all concrete compositions. Figure 2 visually portrays the characteristics of glass sand, manufactured sand and carbon fiber.
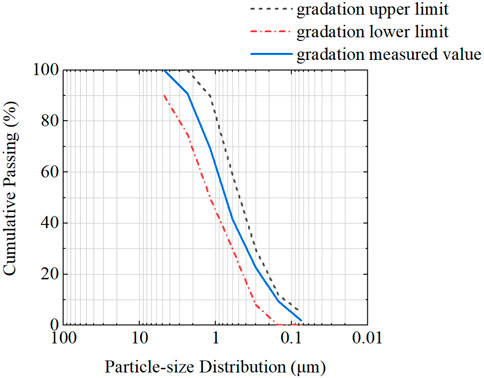
FIGURE 1. Gradation curve of manufactured sand in HPS.
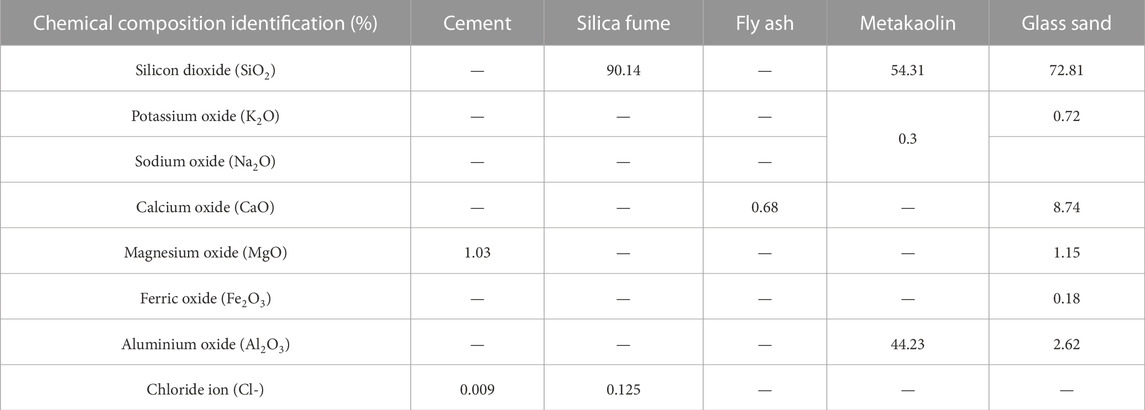
TABLE 1. Chemical composition of raw materials.
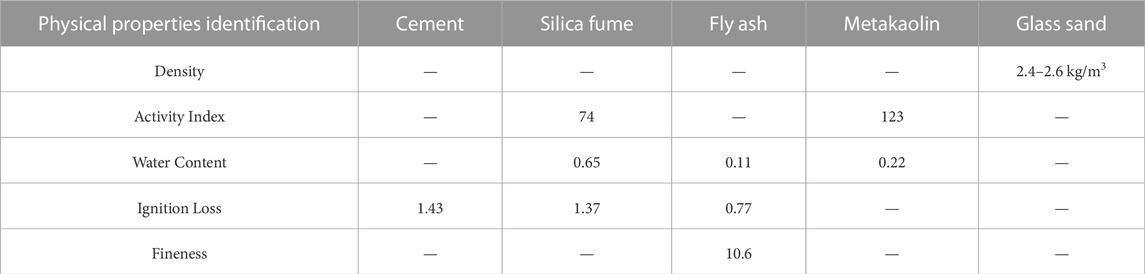
TABLE 2. Physical characteristics of raw materials.
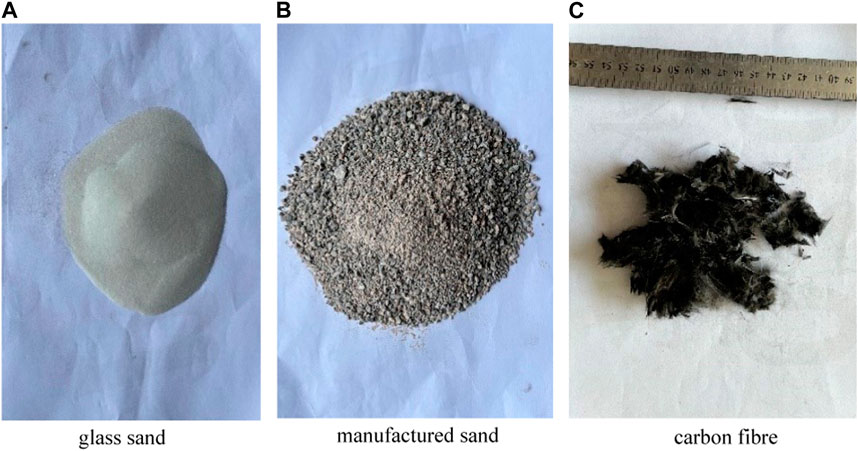
FIGURE 2. Appearance of raw materials. (A) glass sand (B) manufactured sand (C) carbon fibre.
2.2 Proportion of mixes
In this study, cement, silica fume, fly ash, metakaolin, manufactured sand, glass sand, and carbon fiber are used as raw materials to produce high-performance concrete with shotcrete properties. Glass sand (0%, 25%, 50%, 75%, 100%) was used as a replacement for manufactured sand in the shotcrete. Carbon fibers were also added in different proportions (0.5%, 0.7%, and 0.9%) to obtain better mechanical properties and self-sensing performance. The experimental water-cement ratio was 0.2, the sand-to-binder ratio was 0.7, and the polycarboxylate superplasticizer content was 1.8%. There are a total of 15 groups of mix proportions, and the carbon fiber content and glass sand replacement rate are shown in Table 3.
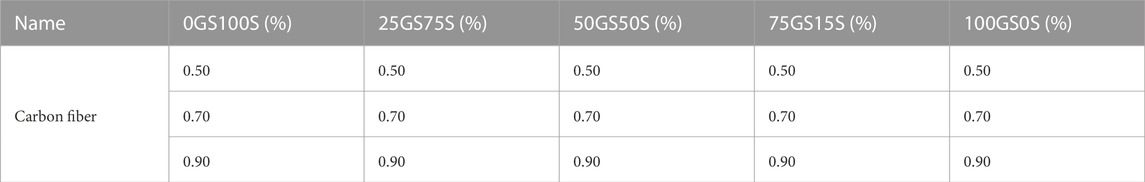
TABLE 3. Concrete mix design (%).
2.3 Specimen preparation
Carbon fibers may clump in concrete as the mixture. To ensure their even distribution in the concrete, it is essential to initially blend cement, silica fume, fly ash, manufactured sand, and glass sand in a concrete mixing pan, and continue mixing for a duration of 2 min. Then, the carbon fibers were sieved using a sieve with an aperture of 10 mm and mixed again for 2 min. Next, superplasticizer and water were added and mixing was continued for 3 min. At the end of the concrete paste mixing, it was quickly poured into the moist-mix concrete spraying machine, and the concrete paste was sprayed onto the plate through the moist-mix concrete spraying machine. After the spraying is stable, the slurry is then sprayed into the mold layer by layer. During the spraying process, the mold is at an angle of 80°with the ground, and sprayed layer by layer from the bottom upward.
After the specimens were sprayed, they were placed in a natural environment and demolded after 1 day of natural curing. After that, they were continued to be cured until they reached the standard age specified by the test. The curing environment temperature was 20°C ± 2°C. During the curing process, water was sprayed twice a day to ensure that the specimens could fully maintain the required moisture content.
2.4 Test procedure
1) Compressive strength test
According to the standard specification (GB/T50081-20192019), this experiment successfully prepared cubic specimens of 100 mm × 100 mm × 100 mm for compressive strength test. Throughout the testing process, a WAW-1000B electro-hydraulic servo universal material testing machine was employed to apply a load at a rate ranging from 0.3 to 1 MPa/s. The loading process is shown in Figure 3. To determine the effect of different curing times on the strength of the specimens, the compressive strengths were tested at ages of 1, 3, 7, 14, 28, and 56 days, respectively. There were three specimens for each age group. The compressive strength was calculated using Eq. 1.
where fcc is the compressive strength of the concrete specimen, MPa; F is the ultimate load of the specimen, N; and A is the compressed area of the concrete specimen, mm2.
2) Splitting tensile strength test
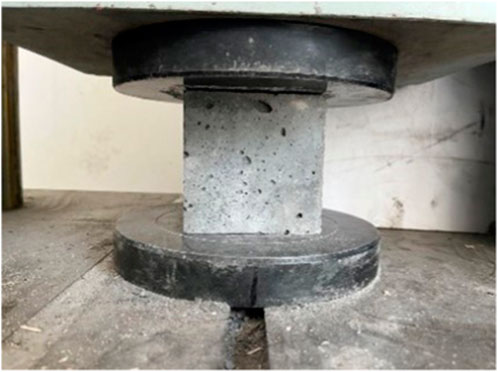
FIGURE 3. Compressive strength test.
The splitting tensile test of concrete is shown in Figure 4. 100 mm × 100 mm × 100 mm cubic specimens were subjected to compression testing until failure using a YAW-1000 microcomputer-controlled fully automatic compression testing machine, following a loading rate of 0.1 MPa/s in compliance with the specified standard (GB/T50081-20192019). Three specimens were taken from each group. Before conducting the tests, wooden blocks were affixed to the midpoint of the opposing sides of both the upper and lower surfaces of the specimen. Subsequently, the specimen was positioned between two semicircular steel plates and properly aligned. The test tensile strength was calculated using Eq. 2.
where fts is the concrete splitting tensile strength, MPa; F is the destructive load of the specimen, N; A is the area of the splitting surface of the specimen, mm2.
3) Flexural strength test
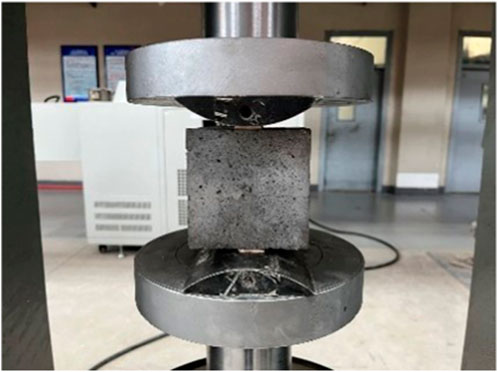
FIGURE 4. Splitting tensile strength test.
The flexural test of concrete is shown in Figure 5. In compliance with the standard (GB/T50081-20192019), rectangular concrete beams measuring 100 mm × 100 mm × 400 mm underwent a four-point bending test under a constant load of 0.08 MPa/s using an MAS-500 hydraulic testing machine until failure. The flexural strength was calculated using Eq. 3 as follows:
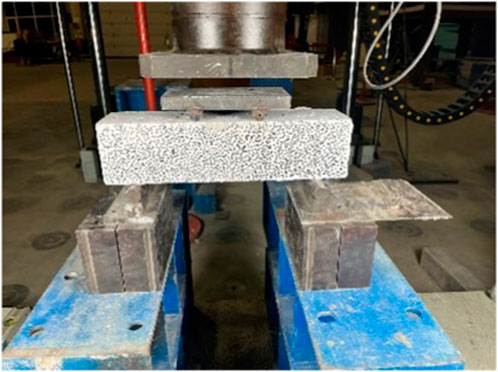
FIGURE 5. Flexural strength test.
Where fts is the flexural strength of concrete, MPa; F is the breaking load of the specimen, N; l is the span between supports, mm; h is the height of the specimen, mm; and b is the width of the specimen, mm.
4) Electrical measurements
The pressure sensitivity of the specimens was tested using the two-electrode method, as shown in Figure 6. Specimens with dimensions of 100 mm × 100 mm × 300 mm and 100 mm × 100 mm × 400 mm were tested using MAS-500 hydraulic presses, respectively, and subjected to a cyclic load of 1 kN/s. To prevent the specimen from tipping over when unloaded, the load was maintained at a minimum of 5 kN and the current at that moment was recorded. It should be noted that before each load test, in order to eliminate the effect of polarization, it is necessary to wait for the current to stabilize, with an equilibrium time of 30 ± 5 min, and record the initial current value. The calculation of the pressure sensitivity of the specimen is shown in Eqs. 4–6.
where R is the resistance, U is the voltage, I is the current, ρ is the resistivity, L is the length of the specimen, S is the cross-sectional area of the specimen, ρi is the resistivity at any instant, ρi-1 is the resistivity at the previous instant, and ρ0 is the resistivity at the initial instant; The fractional change in resistance (FCR) is an acronym for the rate of change of resistivity, which is used to determine the linear and nonlinear behavior of the change of resistivity in the interval. In addition, a larger FCR value indicates a more significant change in resistivity under the same load, indicating better conductivity within the sample, which is used to evaluate the self-sensing performance.
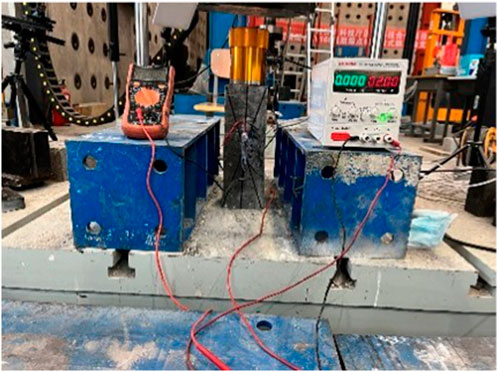
FIGURE 6. Pressure sensitivity test.
3 Results and discussions
3.1 Compressive strength
Figures 7A–F shows the compressive strength of high-performance shotcrete containing glass sand at different ages (1, 3, 7, 14, 28, 56 days) under natural curing conditions. Analyzing the figure data reveals a consistent increase in compressive strength over an extended curing period, regardless of fluctuations in glass sand content. When the carbon fiber content is 0.5% and the glass sand replacement rate is 0%, the compressive strengths of 1, 3, 7, 14, 28, and 56 days are 43.36, 52.4, 60.58, 65.24, 68.89, and 70.751 MPa, respectively. Although the compressive strength increases with the increase of the curing age, the growth rate decreases over time. The growth rate of each group of specimens is calculated as the percentage of strength increase compared with the previous age. The growth rates are 20.85%, 15.61%, 7.69%, 5.59%, and 2.7%, respectively. The possible reason for this phenomenon can be attributed to the rapid progress of concrete hydration reactions during the initial stages. This phase generates numerous products, such as calcium silicate hydrate (C-S-H), contributing to the early strength development of the cement. However, as the hydration reactions progress and consume a significant portion of calcium silicate, the subsequent stages exhibit less pronounced strength gains (Zheng, 2011). It is evident that the compressive strength of concrete specimens incorporating glass sand demonstrates an initial upward trend followed by a subsequent decline as the glass sand content increases. When the carbon fiber content is 0.9%, with the increase of glass sand replacement rate, the compressive strength at 28 days increases from 69.67 to 80.06 MPa, and then decreases to 70.54 MPa. The possible reason for this situation is that glass sand has a very small particle size, and adding glass sand to manufactured sand can improve the gradation of aggregate, fill the voids inside the concrete, and make the compressive strength show an upward trend. But when the glass sand replacement rate reaches 100%, there is no manufactured sand inside the specimen, destroying the original gradation, and reducing the strength. The optimum content was 75% of glass sand, which was consistent with the conclusion of Yubo Jiao who used glass sand to replace quartz sand in UHPC (Jiao et al., 2020).
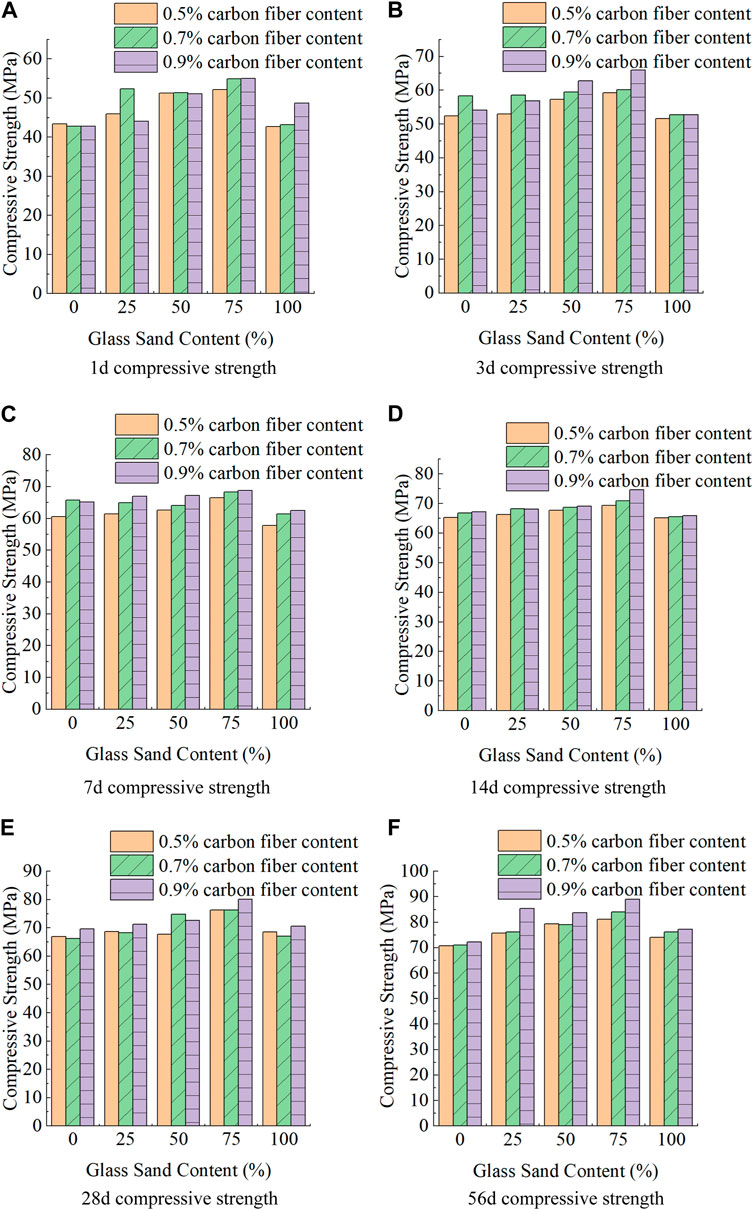
FIGURE 7. Compressive strength of concrete at different ages. (A) 1 days compressive strength (B) 3 days compressive strength (C) 7 days compressive strength (D) 14 days compressive strength (E) 28 days compressive strength (F) 56 days compressive strength.
As the carbon fiber doping proportion rises, there is a general upward trend in compressive strength. Nevertheless, it is worth noting that the overall impact of carbon fiber doping on compressive strength does not appear to be particularly substantial. It is worth mentioning that with the change in glass sand content, the change in carbon fiber content has a different impact on compressive strength. Figure 7 illustrates a noticeable trend: when the glass sand content is low, there is an initial tendency for the compressive strength to decrease as the carbon fiber content increases. However, with an increase in glass sand dosage, this tendency gradually diminishes, resulting in higher fiber content and, consequently, greater compressive strength. The reason for this phenomenon may be due to the particle size of 0.15 mm glass beads. This size of glass beads is conducive to the dispersion of fibers in concrete, which can create some gaps between the fibers to reduce their entanglement and aggregation, and promote their free flow and random orientation in the base material.
3.2 Splitting tensile strength
Figure 8 displays the splitting tensile strength of concrete specimens with different levels of glass sand content. It can be seen from the figure that the splitting tensile strength of concrete specimens decreases with the increase of glass sand content. The specimens containing 0.9% carbon fiber showed that the splitting tensile strength of each group decreased by 13.64%, 5.3%, 12.76%, and 5.46%, respectively, as the glass sand content increased, compared with the previous group of glass sand content. This may be due to the particle size of the selected glass sand being too small and the surface being smooth. From the microscopic level, their shape is spherical, without edges and corners. As the glass sand content increases, the friction force between the original manufactured sand gradually decreases, which affects the splitting tensile performance of the specimens. The test results unequivocally demonstrate that the incorporation of carbon fiber leads to a marked improvement in the concrete’s splitting tensile performance. The cohesion between carbon fiber and concrete can resist the tensile stress inside the concrete. At the same time, the fibers bridge each other, which is conducive to the transmission of internal force in concrete, and also can prevent the generation and development of cracks. During a splitting test, stress will be transmitted through the interface between fiber and matrix until the fiber reaches its maximum tensile strength and breaks. This is in line with the test results of Sahar Y. Ghanem (Ghanem and Bowling, 2019).
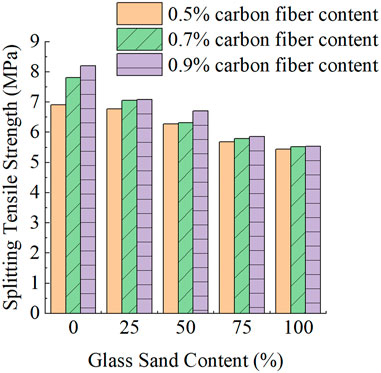
FIGURE.8. 28 days split tensile strength of concrete.
3.3 Flexural strength
Figure 9 displays the flexural strength exhibited by the concrete specimens. It is evident that both the flexural strength and splitting tensile strength of the specimens display a corresponding pattern, characterized by a decline in flexural strength as the content of glass sand increases. The figure also shows that for each group of concrete specimens with 0.9% carbon fiber content, their flexural strength decreased by 7.5%, 0.79%, 15.42%, and 17.87% respectively compared to the previous group with lower glass sand content. The other groups with different carbon fiber content exhibited similar patterns. The reason for this phenomenon might be the same as the reason for the reduction in splitting tensile strength. The glass sand particles used had fine and smooth surfaces, and their microscopic shape resembled microspheres without any sharp edges or corners. When the amount of glass sand increased, the friction force between the manufactured sand aggregates gradually weakened, resulting in a negative impact on the tensile performance of the specimens. Likewise, with an increase in carbon fiber content, the flexural strength and the splitting tensile strength showed similar patterns, which were an increase in both strengths with an increase in carbon fiber content. The reason for this situation is that the bond force between carbon fiber and concrete can resist the tensile stress within the concrete, and the fibers are interconnected, which facilitates the transfer of internal force in the concrete and can also effectively prevent the generation and spread of cracks. When the concrete underwent a tensile test, the pressure was transferred through the pressure was transferred by the interaction at the fiber-matrix interface and continued until the fiber reached its ultimate tensile strength and eventually fractured. E. Mello (Mello et al., 2014) also reached similar conclusions.
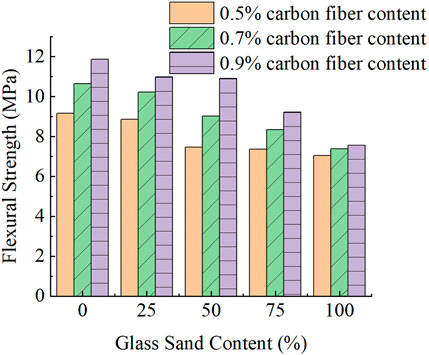
FIGURE 9. 28 days flexural strength of concrete.
3.4 Electrical resistivity
3.4.1 Electrical resistance before loading
The initial resistivity of the 100 mm × 100 mm × 300 mm and 100 mm × 100 mm × 400 mm specimens was tested, as depicted in Figures 10A, B. The figure clearly shows that when the carbon fiber content is 0.9%, as the glass sand content increases, the resistivity of each group of specimens increases by 1.03%, 1.64%, 1.82%, and 2.44%, respectively, compared to the specimens without glass sand. The reason for this situation might be that glass sand is a non-conductive material with very high resistivity, much higher than cement, water, and manufactured sand. Therefore, there is a trend of increasing resistivity with an increase in content. Also, the sand-to-binder ratio in this experiment is relatively large, so the change in glass sand content has a more pronounced impact on the resistivity.
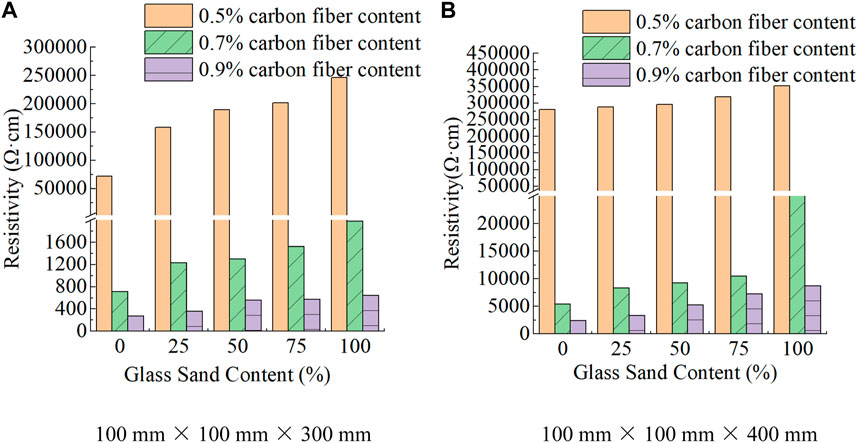
FIGURE 10. Initial resistivity of specimen of different sizes. (A) 100 mm × 100 mm × 300 mm (B) 100 mm × 100 mm × 400 mm.
However, as the carbon fiber content increases, the conductivity of concrete increases significantly. The proportion of carbon fiber increased from 0.5% to 0.7% and then to 0.9%, and its resistivity decreased from 71,505.38 to 715 Ω cm and then to 275.7 Ω cm, showing a clear decreasing trend. It is worth mentioning that when the carbon fiber content increased from 0.5% to 0.7%, the resistivity decreased significantly; while from 0.7% to 0.9%, although there was also a decreasing trend, its decrease in resistivity was far less than the previous stage. The reason for this situation might be that with an increase in carbon fiber, the conductivity of carbon fiber cement-based materials gradually increases, and the number of fibers overlapping each other also gradually increases. When a certain fiber content (percolation threshold) is reached, the conductivity of the material no longer increases significantly. This is because, at this point, the fibers form a completely overlapping network structure, which makes the conductivity reach a relatively stable state (Chiarello and Zinno, 2005).
By comparing the results, it can be seen that as the specimen size changes, the resistivity of specimens containing 0.5% carbon fiber content increases from initial values of 71,505.38, 15,833.33, 189,046.7, 201,515.22, and 246,296.3 Ω cm to 280,590.7, 287,878.96, 295,567.6, 318,887.7, and 351,851.9 Ω cm respectively. A possible reason for this phenomenon is that concrete is a porous medium with pores and cracks of different scales inside. As the size of the concrete specimen increases, its internal pores and cracks also increase, thus affecting its conductivity performance. Generally speaking, the more pores and cracks there are, the worse the conductivity performance of concrete and the higher its resistivity. This is consistent with Heydar Dehghanpour’s conclusion (Dehghanpour and Yilmaz, 2020).
3.4.2 Fractional variation of real impedance under compression loads
The results of the sample’s pressure sensitivity are displayed in Figures 11, 12. As displayed in the figure, as the load changes, the FCR also changes accordingly, showing a good correspondence and pressure sensitivity. That is, when the load increases and then decreases, the FCR has an opposite trend. When an external force is applied to the composite, it induces changes in the spacing among the conductive filler particles, resulting in a change in electrical resistance. In this study, the initial spacing of the carbon fibers under compressive loading decreases or becomes zero due to forceful deformation; therefore, the resistance decreases. A similar phenomenon was observed by (Dadkhah and Tulliani, 2022). By comparing the FCR at different glass sand contents, it is clear that the trend of decreasing FCR becomes moderate with increasing glass sand contents. This is because glass sand has a high resistivity and can hinder the conduction of current in the specimen, thus reducing the change in concrete resistivity. In addition, the glass sand selected in this study has a smaller grain size, which improves concrete compactness, so that concrete specimens are less deformed by force, thus reducing the FCR.
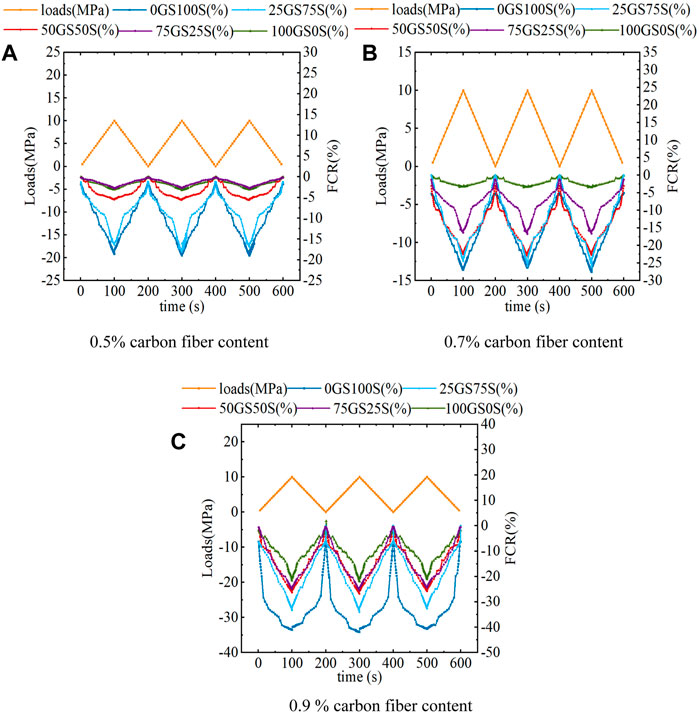
FIGURE 11. Resistivity Change of 100 mm × 100 mm × 300 mm Specimen under Cyclic Load (A) 0.5% carbon fiber content (B) 0.7% carbon fiber content. (C) 0.9 % carbon fiber content.
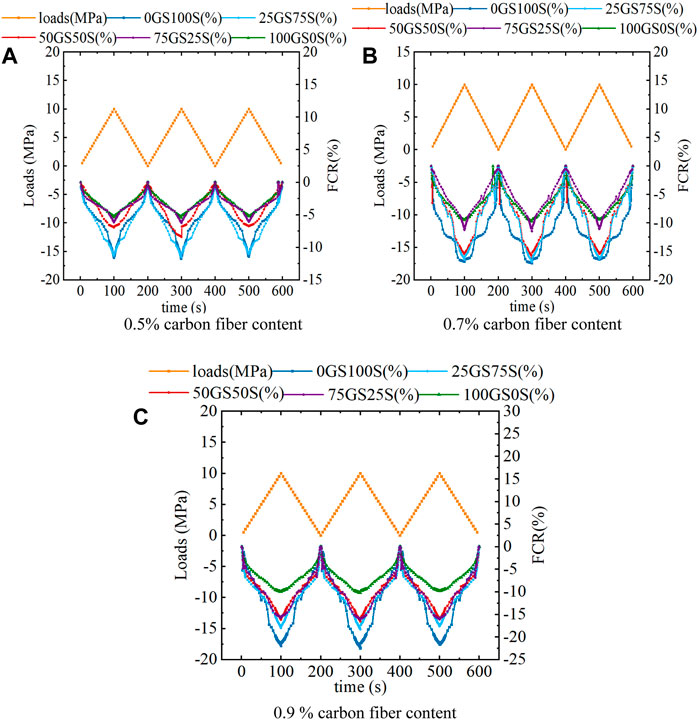
FIGURE 12. Resistivity change of 100 mm × 100 mm × 400 mm specimen under cyclic load. (A) 0.5% carbon fiber content (B) 0.7% carbon fiber content (C) 0.9 % carbon fiber content.
The FCR curves of the 100 mm × 100 mm × 300 mm (Figure 12) and 100 mm × 100 mm × 400 mm (Figure 13) specimens show a similar pattern. However, due to the size effect, the network of conductive materials is well connected and there are fewer tiny cracks and other disturbances in the conduction path when the specimen length is short, allowing the specimen to show the effect of the change more completely. However, as the sample size and the applied forces increase, damage occurs first in longer samples, resulting in an increase in insulating walls in the current path. This further increases the difficulty for electrons to traverse the insulating walls, reducing the signal efficiency and decreasing the rate of change magnitude. Therefore, to effectively and accurately ensure the self-monitoring function of the structure, a deeper study of the sample size should be carried out to further explore the self-sensing performance of large-size components. This indicates a direction for further research.
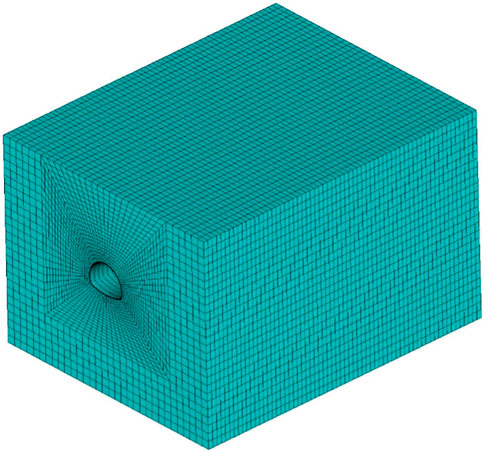
FIGURE 13. Finite element model of overall structure.
4 Finite element modeling of tunnel
Since there are not many examples of using shotcrete as permanent lining, Ansys APDL was used to simulate and verify the feasibility of HPS single-layer tunnel lining with glass sand (GHPSS). The research results will provide valuable references for future research on sprayed HPC single-layer tunnel lining.
4.1 Module selection and modeling
In this simulation, the rock unit surrounding the tunnel is modeled by the solid45 element, while the concrete is modeled by the solid65 element.
The specimen with 0.9% carbon fiber doping and 75% glass sand substitution rate was selected as the simulation object, and its relevant material parameters, such as compressive strength and splitting tensile strength, were adopted from the above experimental results. However, the simulation of the specimen’s behavior uses the design value of the specimen’s compressive strength and splitting tensile strength. According to the formula provided by GB50010-2010 (GB50010-2010, 2015), the compressive strength and splitting tensile strength are converted to their design values, which are calculated as shown in Eqs 7–12. The design value of the specimen’s compressive strength is calculated as 34.107 MPa, and the design value of splitting tensile strength is 3.76 MPa. The specimen’s density is calculated as 2,200.3 kg/m3, its Poisson’s ratio is 0.21, and the perimeter rock adopts the perimeter rock quality of V, with a density of 2,000 kg/m3, Young’s modulus of 1.2GPa, Poisson’s ratio of 0.4, an angle of internal friction of 23.7°, and cohesion of 0.17°. The Drucker-Prager yield criterion was chosen for the perimeter rock, which is an approximation of the Mohr-Coulomb criterion and a modification of the von Mises yield criterion and is consistent with geotechnical materials simulations.
fcu,100—— cube compressive strength of HPS with an edge length of 100 mm, MPa;
fcu,150—— cube compressive strength of HPS with an edge length of 150 mm, MPa;
fts,100—— cube split tensile strength of HPS with an edge length of 100 mm, MPa;
fts,150—— cube split tensile strength of HPS with an edge length of 150 mm, MPa;
fck—— the standard value of HPS compressive strength, MPa;
fcd—— the design value of HPS compressive strength, MPa;
ftk—— the standard value of HPS tensile strength, MPa;
ftd—— the design value of HPS tensile strength, MPa;
αc1—— the ratio of compressive strength between HPS prism and cube, αc1 = 0.82.
αc2—— HPC brittleness reduction coefficient, αc2 = 0.87;
k——concrete partial coefficient, k = 1.4.
It should be noted that in this simulation, the surrounding rock and the lining concrete are both assumed to be isotropic homogeneous materials, and no relative slip occurs between them by default. The lining structure is considered as an integral whole with the surrounding rock, subject to the same stresses and deformations by external forces. In other words, the lining structure bonds well with the surrounding rock and deforms uniformly under external forces.
Based on computing time and result accuracy, the length of the tunnel is selected to be 100 m. In the simulation process, the lateral dimensions of the surrounding rock are 2.5 times the width of the tunnel, and the lower surrounding rock is three times the height of the tunnel. In summary, the dimensions of the surrounding rock in this simulation are 80 m × 65 m × 100 m. The shotcrete is modeled by a nonlinear constitutive model of concrete: The Multilinear Isotropic Hardening Model (MISO), which obeys the Von Mises yield criterion. The obtained model is shown in Figures 13, 14.
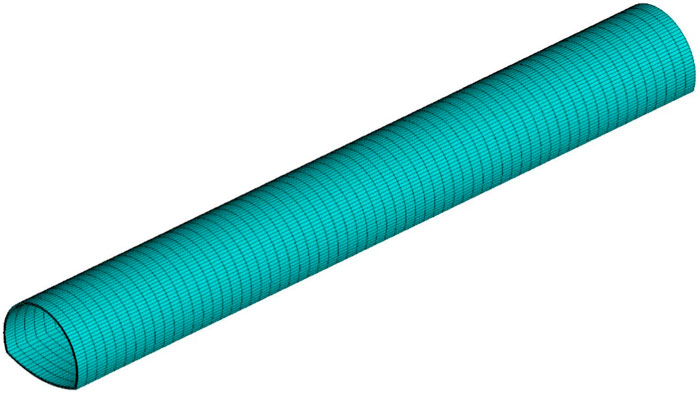
FIGURE 14. Finite element model of single lining.
4.2 Establishment of boundary conditions and simulation calculation of models
During the construction and operation of the tunnel, different constraints are applied to different boundaries to limit the deformation of the mountain. The horizontal displacement at the mountain’s left and right boundaries is small due to the distance from the tunnel, so only a modest amount of settling will occur. To limit the horizontal deformation, these boundaries must be subjected to horizontal constraints. The lower boundary of the mountain is connected to the ground and will not produce any vertical displacement, so vertical constraints must be applied to this boundary. As for the upper boundary of the mountain, it is a free surface and no constraints are applied. The length of the tunnel will also be affected by the deformation of the mountain. If the deformation is large, it will directly affect the operation of the tunnel; therefore, horizontal constraints are set at the front and rear boundaries of the tunnel to limit the deformation.
After the tunnel is put into operation, the lining structure must withstand the pressure from the vehicles in addition to the pressure of the mountain and its own gravity. However, the external force exerted by vehicles is negligible compared to the mountain and its own gravity. Hence, only the gravitational force of the mountain needs to be considered when simulating the tunnel. However, since the surrounding rock is a compressed and non-tensile material, the direction of gravity acceleration is usually assumed to be vertically upward to prevent the surrounding rock from undergoing tension. Based on the comprehensive analysis, this study imposed constraint conditions in the y-direction at the lower boundary of the model, x-direction constraints at the left and right boundaries, and z-direction constraints at the front and back boundaries. Additionally, the coordinate system used in this simulation follows the standard ANSYS Cartesian coordinate system. A vertical upward gravitational acceleration was applied throughout the entire model to prevent tensile occurrences in the surrounding rock The results of the constraint and loading are shown in Figure 15. (Constraints and loads are shown separately for different directions to provide a clearer view.)
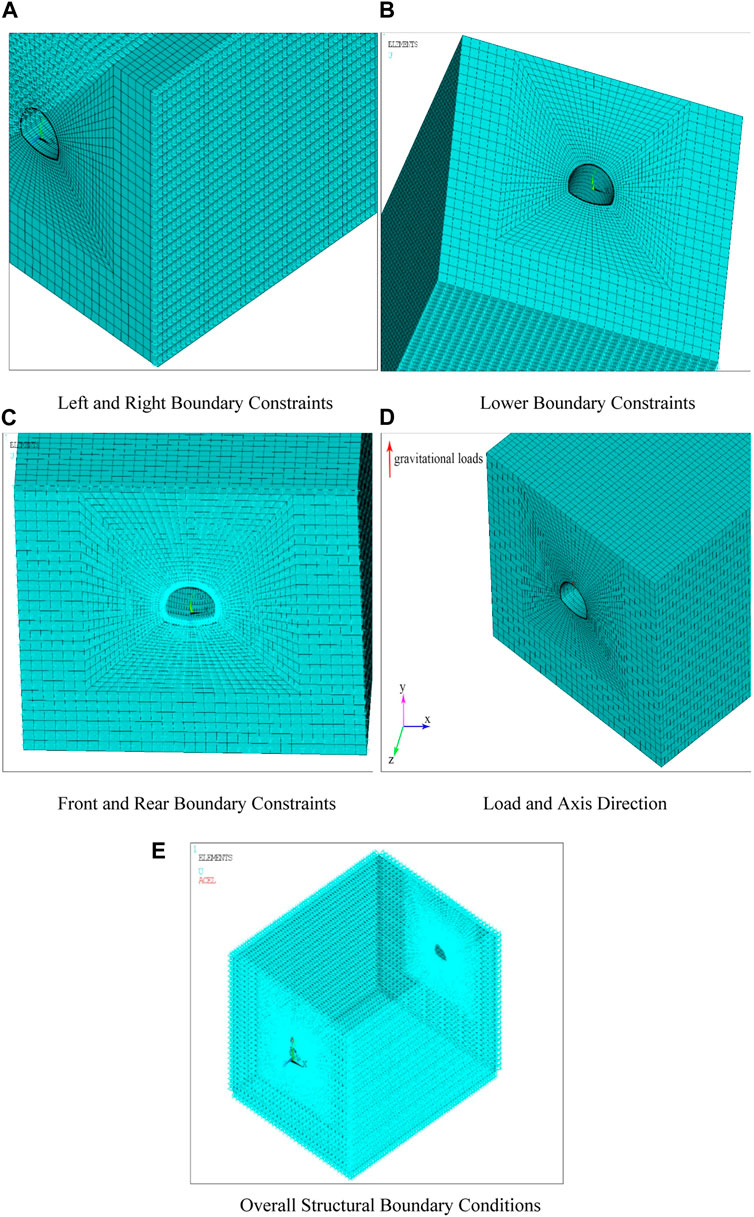
FIGURE 15. Boundary conditions. (A) Left and Right Boundary Constraints (B) Lower Boundary Constraints (C) Front and Rear Boundary Constraints (D) Load and Axis Direction (E) Overall Structural Boundary Conditions.
It can be concluded from the above constraints that the lining structure will only experience vertical displacement under the self-weight of the mountain, and will bear significant stress in the vertical direction. Therefore, this article will focus on analyzing the vertical deformation and stress of the lining structure. Figures 16A, B show the strain and stress diagrams.
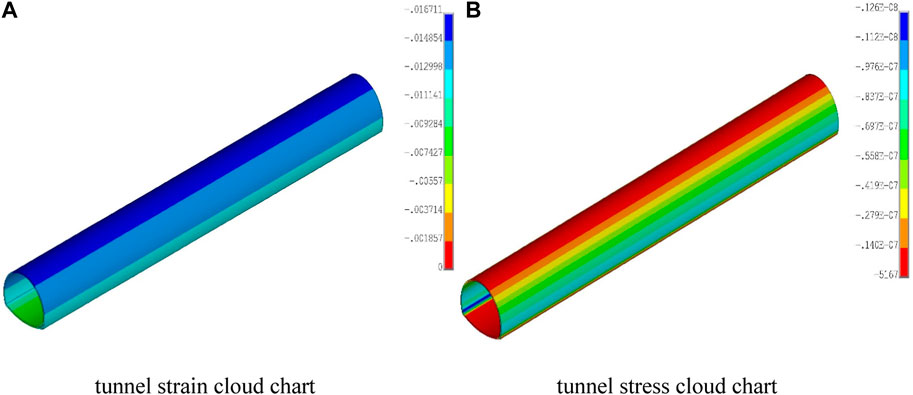
FIGURE 16. Tunnel strain (A) and stress (B) clouds chart. (A) tunnel strain cloud chart (B) tunnel stress cloud chart.
It can be noticed from Figure 16 that the vertical displacement at the tunnel vault is the largest of the entire structure, followed by the side walls, and the vertical displacement at the inverted arch is the smallest. It is worth noting that the vertical displacement of the tunnel vault is approximately 16.7 mm. The stress cloud diagram shows that all parts of the lining are under compression, which is the result of the combined effects of the surrounding rock pressure, the lateral soil pressure, and the gravity of the lining structure itself. In the entire lining structure, the vertical stress at the inside of the arch foot is the highest in the lining structure, reaching 12.6 Mpa. The reason for the maximum stress at the arch foot may be partly determined by the stress and displacement characteristics of the surrounding rock. After tunnel excavation, the surrounding rock will undergo elastic and plastic deformation, resulting in stress redistribution. Therefore, the surrounding rock at the arch foot is affected by both the weight of the tunnel and the gravity of the strata and is constrained by that at the crown of the arch, making it unable to sink freely. On the other hand, it is due to the fact that the location is at the junction of the lateral and inverted arches during modeling, and the curvature of the curve changes too much, resulting in stress concentration at this location.
By comparing the data, it is clear that the stresses in the Ansys APDL simulation are much smaller than the design strength of the specimens in the experiment. This offers theoretical guidance for high-performance shotcrete containing glass sand and a possibility for its application in engineering. Additionally, the use of glass sand has a lower environmental impact than the use of materials such as manufactured sand or quartz sand.
5 Conclusion
In this paper, the glass sand was used to replace manufactured sand at dif-ferent proportions of 0%, 25%, 50%, 75%, and 100%, and carbon fiber reinforced high-performance shotcrete was prepared and its praying performance was verified by an experiment. The basic mechanical properties and self-sensing abilities of the con-crete were also investigated. Then, the experimental parameters were used to perform a simulation analysis, and the following results can be concluded:
• In high-performance shotcrete, the compressive strength tended to first increase and then decrease with increasing glass sand content. The optimum content was 75% of glass sand. Carbon fiber had a positive effect on the compressive perfor-mance of concrete, but the overall strength improvement was relatively limited. Therefore, the optimum group was when the glass sand content was 75% and the carbon fiber content was 0.9%, and its 28 days compressive strength was 80.06 MPa. A notable point was that the compressive strength fell at one point as the carbon fi-ber content increased, which could be caused by agglomeration of the carbon fiber. However, this phenomenon disappeared with the increase of glass sand content, which also confirmed that glass sand was beneficial for fiber dispersion.
• The splitting tensile strength and the compressive strength show opposite trends. As the glass sand content increases, the splitting tensile strength decreases linearly. This is because the glass sand particles are small and smooth, with a microstruc-ture similar to microspheres, without obvious edges and corners. Increasing the amount of glass sand gradually reduces the friction between the mechanism sand aggregates, thus affecting the tensile performance of the specimens to some extent. Similarly, carbon fibers play a very important role in resisting the splitting tensile test. With increasing carbon fiber content, the splitting tensile strength tends to in-crease. The optimum group is the specimen with the lowest glass sand content but the highest carbon fiber content, that is, when the glass sand content is 0% and the carbon fiber content is 0.9%, its strength is 6.975 MPa.
• The flexural strength and the splitting tensile strength show similar patterns. As the glass sand content rises, the flexural strength tends to decrease, while as the carbon fiber content rises, the flexural strength tends to increase. This pattern may be due to both reflecting the tensile performance and crack resistance of concrete. Whereas both the splitting tensile strength test and the flexural strength test cause the expansion and failure of concrete cracks by applying different types of tensile forces.
• By studying the self-sensing performance of the specimens, it was found that the concrete specimens had good pressure sensitivity. The pressure sensitivity de-creased significantly as the glass sand content increased, and the resistivity also increased significantly. The explanation might be that the glass sand has a high re-sistivity, which impedes the current and causes the change in concrete resistivity to decrease. As the carbon fiber content gradually rose, its self-sensing ability im-proved significantly. As the carbon fiber content increased from 0.5%, 0.7%–0.9%, the resistivity of the specimens without glass sand was 71,505.38, 715, and 275 Ω cm, respectively. It is evident that a significant decrease in resistivity occurs as the fiber content varies from 0.5% to 0.7%. Hence, it can be deduced that there potentially exists a percolation threshold within the range of 0.5%–0.7%. It was also found that due to the size effect, the pressure sensitivity changed as the specimen size changed. Therefore, further research is needed with a focus on larger components.
• When using the optimal group of compressive strength, the vertical displacement of the arch crown is the largest, the vertical displacement of the side wall is the second, and the vertical displacement of the inverted arch is the smallest, with a maximum of 16.7 mm, when modeling and simulating with Ansys APDL. In terms of stress, all parts of the lining are subjected to pressure, and the vertical stress at the inner side of the arch foot is the most significant, reaching 12.6 MPa. This has practical significance for engineering projects.
Data availability statement
The raw data supporting the conclusion of this article will be made available by the authors, without undue reservation.
Author contributions
JW: Conceptualization, Formal Analysis, Investigation, Project administration, Writing–review and editing. Tianren Wang: Conceptualization, Formal Analysis, Methodology, Writing–original draft. YZ: Investigation, Methodology, Writing–review and editing. XQ: Writing–review and editing.
Funding
The author(s) declare financial support was received for the research, authorship, and/or publication of this article. This research was funded by the Science Technology Department Program of Jilin Province (grant numbers, 20220203056SF).
Acknowledgments
The authors express their gratitude to the reviewers for their valuable feedback and suggestions aimed at enhancing the paper’s quality.
Conflict of interest
The authors declare that the research was conducted in the absence of any commercial or financial relationships that could be construed as a potential conflict of interest.
Publisher’s note
All claims expressed in this article are solely those of the authors and do not necessarily represent those of their affiliated organizations, or those of the publisher, the editors and the reviewers. Any product that may be evaluated in this article, or claim that may be made by its manufacturer, is not guaranteed or endorsed by the publisher.
References
Ai, D., Zhu, H., and Luo, H. (2016). Sensitivity of embedded active PZT sensor for concrete structural impact damage detection. Constr. Build. Mater. 111, 348–357. doi:10.1016/j.conbuildmat.2016.02.094
Azhari, F., and Banthia, N. (2012). Cement-based sensors with carbon fibers and carbon nanotubes for piezoresistive sensing. Cem. Concr. Compos. 34, 866–873. doi:10.1016/j.cemconcomp.2012.04.007
Biolzi, L., Guerrini, G. L., and Rosati, G. (1997). Overall structural behavior of high strength concrete specimens. Constr. Build. Mater. 11, 57–63. doi:10.1016/S0950-0618(96)00026-8
Chen, P. W., and Chung, D. D. L. (1996). Concrete as a new strain/stress sensor. Compos. Part B Eng. 27, 11–23. doi:10.1016/1359-8368(95)00002-X
Chen, Z., and Ansari, F. (2010). Fiber optic acoustic emission distributed crack sensor for large structures. J. Struct. Control 7, 119–129. doi:10.1002/stc.4300070108
Chiarello, M., and Zinno, R. (2005). Electrical conductivity of self-monitoring CFRC. Cem. Concr. Compos. 27, 463–469. doi:10.1016/j.cemconcomp.2004.09.001
Chung, D. D. L. (2002). Piezoresistive cement-based materials for strain sensing. J. Intelligent Material Syst. Struct. 13, 599–609. doi:10.1106/104538902031861
Chung, Z. Q. S. D. L., and Chung, D. (1999). Carbon fiber-reinforced concrete for traffic monitoring and weighing in motion. Cem. Concr. Res. 29 (3), 435–439. doi:10.1016/S0008-8846(98)00204-X
Cong, X., Darwin, D., and Mccabe, S. L. (1992). Role of silica fume in compressive strength of cement paste, mortar, and concrete. Lawrence, KS: University of Kansas Center for Research, Inc. doi:10.1007/BF02472261
Dadkhah, M., and Tulliani, J. M. (2022). Damage management of concrete structures with engineered cementitious materials and natural fibers: a review of potential uses. Sustainability 14, 3917. doi:10.3390/su14073917
Dehghanpour, H., and Yilmaz, K. (2020). Investigation of specimen size, geometry and temperature effects on resistivity of electrically conductive concretes. Constr. Build. Mater. 250, 118864. doi:10.1016/j.conbuildmat.2020.118864
Downey, A., D'alessandro, A., Ubertini, F., and Laflamme, S. (2017). Automated crack detection in conductive smart-concrete structures using a resistor mesh model. Meas. Sci. Technol. 29, 035107. doi:10.1088/1361-6501/aa9fb8
Du, H., and Tan, K. H. (2013). Use of waste glass as sand in mortar: Part II – alkali–silica reaction and mitigation methods. Cem. Concr. Compos. 35, 118–126. doi:10.1016/j.cemconcomp.2012.08.029
Erdem, S., Hanbay, S., and Blankson, M. A. (2017). Self-sensing damage assessment and image-based surface crack quantification of carbon nanofibre reinforced concrete. Constr. Build. Mater. 134, 520–529. doi:10.1016/j.conbuildmat.2016.12.197
Fu, X., Lu, W., and Chung, D. D. L. (1998). Improving the strain-sensing ability of carbon fiber-reinforced cement by ozone treatment of the fibers 11Communicated by D.M. Roy. Cem. Concr. Res. 28, 183–187. doi:10.1016/s0008-8846(97)00265-2
Gb/T50081-2019 (2019). Standard for test methods of concrete physical and mechanical properties Beijing. China: Beijing, China: Springer.
Ghanem, S. Y., and Bowling, J. (2019). Mechanical properties of carbon fiber reinforced concrete. Adv. Civ. Eng. Mater. 8, 20180089. doi:10.1520/ACEM20180089
Gražulytė, J., Vaitkus, A., Šernas, O., and Čygas, D. (2020). “Effect of silica fume on high-strength concrete performance,” in Proceedings of the 5th World Congress on Civil, Structural, and Environmental Engineering, Orléans, ON, Canada, October 2020.
Han, B., Ding, S., and Yu, X. (2015). Intrinsic self-sensing concrete and structures: a review. Measurement 59, 110–128. doi:10.1016/j.measurement.2014.09.048
Han, B., Yu, X., and Kwon, E. (2009). A self-sensing carbon nanotube/cement composite for traffic monitoring. Nanotechnology 20, 445501. doi:10.1088/0957-4484/20/44/445501
Han, B., Zhang, K., Yu, X., Kwon, E., and Ou, J. (2011). Nickel particle-based self-sensing pavement for vehicle detection. Measurement 44, 1645–1650. doi:10.1016/j.measurement.2011.06.014
Helmi, M. R., Stevens, L. A., and Rigby, S. P. (2016). Effects of high-pressure/temperature curing on reactive powder concrete microstructure formation. Constr. Build. Mater. 105, 554–562. doi:10.1016/j.conbuildmat.2015.12.147
Huang, S. C., Lin, W. W., Tsai, M. T., and Chen, M. H. (2007). Fiber optic in-line distributed sensor for detection and localization of the pipeline leaks. Sensors Actuators A Phys. 135, 570–579. doi:10.1016/j.sna.2006.10.010
Imai, M., and Feng, M. (2012). Sensing optical fiber installation study for crack identification using a stimulated Brillouin-based strain sensor. Struct. Health Monit. 11, 501–509. doi:10.1177/1475921712442440
Ji, J., Kang, W., Jiang, L., Li, Y., Ren, H., Hao, S., et al. (2021). Mechanical behavior of reactive powder concrete made from local material subjected to axial pressure. Front. Mater. 8, 737646. doi:10.3389/fmats.2021.737646
Jiao, Y., Zhang, Y., Guo, M., Zhang, L., and Liu, S. (2020). Mechanical and fracture properties of ultra-high performance concrete (UHPC) containing waste glass sand as partial replacement material. J. Clean. Prod. 277, 123501. doi:10.1016/j.jclepro.2020.123501
Khooshechin, M., and Tanzadeh, J. (2018). Experimental and mechanical performance of shotcrete made with nanomaterials and fiber reinforcement. Constr. Build. Mater. 165, 199–205. doi:10.1016/j.conbuildmat.2017.12.199
Kou, S.-C., and Poon, C.-S. (2015). Effect of the quality of parent concrete on the properties of high performance recycled aggregate concrete. Constr. Build. Mater. 77, 501–508. doi:10.1016/j.conbuildmat.2014.12.035
Larive, C., Bouteille, S., Berthoz, N., and Zappelli, S. (2020). Fiber-reinforced sprayed concrete as a permanent tunnel lining. Struct. Eng. Int. 30, 498–505. doi:10.1080/10168664.2020.1735981
Lim, J. C., and Ozbakkaloglu, T. (2014). Influence of silica fume on stress–strain behavior of FRP-confined HSC. Constr. Build. Mater. 63, 11–24. doi:10.1016/j.conbuildmat.2014.03.044
Lin, V. W. J., Mo, L., Lynch, J. P., et al. (2011). “Mechanical and electrical characterization of self-sensing carbon black ECC,” in International Society for Optics and Photonics), Australia, December, 2011.
Mello, E., Ribellato, C., and Mohamedelhassan, E. (2014). Improving concrete properties with fibers addition. Int. J. Civ. Environ. Eng. 8, 249–254. doi:10.5281/ZENODO.1091168
Neuner, M., Dummer, A., Schreter, M., Hofstetter, G., Cordes, T., and Bergmeister, K. (2020). Nonlinear time-dependent analysis of the load-bearing capacity of a single permanent shotcrete lining at the brenner base tunnel. Struct. Eng. Int. 30, 475–483. doi:10.1080/10168664.2020.1735979
Ranade, R., Zhang, J., Lynch, J. P., and Li, V. C. (2014). Influence of micro-cracking on the composite resistivity of engineered cementitious composites. Cem. Concr. Res. 58, 1–12. doi:10.1016/J.CEMCONRES.2014.01.002
Richard, P., and Marcel, C. (1995). Composition of reactive powder concretes. Cem. Concr. Res. 25 (7), 1501–1511. doi:10.1016/0008-8846(95)00144-2
Shi, D., Chen, X., Ning, Y., Bai, L., and Yu, X. (2023). Understanding the compression failure mechanism of rock–shotcrete composites using X-CT and DIC technologies. Acta Geotech. 1, 5213–5230. doi:10.1007/s11440-023-01884-7
Song, P. S., and Hwang, S. (2004). Mechanical properties of high-strength steel fiber-reinforced concrete. Constr. Build. Mater. 18, 669–673. doi:10.1016/j.conbuildmat.2004.04.027
Tamanna, N., Tuladhar, R., and Sivakugan, N. (2020). Performance of recycled waste glass sand as partial replacement of sand in concrete. Constr. Build. Mater. 239, 117804. doi:10.1016/j.conbuildmat.2019.117804
Wen, S., and Chung, D. D. L. (2001). Uniaxial tension in carbon fiber reinforced cement, sensed by electrical resistivity measurement in longitudinal and transverse directions. Cem. Concr. Res. 30, 1289–1294. doi:10.1016/s0008-8846(00)00304-5
Yunlong, Z. J. S., Jing, W., Xuesong, Q., and Qian, X. (2022). Optimization of performance index of self-sensing spray reactive powder concrete based on response surface methodology. Mater. Lett. X 13, 100120. doi:10.1016/j.mlblux.2021.100120
Zhang, Y., Wang, J., Wang, J., and Qian, X. (2022). Preparation, mechanics and self-sensing performance of sprayed reactive powder concrete. Sci. Rep. 12, 7787. doi:10.1038/s41598-022-11836-y
Keywords: high-performance shotcrete, glass sand, manufactured sand, carbon fiber, mechanical properties, self-sensing capability, finite element simulation
Citation: Wang J, Wang T, Zhang Y and Qian X (2024) Study on mechanical properties and self-sensing properties of sprayed high-performance concrete containing glass aggregate. Front. Mater. 10:1320584. doi: 10.3389/fmats.2023.1320584
Received: 12 October 2023; Accepted: 14 December 2023;
Published: 08 January 2024.
Edited by:
Chun-Xu Qu, Dalian University of Technology, ChinaReviewed by:
Lucio Nobile, University of Bologna, ItalyMuhammad Javed, COMSATS Institute of Information Technology, Pakistan
Copyright © 2024 Wang, Wang, Zhang and Qian. This is an open-access article distributed under the terms of the Creative Commons Attribution License (CC BY). The use, distribution or reproduction in other forums is permitted, provided the original author(s) and the copyright owner(s) are credited and that the original publication in this journal is cited, in accordance with accepted academic practice. No use, distribution or reproduction is permitted which does not comply with these terms.
*Correspondence: Yunlong Zhang, emhhbmd5dW5sb25nQGpsanUuZWR1LmNu; Xuesong Qian, cWlhbnh1ZXNvbmdAamxqdS5lZHUuY24=