 Bing Zhao1
 Xin-Bao Gu
94% of researchers rate our articles as excellent or good
Learn more about the work of our research integrity team to safeguard the quality of each article we publish.
Find out more
ORIGINAL RESEARCH article
Front. Mater. , 21 November 2023
Sec. Structural Materials
Volume 10 - 2023 | https://doi.org/10.3389/fmats.2023.1291434
This article is part of the Research Topic Recent Advances in Durability Improvement and Low-Carbon Strategy of Engineering Materials and Structures View all 17 articles
The quality grade assessment of coarse aggregate in recycled concrete has great significance for engineering quality, so the accurate estimation of its quality grade is vital. However, many factors affect its quality level, and its assessment procedure has a certain fuzziness and randomness. To overcome the abovementioned problems, the principal component analysis-cloud model was introduced. It is a combination of the principal component analytical method (PCA) and the normal cloud model and has the advantages of the two methods, as well as being widely applied to assess the quality level of different construction materials. To evaluate the coarse aggregate quality grade of recycled concrete in the present paper, the principal component analytical method (PCA) was applied to reduce the dimension of data and calculate the weight of each index, then a model of coarse aggregate quality based on cloud theory was constructed. According to the characteristic parameters of the cloud model, the coarse aggregate quality grade was determined. The conclusions indicate that the method is feasible for the accurate assessment of quality grade assessment of coarse aggregate, and its accuracy is very high. So, a new approach can be provided for the quality grade assessment of coarse aggregate in the future.
The quality grade evaluation of recycled concrete is of great significance in engineering construction. It can provide a powerful reference for construction units to achieve a rational use of recycled coarse aggregate and to comprehensively and accurately reflect the physical and mechanical properties of recycled concrete aggregate (Gu et al., 2021).
Because recycled concrete aggregate is defined as the recycling and application of the waste concrete block, it not only saves many construction costs but can also play a good role in energy conservation and environmental protection (Gu et al., 2021). As such, recycled concrete aggregates have gained increasingly more attention in many developed countries, which have carried out an abundance of experimental research (Gu et al., 2022), especially in determining the quality grade of recycled concrete aggregates. At present, there is a “Quality trial regulation of recycled concrete”, which was published in Japan in 1994, that selects water absorption and crushing index as the main measurement parameters to evaluate the quality grade of aggregates. However, the British Standards (1992) and the ASTM standards (USA) (2003), as well as other foreign scholars in this area of evaluation research, take the minimum apparent density, the maximum water absorption, the maximum content of needle-like particles, the maximum impact value, the maximum content of chlorine, and the maximum content of sulfate as the criteria for judging the quality grade of recycled coarse aggregate (Gu et al., 2021). Of course, domestic research on quality grade evaluation of recycled concrete coarse aggregate has never been interrupted. Based on a large number of experimental studies, the Ministry of Construction in China promulgated the standard of recycled aggregate for concrete in 2010 (GB/T 25,177-2010). It was put forward that the recycled coarse aggregate of concrete can be divided into three grades by 10 indexes, such as particle gradation, micro-powder content, mud content, water absorption rate, and needle-like particle content (Gu and Wu, 2016). Based on the uncertainty of the influence degree of each evaluation parameter on the quality grade of recycled concrete coarse aggregate, a fuzzy comprehensive evaluation method was put forward (Li and Wu, 2019). According to the knowledge of gray clustering evaluation theory, Bao and Wang. (2014) proposed a gray clustering evaluation model to evaluate the quality grade of recycled concrete coarse aggregates. Chai and Liu (2018) performed the quality grade evaluation of recycled concrete coarse aggregates based on the entropy weight extension theory.
The abovementioned research and evaluation methods play an essential role in guiding the rational selection of coarse aggregate in the concrete construction process (Gu et al., 2019; Gu et al., 2019). However, the methods mentioned above are limited in their ability due to the complexity and variability of influential factors that affect the coarse aggregate quality of concrete, for example, some factors are certain, some are uncertain, and some are random variables. Therefore, a comprehensive evaluation method that can better solve this kind of uncertainty and the multi-attribute problem should be sought.
The principal component analysis cloud was used in the present study to solve the problems mentioned above. For the method, the inner relationship between fuzziness and randomness was described, and the conversion between qualitative concepts and quantitative features was considered (Zhou et al., 2008; Zhou et al., 2021). Compared to the abovementioned methods, its assessment process has higher reliability and efficiency, so the suggested model has enormous application prospects.
The present research paper has been organized as follows: in Section 1, the methodology is introduced; in Section 2, a new quality assessment model of coarse aggregate is established based on the principal component analysis-cloud model; in Section 3, the results are analyzed and discussed; and in Section 4, conclusions are drawn.
The principal component analysis-cloud model is a combination of the principal component analytical method (PCA) and the normal cloud model and possesses the advantages of the two methods. The principal component analytical method (PCA) was applied to reduce the dimension of data and calculate the weight of each index, whereas the normal cloud model was used to estimate the quality level.
The principal component analysis was provided by Pirsson (Sheng, 1991) in 1901. It is a statistical analysis method that converts many variables into a few principal components by dimensional reduction. The respective principal component is usually composed of the original variables by using the linear combination. They are independent of each other, and most of the information of the original variable is reflected. This method is mainly applied for dimensional reduction and weight calculation. The calculative model is listed as follows: it is assumed that there are n samples and m variables in one instance. Then, the original assessment index of
Where
Where the defining principle of coefficients l is the square sum of coefficients in the different equations in the formula and is equal to 1, the principle components are independent of each other, and
Based on the relevant matrix, the weight coefficients of different indices can be obtained as follows (Alison et al., 2020):
1) the normalization of the sample matrix:
Where
2) The calculation of the Pearson relative coefficient matrix
Where
3) The calculation of eigenvalues and eigenvectors of the relevant coefficient matrix
4) Calculating the number of principal components. The cumulative contribution rate of principle components was calculated. Its eigenvalue was greater than 1. The accumulative contribution rate of 85%–95% corresponding to the former
Where
5) the coefficient matrix of the principal component to meet the cumulative contribution rate of 80% can be extracted as:
6) The calculation of different index weights
The cloud model was provided by Li et al. (1995) in the 1990s; it is a cognitive model applied to deal with the two-way conversion between qualitative concepts and quantitative data. According to vague mathematics and random mathematics, the theory is performed as a unified portrayal between the uncertainty of vague problems and the randomness of membership degree. It can deal with vague and random events; the cloud model has been successfully applied to wide-field (Xu et al., 2011).
The cloud model is defined as follows:
Where the distribution definitive degree in the domain
Where
If a variable has only a single boundary, such as [−∞,
To assess the quality grade assessment of coarse aggregates, the assessment model should be established. The procedure is listed as follows:
Many factors result in the quality grade of coarse aggregate; according to the relevant research (Wang and Park, 2001), the quality grade of coarse aggregate is affected by seven assessment indicators: apparent density(X1), the porosity (X2), the sturdiness(X3), the crushing index(X4), the micronutrient content(X5), the soil content(X6), and the water absorption(X7). These indicators are quantitative ones and the seven risk assessment indicators are classified into five levels: excellent (I), good (II), medium (III), qualified (IV), and bad (V), as shown in Table 1.
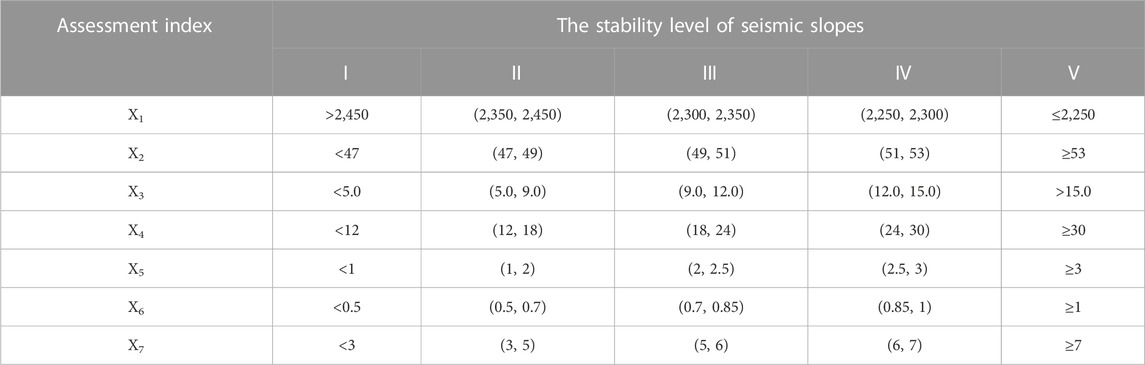
TABLE 1. The classification standard of the assessment index.
The quality grade of coarse aggregates not only affects the construction of concrete engineering but can also endanger human life. Consequently, evaluating the coarse aggregate quality grade of recycled concrete is essential (Chen and Li, 2008).
The flowchart of the assessment frame is plotted in Figure 1. At first, the predicting index and corresponding quality level intervals were determined and then, the weight calculation of a sample datum was performed using the principal component analytical method. Based on the classification interval of the assessment index, characteristic parameters
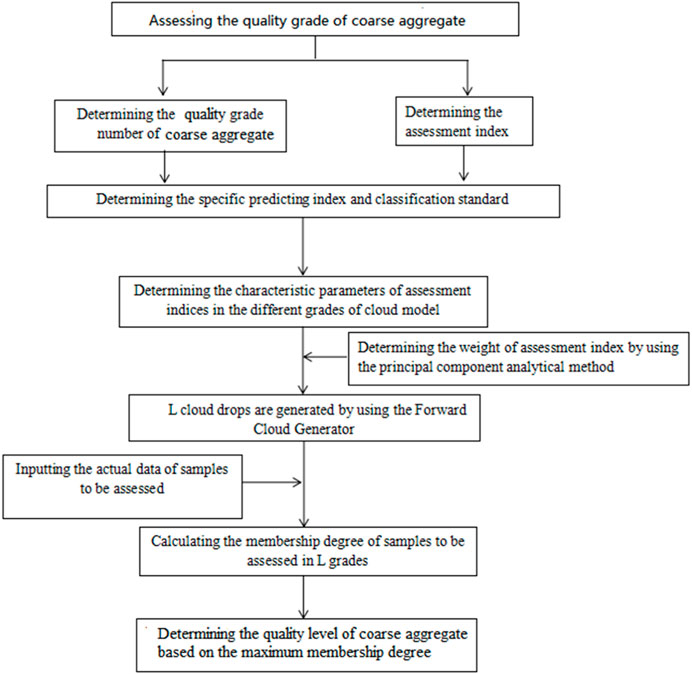
FIGURE 1. The flowchart of the assessment frame.
The abnormal cloud model was constructed because of the randomness and fuzziness of quality assessment. To evaluate the weight coefficients of each assessment index, the original data of six assessment indexes are shown in Table 2.
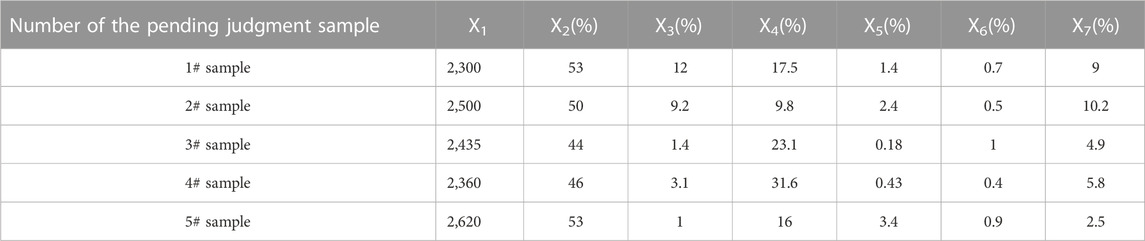
TABLE 2. Measured index values of waiting for the estimated sample.
Based on Eqs 1–6, and in combination with Table 2, the correlation coefficient matrix is shown in Table 3.
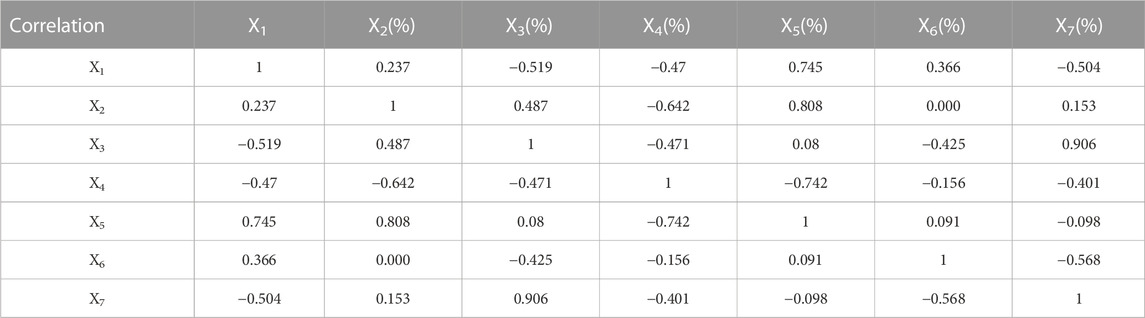
TABLE 3. The correlation coefficient matrix.
According to Eqs 7–9, the accumulative contribution rate of the principal component is shown in Table 4.

TABLE 4. The accumulative contribution rate.
It can be seen in Table 4 that the accumulative contribution rate of the former two principal components arrived at 81.797%. Its magnitude was greater than 80%, so the former two principal components were selected to calculate the weight of the predicting index. According to Eq. 10, the corresponding index weight was calculated as follows.
It was found that indexes X3, X5, and X7 had a great influence on the quality grade of coarse aggregate, and the effects of the other four indices were small in comparison.
Based on Table 1, and in combination with Eqs 11–14, the classification standard of normal cloud about the coarse aggregate is depicted in Table 5.

TABLE 5. The digital feature of the cloud model.
According to Table 1, the characters of the cloud model corresponding to different indices were calculated using the forward cloud generator and are plotted in Figure 2. The horizontal coordinates represent the magnitude of other variables, whereas the vertical coordinates denote the magnitude of certainty degree. A sub-figure in Figure 2 includes five clouds, namely, I, II, III, IV, and V. When a particular variable was fixed, the certainty degree of a certain point at the state grade could be obtained.
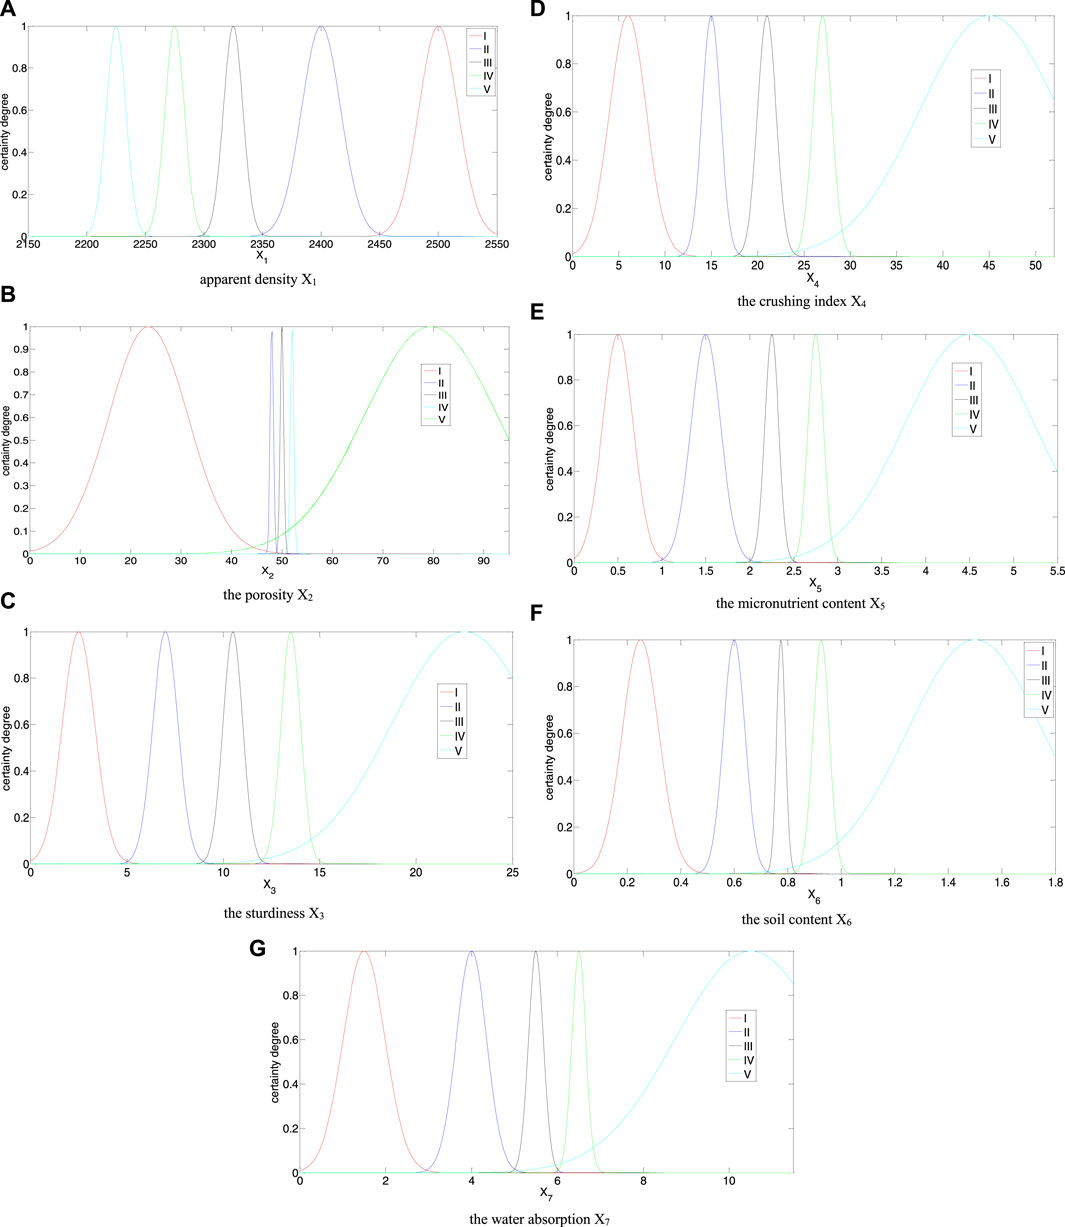
FIGURE 2. Cloud model of each assessment index.
According to Tables 2, 4, and in combination with Eqs 11, 17 18, finally, a comprehensive certainty degree was obtained, and it was compared with the actual investigation results. This is listed in Table 6.
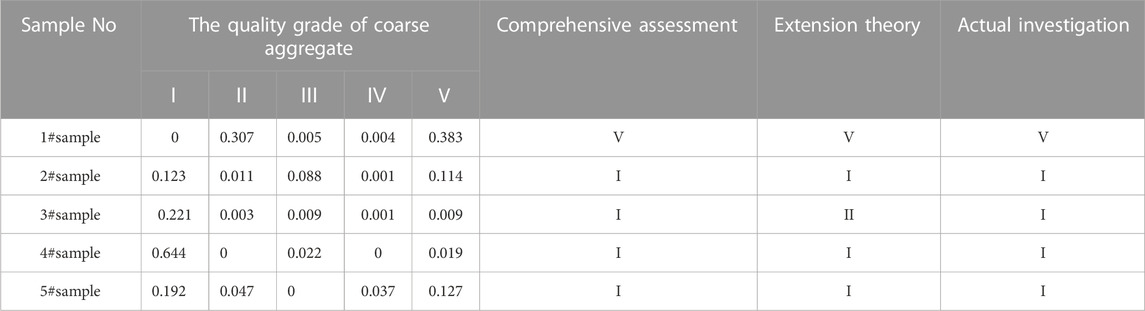
TABLE 6. Comprehensive certainty degree.
The principal component analysis-cloud model was applied to assess the quality grade of coarse aggregate. The outcomes are shown in Table 6. As shown in Table 5, the quality grades of coarse aggregate from samples 1 to 5 were different. The stable level from samples 2 to 5 was I, which means that the quality grade of coarse aggregate in these samples was excellent, so no measurement needed to be done. The quality grade of coarse aggregate in sample 1 was V, meaning that its grade of coarse aggregate was bad and that the necessary consolidation measurement should be performed for the sample.
According to the comparative results of the different evaluation models in Table 5, it could be concluded that the outcomes assessed by the principal component analysis-cloud method were consistent with the actual investigations for five different samples; its accuracy reached 100%, which is higher than the results from the Extension Theory (80%) (Chen and Li, 2008). The conclusion was drawn that it is feasible to evaluate the quality grade of the coarse aggregate of recycled concrete using the text model.
The model not only achieved accurate results but also provided more details for the quality grade of coarse aggregate. For example, the quality grade of sample 4 more likely belonged to level I than that of samples 2 and 3 because the certainty degree of sample 4 for grade I (0.644) was higher than that of samples 2 (0.123) and 3 (0.221).
In total, the results based on the principal component analysis-cloud model could reflect the quality grade of coarse aggregate. It provides a new method and knowledge for the quality grade of coarse aggregate in the future.
The regenerated fine aggregate produced by the Resource Company Limited was taken as the evaluation object. Its monitoring magnitude is listed as follows: X1 is 2351 kg/m3, X2 is 4.7%, X3 is 3.6%, X4 is 1.33, X5 is 0.71%, X6 is 0.95%, and X7 is 8.2%. The quality grade of recycled fine aggregate produced by the company was evaluated by the model in this paper; its procedure was similar to the abovementioned example and its results are shown in Table 7.
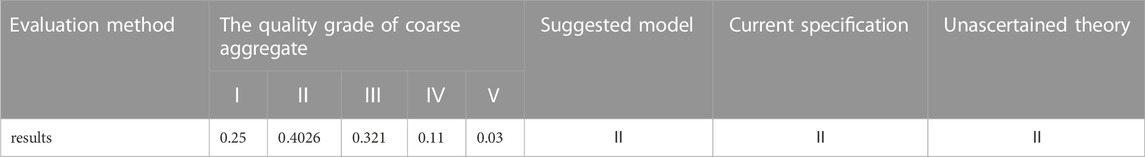
TABLE 7. Assessment results.
The results obtained from Table 7 demonstrate that the suggested method is consistent with the current specification, and unascertained theory (Wan et al., 2019). The principal component analysis-cloud model is feasible for the accurate assessment of coarse aggregate quality grade of recycled concrete.
Taking into consideration the value of apparent density (X1), porosity (X2), sturdiness (X3), crushing index (X4), micronutrient content (X5), soil content (X6), and water absorption (X7), a new multi-index evaluation method was introduced in this research paper to evaluate the quality grade of the coarse aggregate of recycled concrete using the principal component analysis-cloud model. The different indexes’ weighting coefficients were calculated using the principal component analysis method. The seismic stable level of slopes was judged using the normal-cloud model.
The present model was used for the quality grade of the coarse aggregate of recycled concrete. Finally, its outcomes were compared with the actual investigation and the calculated results obtained by using the Extension method; its accuracy reached 100%, which is higher than the results from the Extension method (80%), leading to the conclusion that it is feasible to evaluate the quality grade of the coarse aggregate of recycled concrete using the text model. It provides a new method and knowledge for the future quality grade evaluation of coarse aggregate.
The original contributions presented in the study are included in the article/Supplementary Material, further inquiries can be directed to the corresponding author.
BZ: Conceptualization, Investigation, Writing–review and editing. E-WX: Funding acquisition, Validation, Writing–review and editing. X-BG: Formal Analysis, Methodology, Writing–original draft.
The author(s) declare financial support was received for the research, authorship, and/or publication of this article. This work is supported by the Opening Project of Sichuan Province University Key Laboratory of Bridge Non-destruction Detecting and Engineering Computing (2022QYJ02 and 2022QYY02), Key scientific research projects of colleges and universities in Henan province (23B560019).
Author E-WX was employed by China MCC Group Co., Ltd.
The remaining authors declare that the research was conducted in the absence of any commercial or financial relationships that could be construed as a potential conflict of interest.
All claims expressed in this article are solely those of the authors and do not necessarily represent those of their affiliated organizations, or those of the publisher, the editors and the reviewers. Any product that may be evaluated in this article, or claim that may be made by its manufacturer, is not guaranteed or endorsed by the publisher.
Alison, M. Q., Canbulat, I., and Oh, J. (2020). Methods applied in Australian industry to evaluate coal mine slope stability. Int. J. Min. Sci. Technol. 30 (2), 151–155. doi:10.1016/j.ijmst.2019.11.001
Astm, D. (2003). 2940 03 Standard specification for graded aggregate material for bases or sub bases for high ways or airports. USA: American Society for Testing and Materials.
Bao, X. Y., and Wang, Q. C. (2014). Application of grey clustring method for quality grade estimate of recycled concrete coarse aggregate. J. Civ. Archit. Environ. Eng. 36 (3), 112–117.
British Standards (1992). BS 882 Specification for aggregates from natural sources for concrete. London: British Standards Institution.
Chai, N. J., and Liu, X. M. (2018). Evaluation of coarse aggregate quality grade of recycled concrete in China based on entropy weight extension theory. Bull. Chin. Ceram. Soc. 37 (1), 1–9. (in Chinese).
Chen, J., Shou, Y., and Zhou, X. (2022). Implementation of the novel perfectly matched layer element for elastodynamic problems in time-domain finite element method. Soil Dyn. Earthq. Eng. 152, 107054. doi:10.1016/j.soildyn.2021.107054
Chen, X. T., and Li, L. (2008). Prediction of tunnel rockburst based on AHP-FUZZY method. J. China Coal Soc. 33 (11), 1230–1234.
Gu, X. B., Ma, Y., Wu, Q. H., Ji, X. J., and Bai, H. (2021). The risk assessment of landslide hazards in Shiwangmiao based on intuitionistic fuzzy sets-Topsis model. Nat. Hazards 20.
Gu, X. B., Shao, J. L., Wu, S. T., Wu, Q. H., and Bai, H. (2021). The risk assessment of debris flow hazards in zhouqu based on the projection pursuit classification model. Geotechnical Geol. Eng. 8, 4–17.
Gu, X. B., Wang, L., and Wu, Q. H. (2022). The risk assessment of debris flow in the duba river watershed using intuitionistic fuzzy sets: TOPSIS model. Math. Problems Eng. 2022, 2022. Article ID 2031907, 12 pages. doi:10.1155/2022/2031907
Gu, X. B., and Wu, Q. H. (2016). The application of nonordinary, state-based peridynamic theory on the damage process of the Advances in Materials Science and Engineering rock-like materials. Math. Problems Eng. 3 (8), 1–9.
Gu, X. B., and Wu, Q. H. (2019). Seismic stability analysis of waterfront rock slopes using the modified pseudodynamic method. Geotech. Geol. Eng. 37 (3), 1743–1753. doi:10.1007/s10706-018-0718-1
Gu, X. B., Wu, Q. H., and Ma, Y. (2022). Risk assessment of the rockburst intensity in a hydraulic tunnel using an intuitionistic fuzzy sets-TOPSIS model. Adv. Mater. Sci. Eng. 2022, 1–14. Article ID 4774978. doi:10.1155/2022/4774978
Gu, X. B., Wu, Q. H., and Zhu, Y. H. (2019). The experimental investigation on the propagation process of crack for brittle rock similar material. Geotechnical Geol. Eng. 37 (6), 4731–4740. doi:10.1007/s10706-019-00934-w
Gu, X. B., Wu, S. T., Ji, X. J., and Zhu, Y. H. (2021). The risk assessment of debris flow hazards in Banshanmen gully based on the entropy weight normal cloud method. Adv. Civ. Eng. 2021, 1–11. doi:10.1155/2021/8841310
Klauer, S. G., Dingus, T. A., and Neale, V. L. (2016). The impact of driver inattention on near-crash/crash risk: analysis using the 100-car naturalistic driving study data [R]. Washington: National Highway Traffic Safety.
Li, D., Meng, H. J., and Shi, X. M.(1995). Affiliate cloud and affiliate cloud generator[J]. J. Comput. Res. Dev. 32(6): 15–26.
Li, S. C., and Wu, J. (2019). A multi-factor comprehensive risk assessment method of karst tunnels and its engineering application. Bull. Eng. Geol. Environ. 78 (6), 1761–1776. doi:10.1007/s10064-017-1214-1
Sheng, P. I. (1991). Application of grid steel frame to primary support for loess tunnel on Haolebaoji-Ji an railway. Tunn. Constr. 41 (4), 604–615.
Wan, B. T., Bao, X. Y., and Li, A. C. (2019). Evaluation on quality grade of recycled concrete fine aggregate. Bull. Chin. Ceram. Soc. 38 (9), 2758–2764. (in Chinese).
Wang, J. A., and Park, H. D. (2001). Comprehensive prediction of rock burst based on analysis of strain energy in rocks. Tunneling Undergr. Space Technol. 41, 49–57. doi:10.1016/s0886-7798(01)00030-x
Xu, Z. H., Li, S. C., and Li, L. P. (2011). Risk assessment of water or mud inrush of karst tunnels based on analytic hierarchy process. Rock Soil Mech. 32 (5), 1757–1766.
Zhou, X. P., Gu, X. B., and Qian, Q. H. (2016). Seismic bearing capacity of shallow foundations resting on rock masses subjected to seismic loads. KSCE J. Civ. Eng. 20 (1), 216–228. doi:10.1007/s12205-015-0283-6
Zhou, X. P., Pan, X. K., and Cheng, H. (2021). The nonlinear creep behaviors of sandstone under the different confining pressures based on NMR Technology. Rock Mech. Rock Eng. 54 (9), 4889–4904. doi:10.1007/s00603-021-02557-1
Keywords: cloud model, recycled concrete, quality grade, evaluation, coarse aggregate
Citation: Zhao B, Xue E-W and Gu X-B (2023) Evaluation of coarse aggregate quality grade of recycled concrete based on the principal component analysis-cloud model. Front. Mater. 10:1291434. doi: 10.3389/fmats.2023.1291434
Received: 09 September 2023; Accepted: 06 November 2023;
Published: 21 November 2023.
Edited by:
Zhongya Zhang, Chongqing Jiaotong University, ChinaReviewed by:
Junwei Chen, Wuhan University, ChinaCopyright © 2023 Zhao, Xue and Gu. This is an open-access article distributed under the terms of the Creative Commons Attribution License (CC BY). The use, distribution or reproduction in other forums is permitted, provided the original author(s) and the copyright owner(s) are credited and that the original publication in this journal is cited, in accordance with accepted academic practice. No use, distribution or reproduction is permitted which does not comply with these terms.
*Correspondence: Xin-Bao Gu, MTU4MjM0MDU5NTJAMTYzLmNvbQ==
Disclaimer: All claims expressed in this article are solely those of the authors and do not necessarily represent those of their affiliated organizations, or those of the publisher, the editors and the reviewers. Any product that may be evaluated in this article or claim that may be made by its manufacturer is not guaranteed or endorsed by the publisher.
Research integrity at Frontiers
Learn more about the work of our research integrity team to safeguard the quality of each article we publish.