 Yanfei Zhang1
 Yu Wang
95% of researchers rate our articles as excellent or good
Learn more about the work of our research integrity team to safeguard the quality of each article we publish.
Find out more
ORIGINAL RESEARCH article
Front. Mater. , 04 August 2023
Sec. Structural Materials
Volume 10 - 2023 | https://doi.org/10.3389/fmats.2023.1242764
This article is part of the Research Topic Physico-Mechanical Properties and Treatment Technology of Hazardous Geomaterials, volume II View all 17 articles
The instability of the open-pit slope and associated disasters of complex orebodies such as hanging-wall mining are the key problems to be solved urgently in the development of western resources. In this work, taking the hanging-wall mining in the open-pit mine of Hejing iron mine, for example, the disaster mechanism influenced by the coupling freeze-thaw and hanging-wall mining is systematically studied by 3D laser scanning and numerical simulation. Firstly, the rock mass structure information such as dip, dip angle, spacing, and equivalent trace length characteristics was obtained using 3D intelligent recognition technology. Then, numerical simulation is employed to reveal the influence of freeze-thaw and excavation sequences on the overall stability of the open-pit slope. The stress, displacement, plasticity zone, and maximum shear strain patterns are revealed in detail. The results show that the excavation engineering will lead to frequent increase and unloading of the internal stress of the rock mass, and the gradual increase of the goaf area will cause great damage to the rock mass. The slope failure mode is strongly impacted by freeze-thaw weathering and orebody excavation.
The exploration of mineral resources is advancing into cold regions currently. In the high cold and high-altitude regions, the rock mass is encountered with repeated freeze-thaw weathering, especially for the rock joints where frost-heaving forces increase aperture and length (Forte et al., 2021; Song et al., 2021; Wang et al., 2022; Fakhri et al., 2023; Xu et al., 2023). The communication of the rock joints would lead to the instability of the rock mass (Ghobadi and Babazadeh, 2015; Bai et al., 2019; Bai et al., 2021). In addition, strong excavation disturbance during orebody recovery also leads to damage accumulation (Shang, 2022; Wang et al., 2023a); damage and failure of the rock mass is accelerated for the rock subjected to the coupling freeze-thaw and disturbance conditions. As a result, it is important to investigate the structural deterioration mechanism for the rock mass in cold regions in order to ensure long-term stability during the rock mass construction.
In mining, underground engineering and related geotechnical engineering and the collection and identification of the rock mass structural plane information in cold regions are very important for the rock mass stability analysis. At present, many scholars have put forward a variety of methods for collecting the rock mass structural plane information, which is summarized as follows: fine line method, window method, drilling method, digital photogrammetry, GPS-RTK technology, 3D laser scanning, etc. (Battulwar et al., 2019; Huang et al., 2023). Among them, 3D laser scanning has a wide measurement range and can obtain large-scale structural plane information, and point cloud data information which has strong optimizability can be processed by multiple methods, and has high practicability to a certain extent. For example, Kocak et al. (1999) first surveyed the seafloor with 3D laser scanning technology. Slob et al. (2005) proposed a method of triangular mesh reconstruction of point cloud data and combined it with the fuzzy K-means method to group the rock mass structural planes. Tuckey and Stead (2016) proposed a new method to improve the efficiency and accuracy of three-dimensional laser scanning to map discontinuity persistence and intact rock bridges in rock slopes; the method was validated from several slope cases. Ge et al. (2012) thoroughly studied and optimized the method of 3D laser scanning technology measurement to obtain the appearance of a structural plane. Fekete and Diederichs (2010, 2013). employed 3D laser scanning technology to map rock joints for stability analysis of tunnels in blocky rock masses. In addition, the geotechnical and operational applications for 3-dimensional laser scanning were also extended to the drill holes. Maerz et al. (2013) proposed a simple method for the extraction of the rock joints from the Terrestrial LIDAR Data; the accuracy of the method was proved afterward. Gigli and Casagli (2011) proposed a semi-automatic extraction method to obtain the rock mass structure plane from high-resolution LIDAR point clouds. Lato and Vöge (2012) used cluster analysis techniques on the vector data from the rock mass to investigate joint information. Menegoni et al. (2019) used a remotely piloted aircraft system (RPAS) and digital photogrammetry to obtain the point cloud of an outcrop rock mass; they found that the 3D texturized digital outcrop model was effective to represent the discontinuity data. Battulwar et al. (2021) summarized the state-of-the-art of automated extraction of the rock mass discontinuity characteristics using 3D surface models; the strengths and drawbacks of each method of extracting rock joints were discussed. Zhang et al. (2018) presented a methodology for the automated extraction of rock discontinuities from a point cloud and the resulting 3D digital model of the rock mass. A sensitivity analysis was conducted to reveal the influencing factors of the extraction results. The rock mass structural plane information recognition and acquisition at the present stage have limitations; they are mainly restricted by technology and sampling equipment, cost, and complex terrain factors, such as difficulty in achieving more accurate information acquisition and characteristic point recognition. There is a deviation from the actual situation; it is necessary to further perfect and improve access to information technology and method to improve the accuracy of the rock mass structural plane information collection.
Slope stability is a key problem that cannot be ignored in mining engineering. Currently, quantification and qualitative analysis of slope stability have been realized (Wang et al., 2023a; Wang et al., 2023b; Chen et al., 2023). The qualitative analysis method can only have a preliminary estimate of the stability of the rock slope but cannot accurately analyze the stability of the slope. The numerical analysis method is widely used in slope stability analysis by applying advanced computer simulation technology to predict slope displacement trends. Some scholars have realized the influence analysis of rainfall, earthquake, blasting, and other factors on slope stability (Bai et al., 2021; Wang et al., 2022). For hanging-wall mining in an open-pit mine, the stability of an open-pit slope geometry but also the excavation disturbance and other engineering disturbance factors have been investigated. Liu and Zeng (2020) made a detailed summary of the mining methods of hanging-wall ore. Du (2013) used FLAC 3D numerical simulation software to analyze the distribution law of slope stress when mining the lower side of the joint filling mining method. However, at present, there are many kinds of methods to study the stability of rock mass in cold regions, but each has some shortcomings. The stability analysis of rock slopes in the Alpine region needs to consider a variety of factors. In addition to the engineering condition, the rock mass structural plane, freeze-thaw weathering, and other factors should also be considered. At the same time, there are few studies on special projects such as hanging wall mining in the Alpine region.
In this work, the influencing factors of freeze-thaw and excavation disturbance were considered to reveal the instability mechanism of an open-pit slope in Hejing County, Xinjiang province. Firstly, 3D laser scanning technology was used to extract the rock mass structural plane and get the geometric information, including orientation, spacing, and consistency. Secondly, numerical simulators were employed to establish the geometrical model, and the generalized Hoek-Brown criterion and Bardon-Bandis criterion were introduced to represent the stress condition during freeze-thaw treatment and excavation. The patterns of stress, displacement, shear strain, and plasticity zone that were influenced by the freeze-thaw weathering and excavation disturbance were discussed.
At present, the open-pit and hanging-wall mining schemes are adopted in the Hejing Iron Mine. The height of the open pit step is 12 m, the height of the section step is 24 or 36 m, and the peel elevation is 3464 ∼ 3596 m. At present, the level of the open-pit mining has reached 3390 m level, and the open-pit step above the level of 3,476 m has been completed. The final limit of the open-pit mining is an oval stope, with a length of 593 m from east to west and a width of 385 m from north to south. The highest mining elevation of the limit is 3,680 m, the elevation of the sealing ring is 3,428 m, and the mining height is approximately 290 m. Currently, the remaining open-pit limit mining volume is 3.78 million t. According to the mine production plan, the open-pit mine can continue to produce for 4 years, and the production scale is between 580,000 and 1.4 million t/a. The mining scope of this design is the hang-wall ore body between 3,380 and 3,536 m at the east of the open pit. Figure 1 shows the current mining status of the open-pit mine and the actual scope of hanging-wall mining.
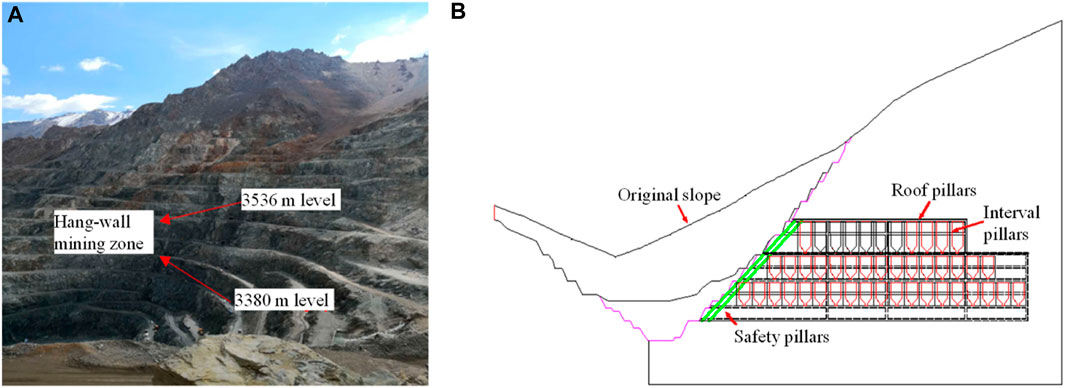
FIGURE 1. The hang-wall mining of the Beizhan iron mine. (A) The full view of the open pit slope; (B) The hang-wall mining method.
In this paper, the Optech Polaris LR 3D laser scanner was used to scan the open-pit slope of an iron mine. The main technical parameters are shown in Table 1. The collected information is the point cloud data of the eastern rock slope, which contains 581,623 points in total. The scanning range is 3636.6565 m2, and the maximum size of the scanning area is 30.3549 m × 149.1210 m × 26.0951 m. Massive point cloud data of rock outcrops are obtained, which mainly contain three-dimensional coordinates and gray-level information of each point in the point cloud. The spatial geometric coordinates are mainly used to extract the rock mass structural plane information, and the gray level information can be used to verify the scanning results.
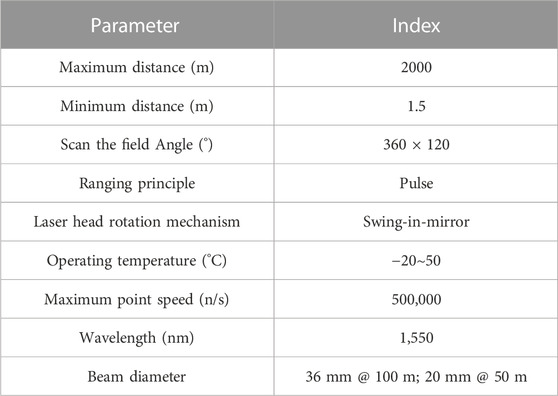
TABLE 1. Main parameters of Polaris LR 3D laser scanner.
Before extracting structural plane information, point cloud data should be preprocessed. Firstly, the 3D image difference method is used to grid the point cloud data to improve the calculation speed. Then, the same structural plane of the point cloud data can be recognized by discriminating whether the plane normal vector fitted by the adjacent lattice is the same or not based on the eigenvector. Then, the traversal method is used to detect the flatness of the point cloud data. Finally, the optimal threshold is selected to improve the recognition effect of the structural plane and obtain accurate structural plane information.
The least square method is used for linear fitting to obtain the occurrence information of the structural plane, assuming that the coordinates of each point on the plane are (x1,y1,z1), (x2,y2,z2),…, (xn,yn,zn). Then the matrix form is shown in Eq. 1:
order
Vector A is obtained by fitting, and
Assume that the normal vector of the rock mass structural plane is (a, b, c), where c > 0 (only a well-exposed surface can be scanned). According to the formula, the inclination α and inclination β of the rock mass structural plane in the geodetic coordinate system can be obtained, as shown in Eq. 5:
In view of the grouping of structural planes, the K-means clustering analysis method is used to identify three groups of steep dip joints. For the plane, it can be regarded as a deterministic structural plane, and the corresponding geometric parameters of the plane can be determined mainly through manual identification or field investigation. Secondly, the sample is preset as the initial cluster center, and the value of the cluster center is calculated after the sample is classified into the cluster center. After repeated calculations, all the sample points are classified into the cluster center. Finally, the value of the cyclic sample points classified to the cluster center does not change. Combined with the site geological survey information, the average occurrence of the three groups of structural planes is calculated by the coordinate information of each point and the classification situation.
According to the spacing between structural planes, the same set of structural planes is first transformed into ideal structural planes, as shown in Figure 2. The normal vectors of the two planes before and after the transformation are consistent with the average normal vector.
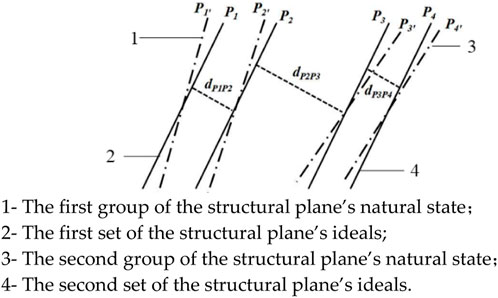
FIGURE 2. Schematic diagram of transformation and spacing calculation of the same group of structural planes.
The distance between adjacent structural planes can be calculated by combining the formula in Eq. 6 with the vertical distance between two parallel planes.
Where: P1 and P2 are equations of planes 1 and 2, respectively; dp1p2 is the vertical distance of P1 and P2.
According to the equivalent trace length of the structural plane, each point of the structural plane is projected to the xoy plane according to the coordinate system; the area of the projection area Sxoy is obtained, and the area S of the structural plane is obtained according to the projection relation:
In order to simplify the calculation, the equivalent circle with an equal area was used to represent the structural plane, and the radius of the equivalent circle r is shown in Eq. 8:
The equivalent trace length information of the structural plane is represented by the equivalent circle radius.
For roughness, the fractal dimension D is obtained by using the overlying box method based on the fractal theory. For the rock mass structural plane, taking the 3D geometric model as an example, it is assumed that the side length of the square box is δ, the total number of boxes is N(δ), and the box covers the profile line. The existence relationship is shown in Eq. 9:
Where, the fractal dimension D is obtained by fitting Eq. 10:
At present, the generalized Hoek-Brown criterion is widely used in the study of slope stability. This criterion introduces disturbance factors
Where
According to the laboratory rock mechanics test data and the Hoek-Brown parameter value method above, and comprehensively considering the mining environment and geological conditions, the final parameter values of each part of the rock mass are shown in Table 2.
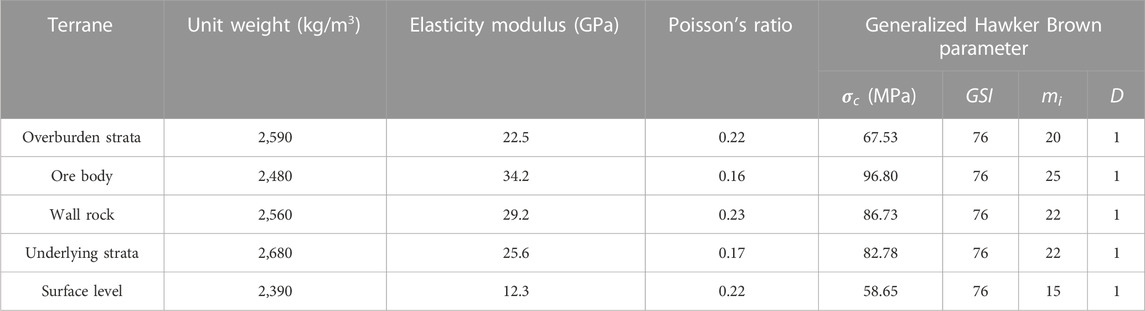
TABLE 2. Parameter values of each part of the rock mass.
Barton proposed the nonlinear JRC-JCS empirical formula, which can be widely used to calculate the shear strength of structural surfaces with rough surfaces and no filling[10]. The formula is shown in Eq. 12:
Where
The value
The value
The basic friction angle of the rock joint surface
Based on the original outer boundary and excavation area boundary of the Hejing iron mine in Xinjiang, the model boundary, excavation area, and other elements of the model were automatically generated by importing the DXF file from AutoCAD by modifying lines and changing layer names. According to the above data of the laboratory rock test, three-dimensional laser scanning intelligent identification, and site survey report, combined with the actual situation of the site, the rock mass in different areas and the material in different areas are respectively assigned values. The finite element mesh with a three-node triangle as the basic element is automatically generated to limit the hinge supports in the X direction on both sides of the model, and the hinge supports the X and Y directions at the bottom of the model, thereby removing the slope restrictions. The final model is shown in Figure 3.
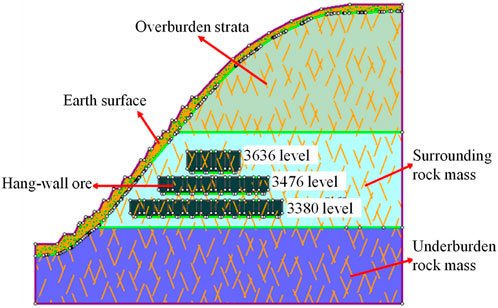
FIGURE 3. The calculation model of hanging-wall mining in an open-pit mine.
It can be seen from the engineering background that the scheme of open-pit mining and hanging-wall mining is adopted at the same time, and hanging-wall mining is a backoff mining along the strike from the west to the east. In view of the representative stages in the overall hanging-wall mining project, the correlation analysis is carried out, and the variation range of the stages is considered. The horizontal mining progress is taken as the division node, and the comparative analysis is made on the 16-year excavation stage, 18-year excavation stage, 20-year excavation stage, and 23-year excavation stage. Figure 4 shows the schematic diagram of the hanging-wall mine excavation model in different stages.
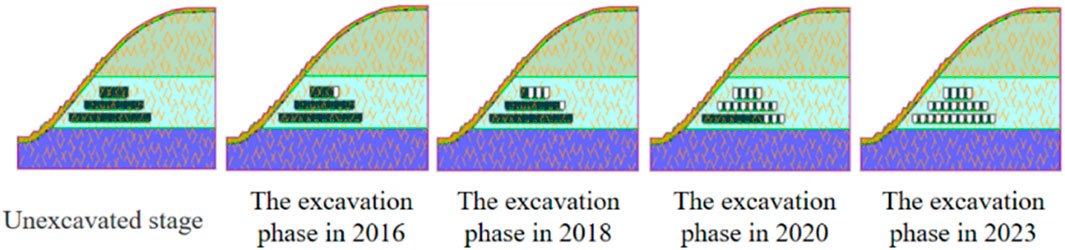
FIGURE 4. Schematic diagram of hanging wall mine excavation model at different stages.
Based on the point cloud data of the rock slope, the method of point cloud information extraction and intelligent identification of the rock mass structural plane is used to obtain the distribution law of the occurrence, spacing, and trace length of the rock mass structural plane by using mathematical statistics theory. The intelligent identification of the rock mass structural plane and its distribution are shown in Figures 5, 6, and the parameters are shown in Table 3.
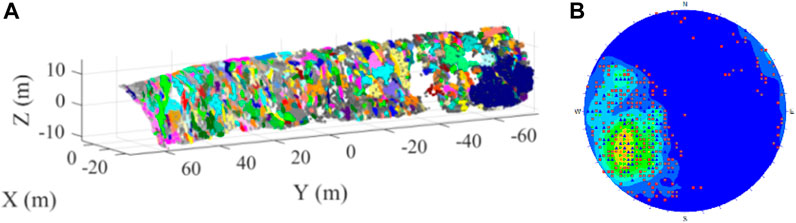
FIGURE 5. The identified rock mass structural plane. (A) Structural plane distribution characteristics; (B) The result of the equatorial projection.
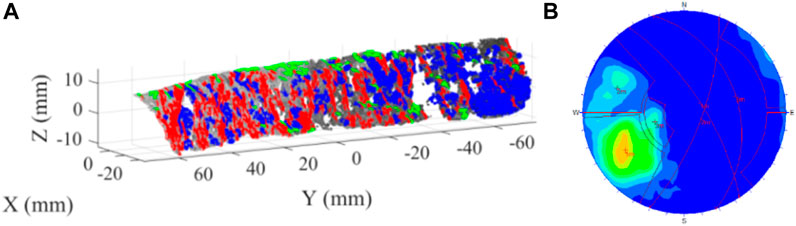
FIGURE 6. Distribution of classified rock mass structural planes. (A) Occurrence and distribution characteristics; (B) The result of the equatorial projection.
TABLE 3. Mathematical statistics of structural planes of different types of rock masses.
Combined with the occurrence information of the structural plane, according to the probability distribution model of the geometric parameters of the rock mass structural plane, the statistical characteristic parameters can be calculated accordingly. The volume density of the rock mass structural plane can be obtained by the distance information of the rock mass structural plane measured on-site. Finally, it was determined that the average occurrence of the three groups of the rock mass structural planes at different stations of the open-pit slope were 237° < 69°, 290° < 70°, and 252° < 34°; the average spacing was 0.223, 0.699, and 0.481; and the equivalent trace length was 0.688, 1.140, and 0.784, respectively. The roughness (fractal dimension) was 2.857, 2.862, and 2.847; and the joint number per unit area was 0.111, 0.034, and 0.020, respectively.
It is very important to analyze the change in the slope model at different excavation periods for the overall mining layout and disaster prediction. According to the current excavation state of the hanging-wall mine, the rock stability analysis considering freeze-thaw factors is carried out by virtue of the deterioration characteristics and failure evolution process of freeze-thaw rock.
In view of the characteristics of maximum principal stress, as shown in Figures 7, 8, overall, the excavation results in the redistribution of in-situ stress of rock mass engineering. The unloading effect results in the expose of ore room at the bottom of top area. Large stress change occurs at the pillar and mine roof after the mining activities. Under the condition of freeze-thaw, these areas have little correlation with the number of freeze-thaw. Under the same excavation condition, the variation of slope stress with different numbers of freeze-thaw is very small, and the maximum principal stress is still concentrated around the ore house and pillar area. Freeze-thaw has no obvious influence on the distribution of rock mass stress.
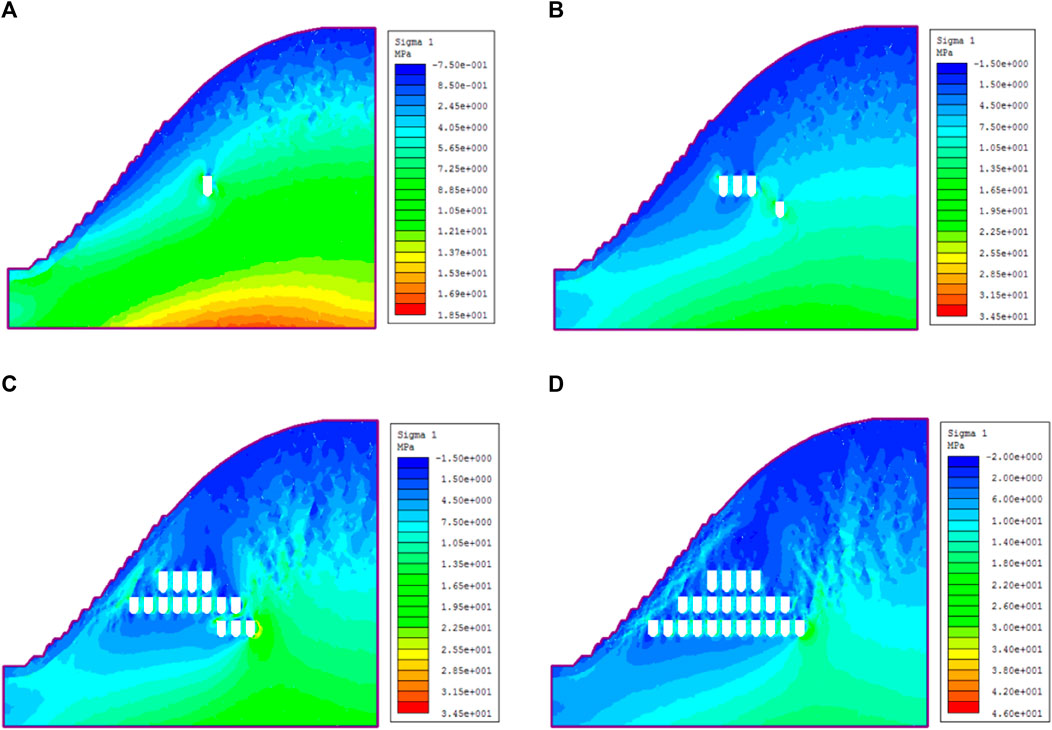
FIGURE 7. The maximum principal stress nephogram of models at different excavation stages. (A) The excavation stage in 2016. (B) The excavation stage in 2018. (C) The excavation stage in 2020. (D) The excavation stage in 2023.
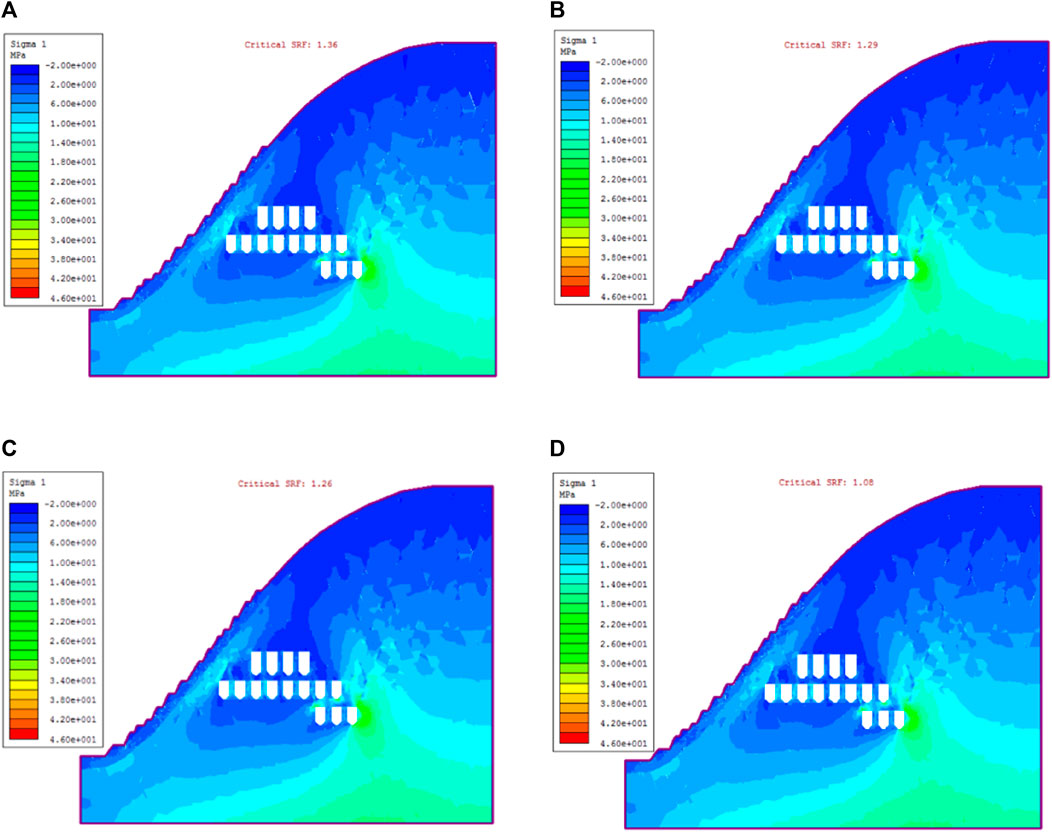
FIGURE 8. Maximum principal stress contour of the model under different freeze-thaw cycles. (A) Freeze-thawing 0 cycle. (B) Freeze-thawing 30 cycles. (C) Freeze-thawing 50 cycles. (D) Freeze-thawing 100 cycles.
On displacement characteristics, as shown in Figures 9, 10, overall, with excavation area increases, the total displacement change area gradually expanded, increasing the largest displacement; displacement of the overall trend is consistent with the stress changes, showing that stress changes are the root cause of the engineering rock mass deformation and failure. Stress change trends decided to cause rock mass deformation and failure patterns Treatment measures should be taken at the excavation stage when displacement changes greatly. In the case of freeze-thaw, the trend in the total displacement increases with the increase in the number of freeze-thaw, and the maximum displacement area expands with the increase in the number of freeze-thaw and gradually shifts to the interior of the slope. The displacements after 30 times of freezing and thawing and 50 times of freezing and thawing are almost the same, which are 204 and 216 mm, respectively. This also indicates that a small increase in the freezing and thawing has a small impact on rock mass failure and slope stability. After 100 times of freezing and thawing, the total displacements of rock mass increase sharply to 360 mm. It indicates that the slope has great displacement changes and the accumulation of freeze-thaw damage has caused the rock mass instability and failure.
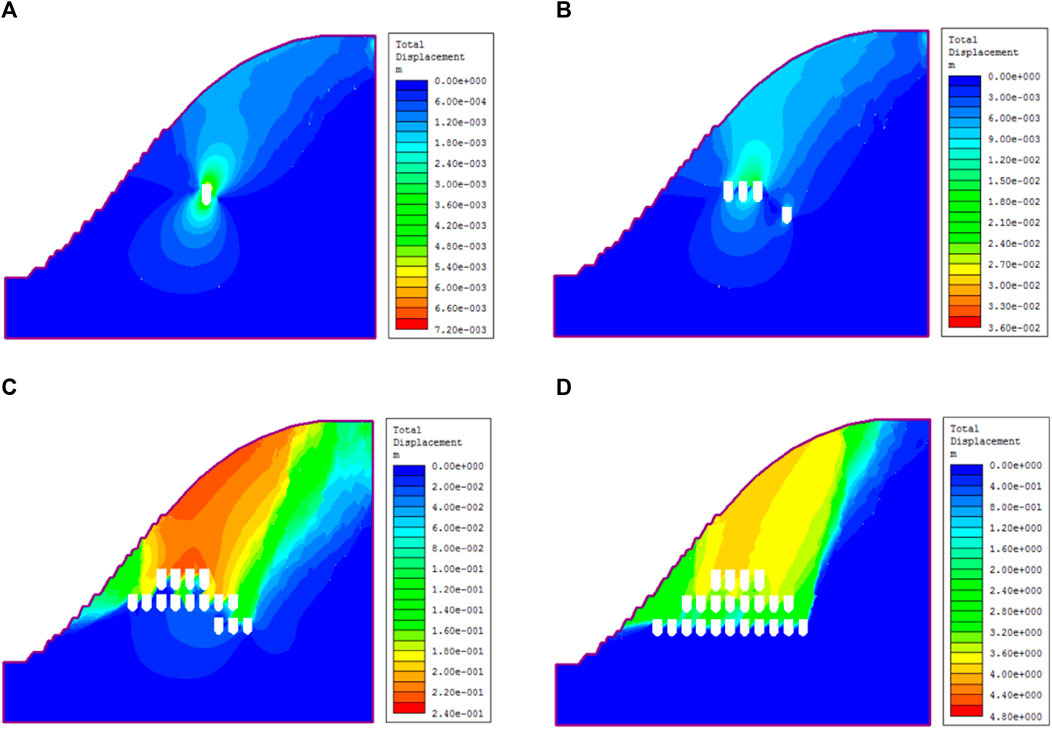
FIGURE 9. Total displacement contour for the slope at different excavation stages. (A) The excavation stage in 2016. (B) The excavation stage in 2018. (C) The excavation stage in 2020. (D) The excavation stage in 2023.
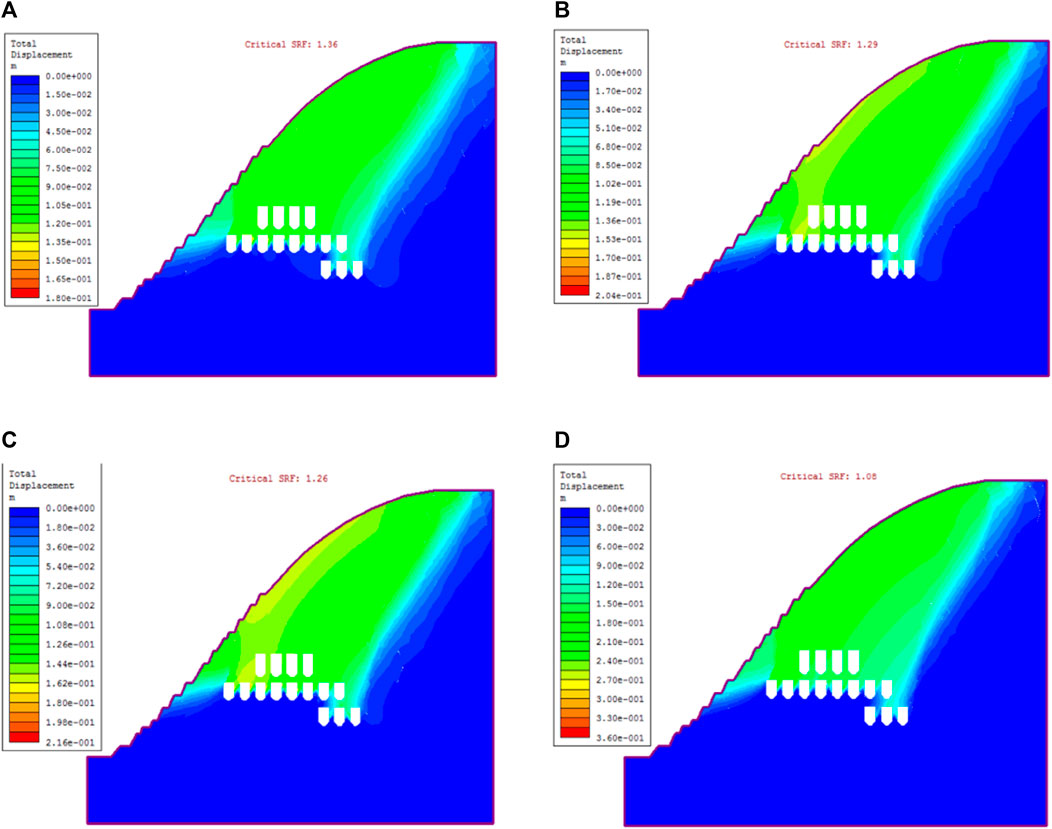
FIGURE 10. Total displacement contour of the model under different freeze-thaw cycles. (A) Freeze-thawing 0 cycles. (B) Freeze-thawing 30 cycles. (C) Freeze-thawing 50 cycles. (D) Freeze-thawing 100 cycles.
In view of the characteristics of shear strain, as shown in Figures 11, 12, overall, with the deepening of the excavation process and change in regional shear extension, shear strain continues to increase. In addition to this, the chamber surrounding the rock and joint junction appears to have a larger shear strain; the shear strain area in different levels and the relative position of two ore rooms also caused shear failure to happen The shear strain is larger than that of the same horizontal chamber. It is worth noting that a large shear strain occurred along the diagonal direction in the rightmost chamber at the 3,380 m mining stage, which was due to the increase in the horizontal mining stage and the continuous expansion of joints in coalescing, forming a large shear strain area. Prevention and control should be focused on the above areas. In the case of freeze-thaw, the increase in freeze-thaw times does not change the shear strain of rock mass. Maximum shear strain concentration on reservation pillar areas, and with the increasing number of freezing and thawing, while the maximum shear strain did not change, but increased shear strain zone area, slope site in a small amount of shear deformation; the reason of this phenomenon is the slope degradation caused by the freeze-thaw action. As the freeze-thaw action increases gradually, the freeze-thaw damage extends to the rock mass. As a result, the joints and fractures are damaged, the overall shear strain increases greatly, and the rock mass will fail along the new shear plane, which is consistent with the change in displacement.
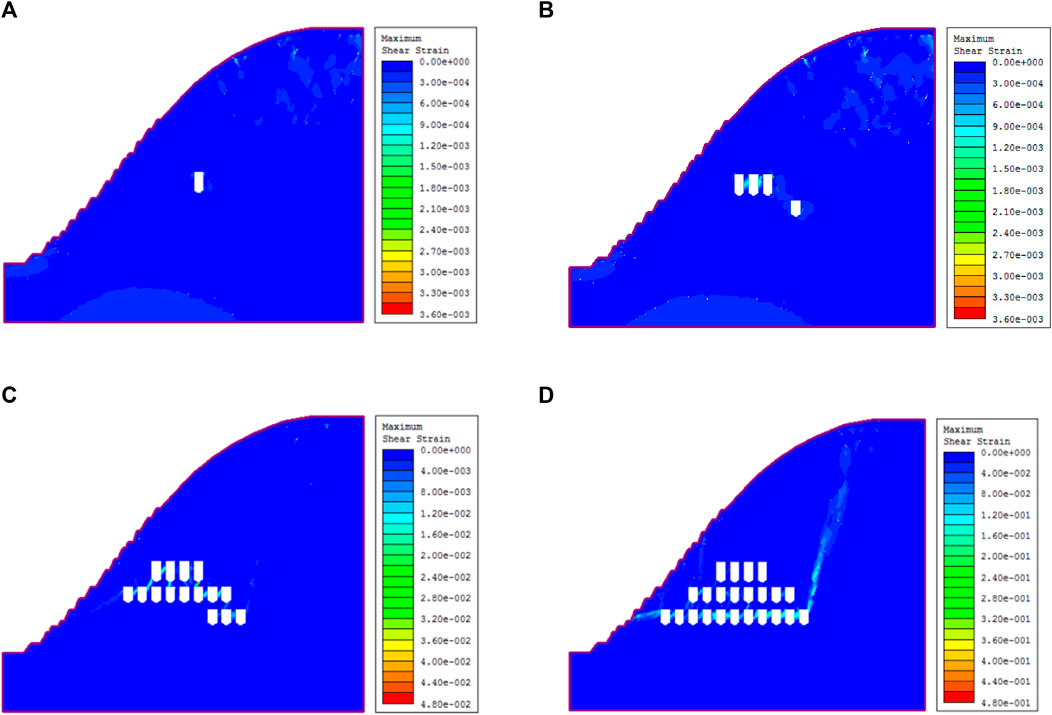
FIGURE 11. Maximum shear strain nephogram of models at different excavation stages. (A) The excavation stage in 2016. (B) The excavation stage in 2018. (C) The excavation stage in 2020. (D) The excavation stage in 2023.
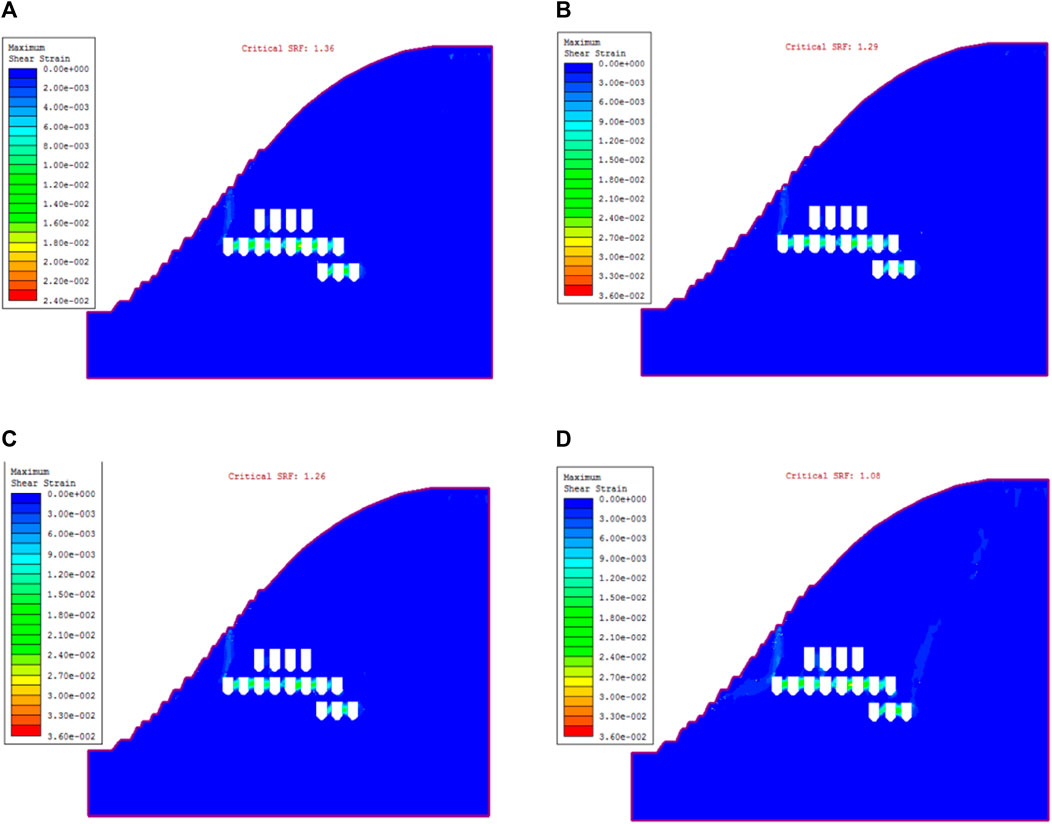
FIGURE 12. Shear strain nephogram of the model under different freeze-thaw times. (A) Freeze-thawing 0 cycle. (B) Freeze-thawing 30 cycles. (C) Freeze-thawing 50 cycles. (D) Freeze-thawing 100 cycles.
For the yield rock unit and joint unit characteristics, as shown in Figures 13, 14, rock mass begins to yield and is mainly concentrated at the top of the slope rock mass, with the increase in the excavation stage. The yield unit and joint increases; along the ore mining area, the yield unit with plenty of expansion joints occur and gradually increases, resulting in damage to the slope stability. In the last stage, the yield unit observation shows that the tensile failure is mainly concentrated in the bottom of the roof, while the shear failure is mainly concentrated in the retaining pillar area. Under freeze-thaw conditions, both the yield joints and yield rock units continue to expand with an increase in the number of freeze-thaw cycles. They gradually extend from the original area up to the lower part, and the main concentration area is still in the shallow part of the rock slope, indicating that the damage and deterioration of rock mass caused by freeze-thaw is mainly concentrated in the surface of the slope. The yield joint and element of the slope reach the maximum after 100 freezing and thawing cycles, and the yield element and joint of the slope are connected with the excavation area. The freeze-thawing damage is from the surface to the inside, which aggravates the deformation and failure of the excavation area, and the rock mass is unstable.
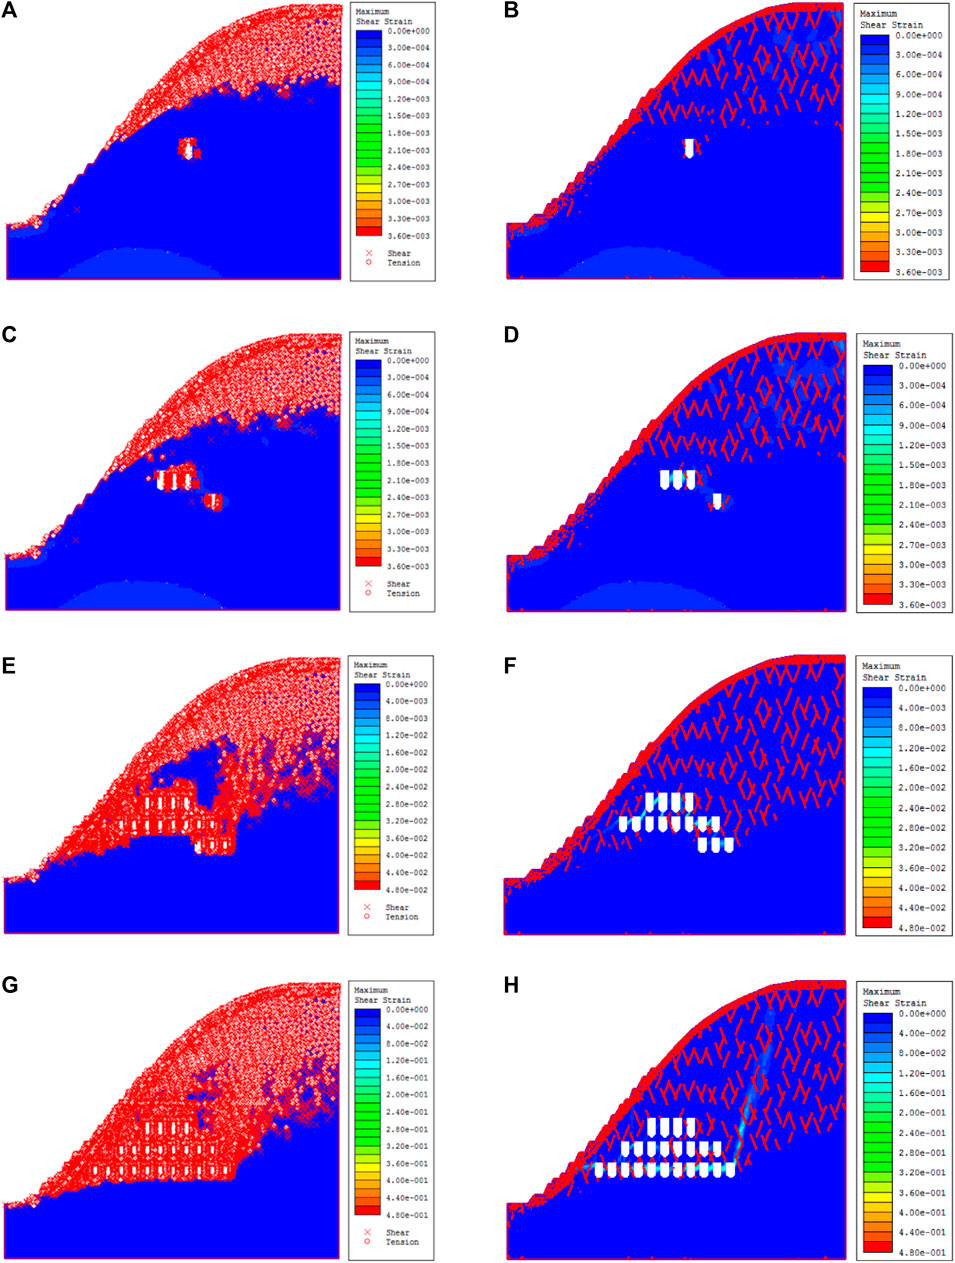
FIGURE 13. Yield element and joint cloud map of models at different excavation stages. (A) Concurrence of yield unit during excavation in 2016. (B) Yield joint cloud map during excavation in 2016. (C) Cloud image of yield unit during excavation in 2018. (D) Yield joint cloud map during excavation in 2018. (E) Cloud image of yield unit during excavation in 2020. (F) Yield joint cloud map during excavation in 2020. (G) Cloud image of yield unit during excavation in 2023. (H) Yield joint cloud map during excavation in 2023.
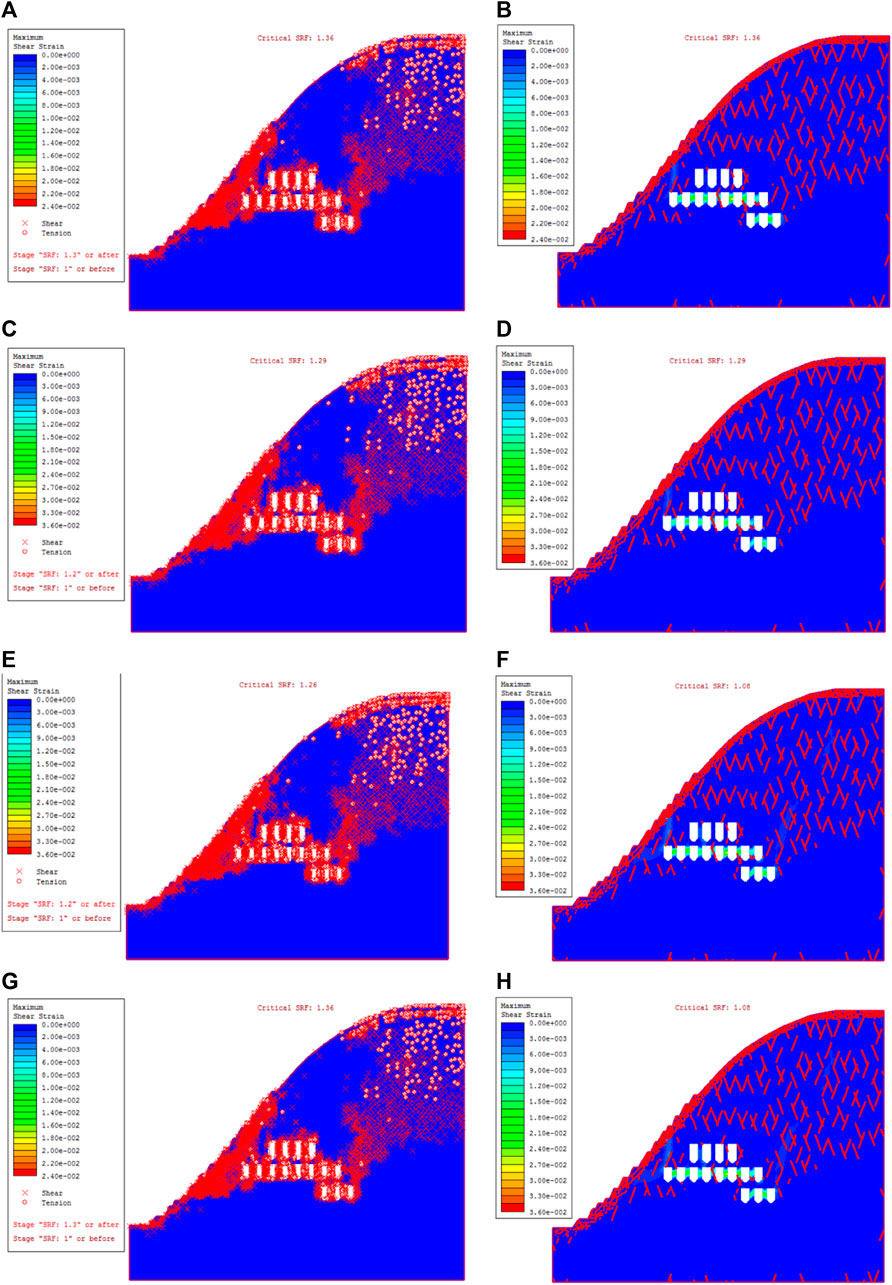
FIGURE 14. The yield rock unit and joint unit of the slope model were subjected to different freeze-thaw cycles. (A) Yield rock unit of 0 freeze-thaw cycle. (B) Yield joint of 0 freeze-thaw cycle. (C) Yield rock unit of 30 freeze-thaw cycles. (D) Yield joint of 30 freeze-thaw cycles. (E) Yield rock unit of 50 freeze-thaw cycles. (F) Yield joint of 50 freeze-thaw cycles. (G) Yield rock unit of 100 freeze-thaw cycles. (H) Yield joint of 100 freeze-thaw cycles.
According to the characteristics of slope instability, as shown in Figures 15, 16, with the gradual increase in the excavation area and the continuous expansion of the mining level stage, the slope failure performance is different. The rock mass deformation in the excavation stage of 2016 and the excavation stage of 18 years is mainly realized as a small amount of damage on the surface of the rock mass, and the overall displacement of rock mass is not obvious. With the continuous development of the project, different horizontal stages are put into mining one after another, and the tendency of rock mass deformation becomes obvious. During the 20-year excavation stage, a small amount of slippage occurs in the rock mass slope, and the slope is affected by gravity and stress redistribution after excavation, resulting in great failure and deformation. In the excavation stage of 23 years, the rock mass has been damaged more obviously, and a large area of goaf has appeared in the rock mass. At the same time, the stress redistribution phenomenon occurs frequently after excavation, which makes it difficult for the rock mass to withstand the deformation and failure caused by stress changes. In the case of freeze-thaw, the deformation of rock mass is greatly affected by the freeze-thaw cycle. With the increase in freeze-thaw times, the failure modes of rock mass are different. The deformation of unfrozen and thawed rock mass is small, mainly manifesting as a small deformation at the slope. With the increasing number of freeze-thawing times, the slope deformation becomes larger and larger, and the deformation framework becomes more complex. The slope has been unstable after 100 freeze-thawing times.
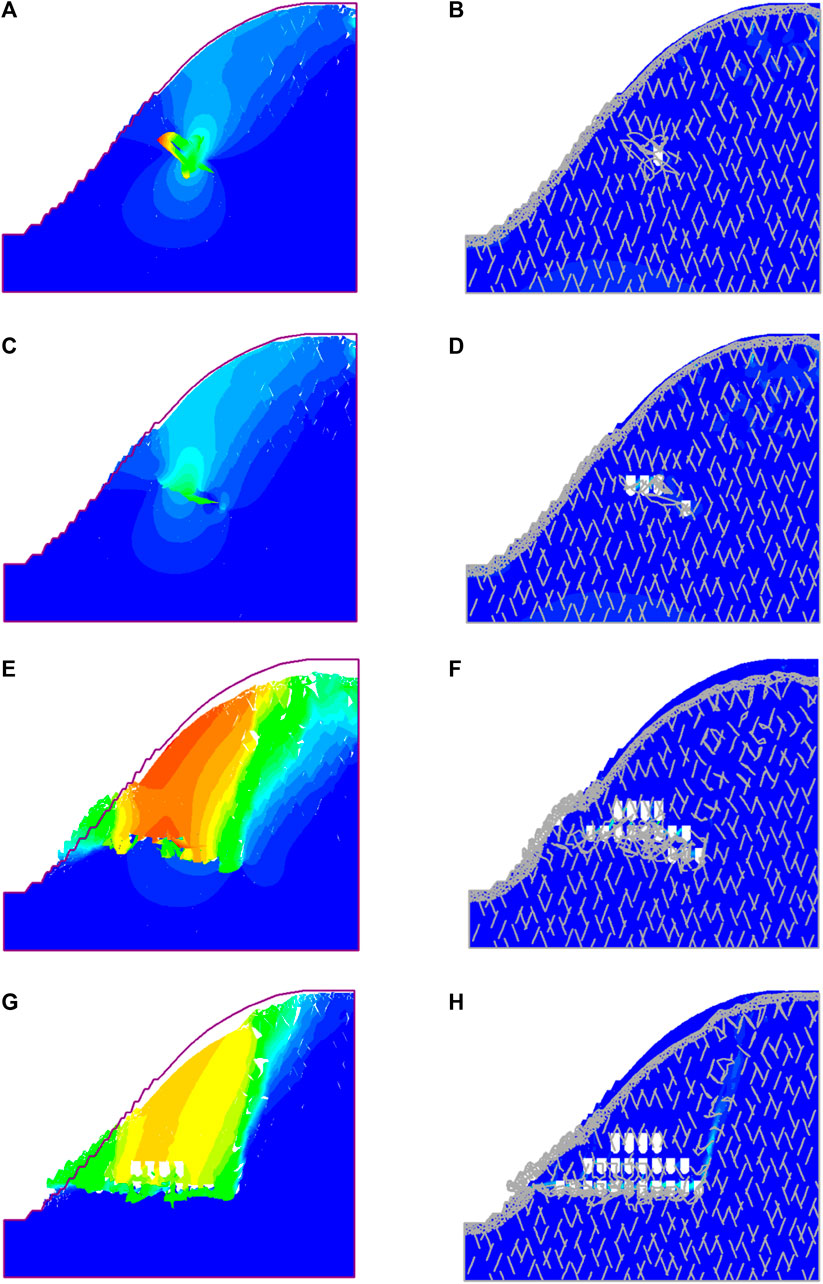
FIGURE 15. Deformation cloud map of the model at different excavation stages. (A) Deformation contour during excavation in 2016. (B) Deformation contour during excavation in 2016. (C) Deformation cloud map during excavation in 2018. (D) Deformation contour during excavation in 2018. (E) Deformation contour during excavation in 2020. (F) Deformation contour during excavation in 2020. (G) Deformation contour during excavation in 2023. (H) Deformation contour during excavation in 2023.
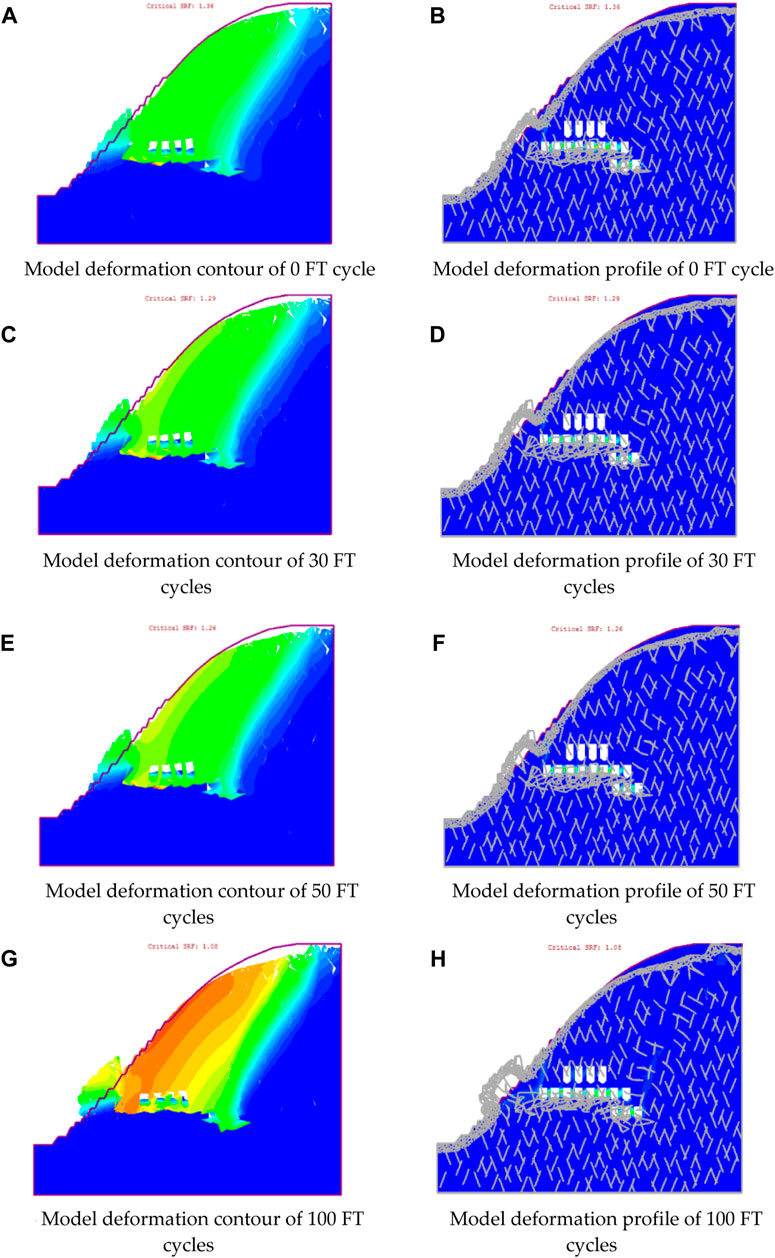
FIGURE 16. Cloud map of rock mass deformation under different freeze-thaw times. (A) Model deformation contour of 0 FT cycle. (B) Model deformation profile of 0 FT cycle. (C) Model deformation contour of 30 FT cycles. (D) Model deformation profile of 30 FT cycles. (E) Model deformation contour of 50 FT cycles. (F) Model deformation profile of 50 FT cycles. (G) Model deformation contour of 100 FT cycles. (H) Model deformation profile of 100 FT cycles.
According to different excavation stages of hang-wall for mine stress, displacement, shear strain, and the yield unit and joint changes, the trend of the overall destruction of rock mass at a glance, excavation will cause internal thickening of unloading rock mass effect occurred frequently, the mined-out area gradually expanded, will result in rock mass deformation and destruction shall be to stress, displacement, shear strain in the process of the excavation area, great changes have taken place in various parameters, such as Monitoring and prevention in advance. In the case of freeze-thaw, the deformation and failure of rock mass are significantly affected by freeze-thaw, and the internal pores and cracks will gradually be connected, the stable performance of rock mass is influenced obviously. The model with the maximum number of freeze-thaw under the same excavation condition has the largest deformation, which is consistent with the changing trend of volume strain in the previous rock test.
Finally, through the numerical model, the strength reduction method is used to calculate the safety factor of the slope model under different freeze-thaw times, and the slope stability is quantitatively analyzed. The relationship between the model strength reduction coefficient and maximum displacement under different freeze-thaw cycles is shown in Figure 17. Finally, the safety and stability coefficients of rock mass under 0, 30, 50, and 100 freeze-thaw times are 1.36, 1.29, 1.26, and 1.08, respectively. The safety factor can reflect the stability of the slope, and the above changes indicate that the stability of the slope rock mass decreases with the increase in freeze-thaw times.
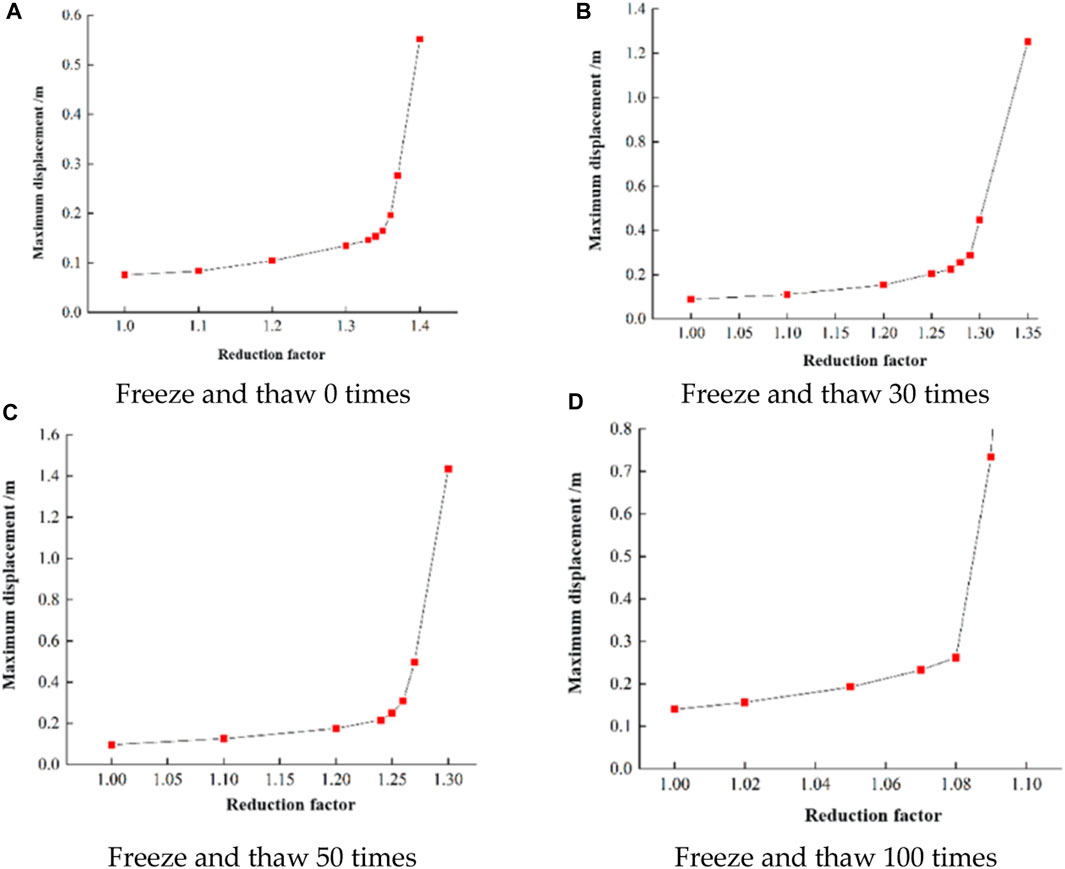
FIGURE 17. The relationship between stability coefficient and maximum displacement under different freeze-thaw cycles. (A) Freeze and thaw 0 times. (B) Freeze and thaw 30 times. (C) Freeze and thaw 50 times. (D) Freeze and thaw 100 times.
In this work, based on the eastern hanging-wall orebody of the Hejing iron mine in Xinjiang, a systematic study was conducted on the distribution of rock mass structural plane information and the slope stability analysis under the disturbance of freeze-thaw rock mass excavation by adopting the comprehensive methods of field investigation and numerical simulation. The main conclusions are as follows:
(1) 3D laser scanning is adopted to obtain the point cloud data of the open-pit slope. By getting the point cloud data grid, intelligent identification of the rock mass structure plane information was investigated to propose the image segmentation algorithm The K-means clustering analysis method was used to divide the structural plane information, and the spacing and equivalent trace lengths of the structural plane were obtained. The average attitude of the three groups of structural planes was determined to be 237° < 69°, 290° < 70°, and 252° < 34°; the average spacing was 0.223, 0.699, and 0.481; and the equivalent trace length was 0.688, 1.140, and 0.784, respectively. The number of joints per unit area of the rock mass structural plane is 0.111, 0.034, and 0.020, respectively.
(2) A numerical model considering the joint distribution is established for the eastern hang-wall orebody of the open-pit slope. The generalized Hoek-Brown criterion equation and Barton-Bandis criterion equation are used to calculate the shear strength of the rock block and joint plane, respectively, and the impact of hanging-wall mining engineering on the disaster of the rock mass structural plane is analyzed. The simulation results show that the gradual increase in the goaf area will destroy the stability of the rock mass; the roof area of the mine and the preserved pillar area have frequent load increasing and unloading behaviors, and the stress change area has large displacement and deformation.
(3) The strength reduction method is used to calculate the safety factor of rock mass at the current excavation stage, and the deformation development caused by 0, 30, 50, and 100 freeze-thawing cycles on the rock mass excavation project is analyzed. The results show that the rock mass displacement, strain, and plasticity zone all increase after freeze-thaw weathering. The slope stability coefficient decreases sharply under high freeze-thaw cycles; in addition, excavation of orebody causes stress and strain concentration which accelerates rock deformation.
The original contributions presented in the study are included in the article/supplementary material, further inquiries can be directed to the corresponding author.
YW supervised the study, acquired the funding, and administered the project. YZ conducted the laser scanning and analyzed the data. JW conducted the experiments. PT visualized the study, curated the data, and provided the resources. All authors contributed to the article and approved the submitted version.
This research was funded by the Shenyang Science and Technology Talent Project (RC220450), the Geological Survey Project of CGS (DD20230437), and the National Natural Science Foundation of China (52174069).
The authors declare that the research was conducted in the absence of any commercial or financial relationships that could be construed as a potential conflict of interest.
All claims expressed in this article are solely those of the authors and do not necessarily represent those of their affiliated organizations, or those of the publisher, the editors and the reviewers. Any product that may be evaluated in this article, or claim that may be made by its manufacturer, is not guaranteed or endorsed by the publisher.
Bai, B., Nie, Q., Zhang, Y., Wang, X., and Hu, W. (2021a). Cotransport of heavy metals and SiO2 particles at different temperatures by seepage. J. Hydrology 597, 125771. doi:10.1016/j.jhydrol.2020.125771
Bai, B., Rao, D., Chang, T., and Guo, Z. (2019). A nonlinear attachment-detachment model with adsorption hysteresis for suspension-colloidal transport in porous media. J. Hydrology 578, 124080. doi:10.1016/j.jhydrol.2019.124080
Bai, B., Zhou, R., Cai, G., Hu, W., and Yang, G. (2021b). Coupled thermo-hydro-mechanical mechanism in view of the soil particle rearrangement of granular thermodynamics. Comput. Geotechnics 137, 104272. doi:10.1016/j.compgeo.2021.104272
Battulwar, R., Zare-Naghadehi, M., Emami, E., and Sattarvand, J. (2021). A state-of-the-art review of automated extraction of rock mass discontinuity characteristics using three-dimensional surface models. J. Rock Mech. Geotechnical Eng. 13 (4), 920–936. doi:10.1016/j.jrmge.2021.01.008
Chen, L., Zhao, X., Liu, J., Ma, H., Wang, C., Zhang, H., et al. (2023). Progress on rock mechanics research of Beishan granite for geological disposal of high-level radioactive waste in China. Rock Mech. Bull. 2 (3), 100046. doi:10.1016/j.rockmb.2023.100046
Du, J. C. (2013). Study on surrounding rock stability of Hanging wall Mine under high and steep slope based on FLAC3D. Technol. Innov. Appl. (12), 2-3.
Fakhri, D., Mahmoodzadeh, A., Mohammed, A. H., Khodayari, A., Ibrahim, H. H., Rashidi, S., et al. (2023). Forecasting failure load of Sandstone under different Freezing-Thawing cycles using Gaussian process regression method and grey wolf optimization algorithm. Theor. Appl. Fract. Mech. 125, 103876. doi:10.1016/j.tafmec.2023.103876
Fekete, S., and Diederichs, M. (2013). Integration of three-dimensional laser scanning with discontinuum modelling for stability analysis of tunnels in blocky rockmasses. Int. J. Rock Mech. Min. Sci. 57, 11–23. doi:10.1016/j.ijrmms.2012.08.003
Fekete, S., Diederichs, M., and Lato, M. (2010). Geotechnical and operational applications for 3-dimensional laser scanning in drill and blast tunnels. Tunn. Undergr. space Technol. 25 (5), 614–628. doi:10.1016/j.tust.2010.04.008
Forte, G., Verrucci, L., Di Giulio, A., De Falco, M., Tommasi, P., Lanzo, G., et al. (2021). Analysis of major rock slides that occurred during the 2016–2017 Central Italy seismic sequence. Eng. Geol. 290, 106194. doi:10.1016/j.enggeo.2021.106194
Ge, Y. F., Tang, H. M., Huang, L., Wang, L. Q., Sun, M. J., and Fan, Y. J. (2012). A new representation method for three-dimensional joint roughness coefficient of rock mass discontinuities. Chin. J. Rock Mech. Eng. 31 (12), 2508–2517.
Ghobadi, M. H., and Babazadeh, R. (2015). Experimental studies on the effects of cyclic freezing–thawing, salt crystallization, and thermal shock on the physical and mechanical characteristics of selected sandstones. Rock Mech. Rock Eng. 48, 1001–1016. doi:10.1007/s00603-014-0609-6
Gigli, G., and Casagli, N. (2011). Semi-automatic extraction of rock mass structural data from high resolution LIDAR point clouds. Int. J. rock Mech. Min. Sci. 48 (2), 187–198. doi:10.1016/j.ijrmms.2010.11.009
Huang, F., Teng, Z., Guo, Z., Catani, F., and Huang, J. (2023). Uncertainties of landslide susceptibility prediction: Influences of different spatial resolutions, machine learning models and proportions of training and testing dataset. Rock Mech. Bull. 2 (1), 100028. doi:10.1016/j.rockmb.2023.100028
Kocak, D. M., Caimi, F. M., Das, P. S., and Karson, J. A. (1999). “A 3-D laser line scanner for outcrop scale studies of seafloor features,” in Proccedings of the Oceans' 99. MTS/IEEE. Riding the Crest into the 21st Century. Conference and Exhibition. Conference Proceedings (IEEE Cat. No. 99CH37008), Seattle, WA, USA, Septembe 1999 (IEEE), 1105–1114.
Lato, M. J., and Vöge, M. (2012). Automated mapping of rock discontinuities in 3D lidar and photogrammetry models. Int. J. rock Mech. Min. Sci. 54, 150–158. doi:10.1016/j.ijrmms.2012.06.003
Liu, F. Q., and Zeng, W. Z. (2020). Mining methods and stability measures of the mining of the lower hanging side of high and steep slope. World Nonfer. Metals (02), 46–47.
Maerz, N. H., Youssef, A. M., Otoo, J. N., Kassebaum, T. J., and Duan, Y. E. (2013). A simple method for measuring discontinuity orientations from terrestrial LIDAR data. Environ. Eng. Geoscience 19 (2), 185–194. doi:10.2113/gseegeosci.19.2.185
Menegoni, N., Giordan, D., Perotti, C., and Tannant, D. D. (2019). Detection and geometric characterization of rock mass discontinuities using a 3D high-resolution digital outcrop model generated from RPAS imagery – ormea rock slope, Italy. Italy. Eng. Geol. 252, 145–163. doi:10.1016/j.enggeo.2019.02.028
Shang, J. (2022). Stress path constraints on veined rock deformation. Rock Mech. Bull. 1 (1), 100001–100112. doi:10.1016/j.rockmb.2022.100001
Slob, S., van Knapen, B., Hack, R., Turner, K., and Kemeny, J. (2005). Method for automated discontinuity analysis of rock slopes with three-dimensional laser scanning. Transp. Res. Rec. 1913 (1), 187–194. doi:10.1177/0361198105191300118
Song, Y., Tan, H., Yang, H., Chen, S., Che, Y., and Chen, J. (2021). Fracture evolution and failure characteristics of sandstone under freeze-thaw cycling by computed tomography. Eng. Geol. 294, 106370. doi:10.1016/j.enggeo.2021.106370
Tuckey, Z., and Stead, D. (2016). Improvements to field and remote sensing methods for mapping discontinuity persistence and intact rock bridges in rock slopes. Eng. Geol. 208, 136–153. doi:10.1016/j.enggeo.2016.05.001
Wang, Y., Yan, M. Q., and Song, W. B. (2023a). The effect of cyclic stress amplitude on macro-meso failure of rock under triaxial confining pressure unloading. Fatigue & Fract. Eng. Mater. Struct. 45 (10), 2212–2228. doi:10.1111/ffe.13993
Wang, Y., Cao, Z., Li, P., and Yi, X. (2023b). On the fracture and energy characteristics of granite containing circular cavity under variable frequency-amplitude fatigue loads. Theor. Appl. Fract. Mech. 125, 103872. doi:10.1016/j.tafmec.2023.103872
Wang, Y., Song, Z. Y., Mao, T. Q., and Zhu, C. (2022). Macro–Meso fracture and instability behaviors of hollow-cylinder granite containing fissures subjected to freeze–thaw–fatigue loads. Rock Mech. Rock Eng. 55, 4051–4071. doi:10.1007/s00603-022-02860-5
Xu, Y., Fu, Y., Yang, Y., Yao, W., Xia, K., and Peng, J. (2023). Dynamic compression properties of a saturated white sandstone under ambient sub-zero temperatures. Acta Geotech. 18, 4245–4260. doi:10.1007/s11440-023-01836-1
Keywords: freeze-thaw weathering, 3D laser scanning, hang-wall mining, intelligent recognition, stability predication
Citation: Zhang Y, Wu J, Tang P and Wang Y (2023) Three-dimensional laser scanning and numerical investigation on the influence of freeze-thaw and hang-wall mining on the instability of an open-pit slope. Front. Mater. 10:1242764. doi: 10.3389/fmats.2023.1242764
Received: 19 June 2023; Accepted: 20 July 2023;
Published: 04 August 2023.
Edited by:
Xianze Cui, China Three Gorges University, ChinaReviewed by:
Zhiheng Zhao, Petrochina Southwest Oil and Gas Field Company, ChinaCopyright © 2023 Zhang, Wu, Tang and Wang. This is an open-access article distributed under the terms of the Creative Commons Attribution License (CC BY). The use, distribution or reproduction in other forums is permitted, provided the original author(s) and the copyright owner(s) are credited and that the original publication in this journal is cited, in accordance with accepted academic practice. No use, distribution or reproduction is permitted which does not comply with these terms.
*Correspondence: Yu Wang, d3l6aG91QHVzdGIuZWR1LmNu
Disclaimer: All claims expressed in this article are solely those of the authors and do not necessarily represent those of their affiliated organizations, or those of the publisher, the editors and the reviewers. Any product that may be evaluated in this article or claim that may be made by its manufacturer is not guaranteed or endorsed by the publisher.
Research integrity at Frontiers
Learn more about the work of our research integrity team to safeguard the quality of each article we publish.