 Yihui Zhang1
 Xuewei Fang
95% of researchers rate our articles as excellent or good
Learn more about the work of our research integrity team to safeguard the quality of each article we publish.
Find out more
ORIGINAL RESEARCH article
Front. Mater. , 19 July 2023
Sec. Structural Materials
Volume 10 - 2023 | https://doi.org/10.3389/fmats.2023.1211648
This article is part of the Research Topic Recent Advances of Metal Additive Manufacturing in Aerospace View all 4 articles
Electron beam selective melting (EBSM) has emerged as a promising technology for additive manufacturing (AM) of superalloys. In this study, a comprehensive multi-physics model is developed to analyze the molten pool flow behavior and influencing factors in the EBSM process. The discrete element method (DEM) and volume of fluid (VOF) method are employed to establish the powder bed model and track the solid-liquid free surface, respectively. The results reveal that the molten pool exhibits a conduction mode characterized by a large width-to-depth ratio driven by the Marangoni effect. Internal vortices cause the molten pool to expand even after the scan ends. The ambient pressure, in comparison to the preheat temperature, has a significant impact on vapor recoil and consequently affects the surface quality of the molten pool. Moreover, a large hatch distance results in cracks and porous morphological features on the surface of the samples. These findings demonstrate the effectiveness of numerical simulations in providing detailed insights into the EBSM process of the IN738 superalloy material.
Electron beam selective melting (EBSM) is a powder bed fusion technique based on discrete stacking. It utilizes an electron beam as a heat source to melt metal powder and create parts. Unlike other additive manufacturing (AM) technologies, EBSM is typically conducted in a vacuum environment with high preheating temperatures. This approach reduces the residual stress in the parts. EBSM offers several advantages, including fast molding speed, high efficiency, optimal energy utilization, and excellent mechanical properties of the molded parts. As a result, it finds extensive applications in aerospace, biomedical, and other industries (Al-Bermani et al, 2010) (Murr et al, 2010) (Tan et al, 2015). However, despite its many benefits, EBSM encounters issues during the production process, such as spattering, balling, unfusion, and cracking, which ultimately impact the final product quality (Tumbleston et al, 2015). Due to the closed high-temperature vacuum chamber and the rapid movement of the electron beam during printing, explaining the complex physical phenomena and the swift evolution of thermal behavior in EBSM using experimental methods proves challenging.
The advent of computational materials science has led to the widespread use of numerical simulation in the field of AM. Numerous studies have emphasized the importance of numerical simulation in understanding and optimizing the EBSM process (Qi et al, 2007) (Zäh and Lutzmann, 2010) (Cheng and Chou, 2013) (Wang et al, 2015) (Shen and Chou, 2012) (Riedlbauer et al, 2017). Nevertheless, conventional constitutive equations fail to accurately describe the intricate physical processes of AM at the macroscopic scale. Consequently, computational fluid dynamics (CFD) simulations must be extended to the mesoscale to achieve a more precise comprehension of the EBSM process. Generally, CFD simulations encompass solving nonlinear partial differential equations that govern the conservation of mass, momentum, and energy. These simulations extensively cover hydrodynamic effects (Khairallah et al, 2016) (Körner et al, 2011). Despite their high computational cost, CFD simulations provide a more realistic temperature history, thereby facilitating a better understanding of molten pool dynamics, solidification organization, and thermal stresses.
The forming quality of a single track is critical as it directly impacts the final surface quality and mechanical properties of the part. In a single track, fluid flow is associated with the formation of various defects, necessitating the study of fluid flow behavior and its influencing factors. Yan et al. (Yan et al, 2018) proposed a multi-physics field coupling algorithm for simulating balling and unevenness phenomena in Ti-6Al-4V single track molding. Lee et al. (Lee and Zhang, 2016) investigated the heat and mass transfer process of the IN718 alloy powder bed under the influence of a laser heat source. The results revealed a depressed area at the front of the recoil pressure and the flow of the molten pool to the back surface due to the Marangoni effect. Zhao et al (Zhao et al, 2019) examined the flow behavior of the EBSM molten pool and the solidification conditions of the Co-Cr-Mo alloy. Their study indicated that active fluid convection at the solidification front increased the likelihood of new grain formation while inhibiting the epitaxial growth of columnar grains.
To date, simulations of EBSM have primarily focused on Ti-6Al-4V and IN718, with limited studies exploring other alloys, especially at the mesoscopic scale. The understanding of molten pool flow behavior and influencing factors for superalloy powders during the EBSM process remains insufficient. IN738 is a precipitation strengthened superalloy which is conventionally processed by casting. Due to its superior high temperature performances, IN738 is the most commonly used material for high pressure turbine since developed. Nevertheless, the higher Aluminum and Titanium contents make IN738 more prone to defects formation during rapid melting and solidification by EBSM compared with other Nickle-based superalloys. To eliminate the defects in the process of IN738 EBSM, researchers investigated the mechanism and variation of melting and solidification process of IN738 with different process parameters. However, the process window for IN738 is narrow and the cost of extensive trial-and-error experiments is very high. Therefore, it is valuable to investigate the molten pool flow and effects through numerical methods.
This study aims to address this gap by developing a 3D transient mesoscopic model that predicts the thermal behavior, flow mechanism of the molten pool, and the formation of melted tracks during the EBSM process of the IN738 superalloy. The simulation incorporates a 3D Gaussian packed powder bed composed of spherical particles, created using the discrete element method (DEM), which considers the individual effects of powder particles. Additionally, volume shrinkage and temperature-dependent thermal physical parameters are considered. The tracking of the solid-liquid free surface is achieved using the volume of fluid (VOF) method. Furthermore, experimental investigations are conducted to examine the morphology of single and double tracks under different processing parameters. These experiments serve to verify the feasibility and reliability of the developed model.
The 3D transient simulation of the molten pool for IN738 particles involved three key steps: powder falling, spreading, and melting. These individual steps were addressed using two commercial software packages, namely, EDEM for powder falling and spreading, and FLOW-3D for the melting process.
The DEM was employed to construct the single-layer powder bed model. To achieve a more precise particle model, the morphological parameters of the powder were analyzed using both scanning electron microscopy (SEM) and laser granulometry. The IN738 powder utilized in this study was pre-alloyed and provided by the China Iron and Steel Research Institute Group. It was produced through a combination of vacuum induction melting and gas atomization with argon (Ar). The as-received powder exhibited predominantly spherical particles with numerous satellites, as depicted in Figure 1.
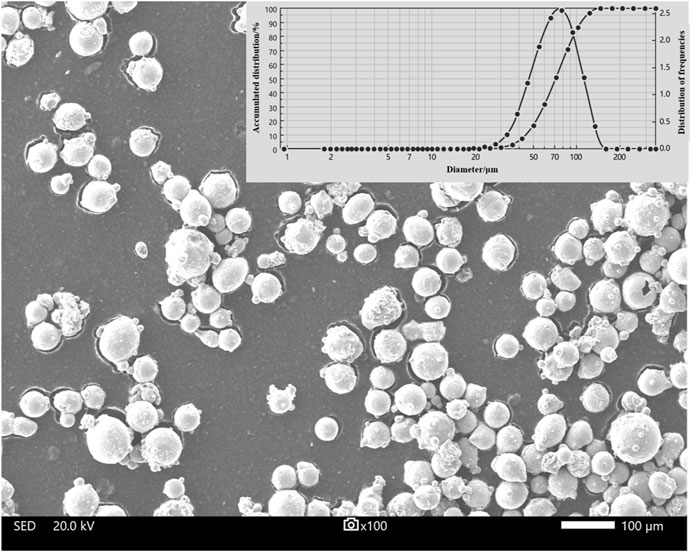
FIGURE 1. SEM morphology and particle size distribution of IN738 powder.
The particle model consisted of spherical particles with diameters distributed in a Gaussian fashion between 45 μm and 105 μm. The translational and rotational motions of individual powder particles can be described by Newton’s second law of motion:
Where
To simulate the contact between particles, the Hertz-Mindlin soft-contact model (Xiang et al, 2016) was employed. This model permits overlapping at the contact point to simplify elastic deformation, as illustrated in Figure 2A. In this model, the normal contact force
where
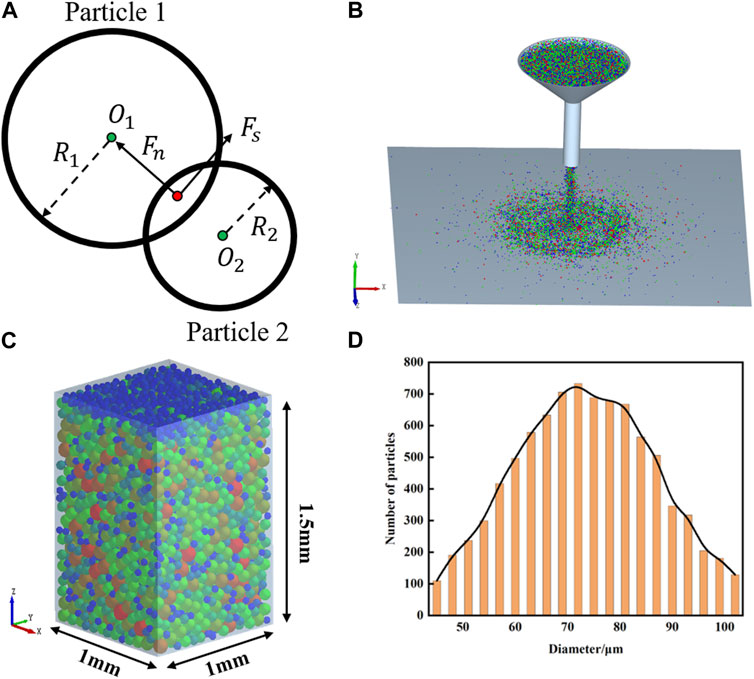
FIGURE 2. (A) The physics of particles contact. (B) The static repose angle model. (C) The tap density model, in which different colors represent different particle sizes. (D) The particle size distribution is approximately Gaussian distribution.
When the particle size is below 100 μm, in addition to contact forces, Van der Waals forces (i.e., cohesion force
where
To validate the accuracy of the model, the static repose angle was measured by the injection method and compared with experimental data. Figure 2B shows the model of the simulation. The particles were color-coded to represent different sizes, with red indicating the largest particles and blue representing the smallest ones. To reduce the computational effort, the whole model was reduced in equal scale. A funnel with a diameter of 8 mm was filled with particles, which accumulate on a plane 10 mm from the bottom of the funnel under the effect of gravity. To minimize errors, the simulations and experiments were each carried out three times and averaged. Finally, the static repose angles measured by simulation and experiment are 32°and 34 respectively, with an error of 5.8%.
Subsequently, the simulated and experimental tap densities were compared. For this purpose, a rectangular container measuring 1 × 1 × 1.5 mm was filled with model particles. The container was then subjected to vibration at a frequency of 250 times per minute for a duration of 12 min, as depicted in Figure 2C. Table 1 lists the values of parameters employed in the simulations.
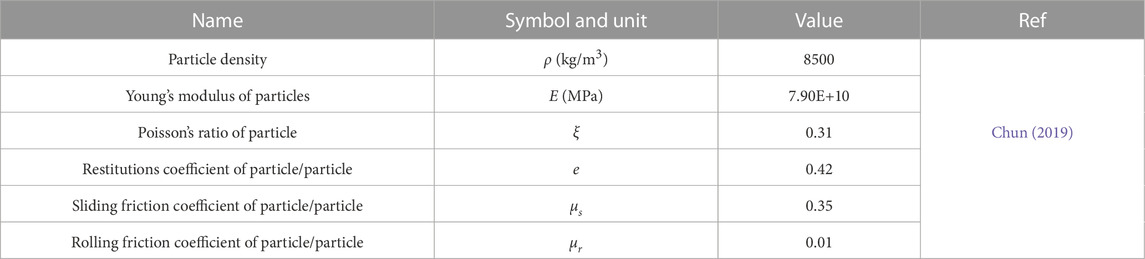
TABLE 1. The values of variables considered in the simulations.
The tap density
where M is the total mass of particles in the container,
The powder bed model was established in two distinct steps: powder falling and spreading. Initially, over 10,000 particles were generated approximately 2.5 mm above the substrate and allowed to fall freely under the influence of gravity, accumulating on the surface of the substrate. This resulting powder bed model is depicted in Figure 3A. It is worth noting that the height of the stacked particles exceeds the thickness of the printed layer, set at 100 μm in this case.
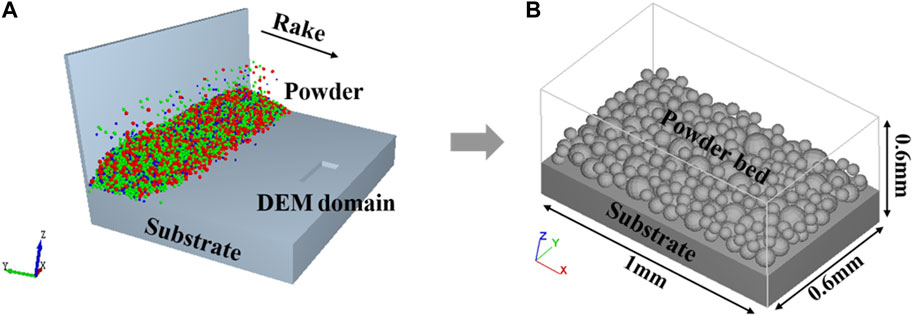
FIGURE 3. (A) The powder spreading model and (B) The computational domain model.
On the other side of the substrate, a DEM domain was employed to contain the powder bed model, as described in Section 2.2. Subsequently, a rigid rake was implemented to scrape and distribute all the particles within the domain, simulating the powder spreading process. The velocity of the rake was set at approximately 200 mm/s, consistent with that employed in the actual EBSM process.
The computational domain dimensions were defined as follows: 1000 μm in length (X direction), 600 μm in width (Y direction), and 600 μm in height (Z direction). A rectangular substrate with an equivalent surface area was created beneath the powder bed model, and its height was set at 300 μm, as depicted in Figure 3B.
For a typical simulation case in this study, approximately 2.69 million cells were generated using a finer mesh size of 5 μm. A mesh convergence test was performed to ensure that the model was not sensitive to the mesh.
The simulations were executed on a workstation equipped with an Intel® Xeon® Gold 6226 R processor and 128 GB of RAM. It required approximately 168 h of CPU clock time to complete the calculation of a physical process that lasted 6 ms.
The EBSM is a complex fluid dynamics process, involving the heating, melting, flow, evaporation, and solidification of powders. The molten metal is assumed to be an incompressible Newtonian fluid throughout the simulation. Generally, the dynamic flow field within the molten pool is governed by Navier-Stokes and energy equations, which can be expressed as follows:
where
The position of the free surface between the void and the molten pool was tracked using the VOF method. The VOF function, originally derived by Hirt and Nichols (Hirt and Nichols, 1981), is defined by Eq. (9):
where F is the fluid volume function, which represents the fraction of the volume fraction of the liquid metal filled in the cell.
As discussed earlier, EBSM is a complex process that involves multiple factors, including the input of electron beam, heat absorption by the powder bed, heat dissipation through radiation, and heat carried away by melt evaporation. The heat input from the electron beam, which is applied to the top free surface of the powder layer, is modeled as a Gaussian distribution across the surface.
where
Because the EBSM process takes place in a high vacuum environment (0.1 Pa), heat convection loss is negligible. Therefore, only heat loss from thermal radiation and evaporation need to be considered in the simulation. The thermal radiation is governed by the Stefan-Boltzmann law:
where
During the EBSM process, the surface temperature of the molten pool can reach the boiling temperature of the material. As a result, the metal vapor carries away a portion of the heat and exerts recoil pressure on the molten pool. The heat loss of the metal vapor can be described as follows (Cho et al, 2009):
where M is the molar mass, R is the universal gas constant,
where
In order to accurately solve the fluid flow, this simulation considers two main driving forces. The first force is the Marangoni shear stress induced by the temperature-dependent surface tension force:
where
The second force is the recoil pressure caused by metal material evaporation and is expressed in Eq. (15):
where
The physical properties of IN738 superalloy and the coefficients/constants used in the simulation are listed in Table 2. The temperature-dependent material properties, including thermal conductivity, specific heat (Yann et al, 2010) (Kerrouault, 2000), density (Chapman et al, 2008), viscosity and surface tension (Aune et al, 2005), are illustrated in Figure 4.
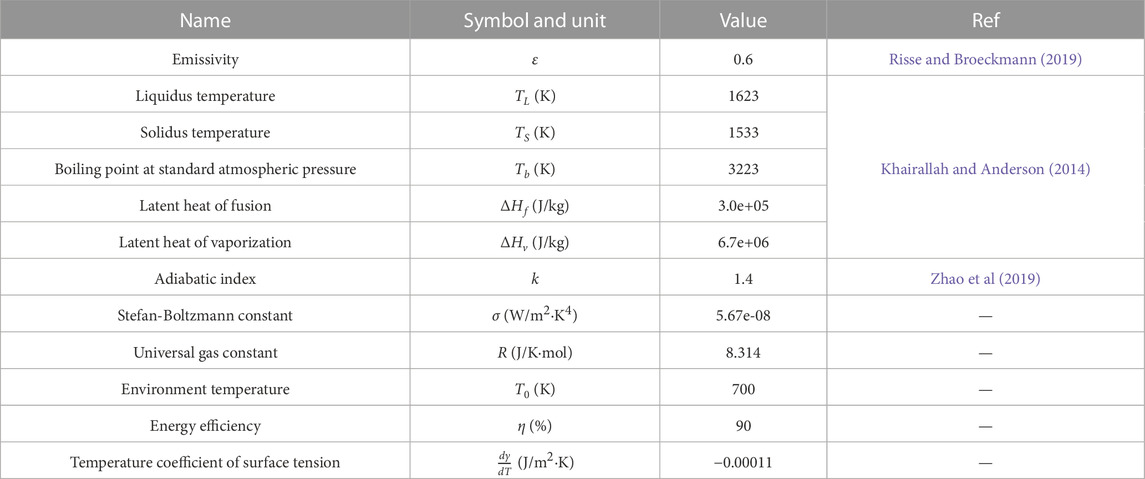
TABLE 2. Thermophysical properties of IN738 and coefficients and constants applied to the simulation.
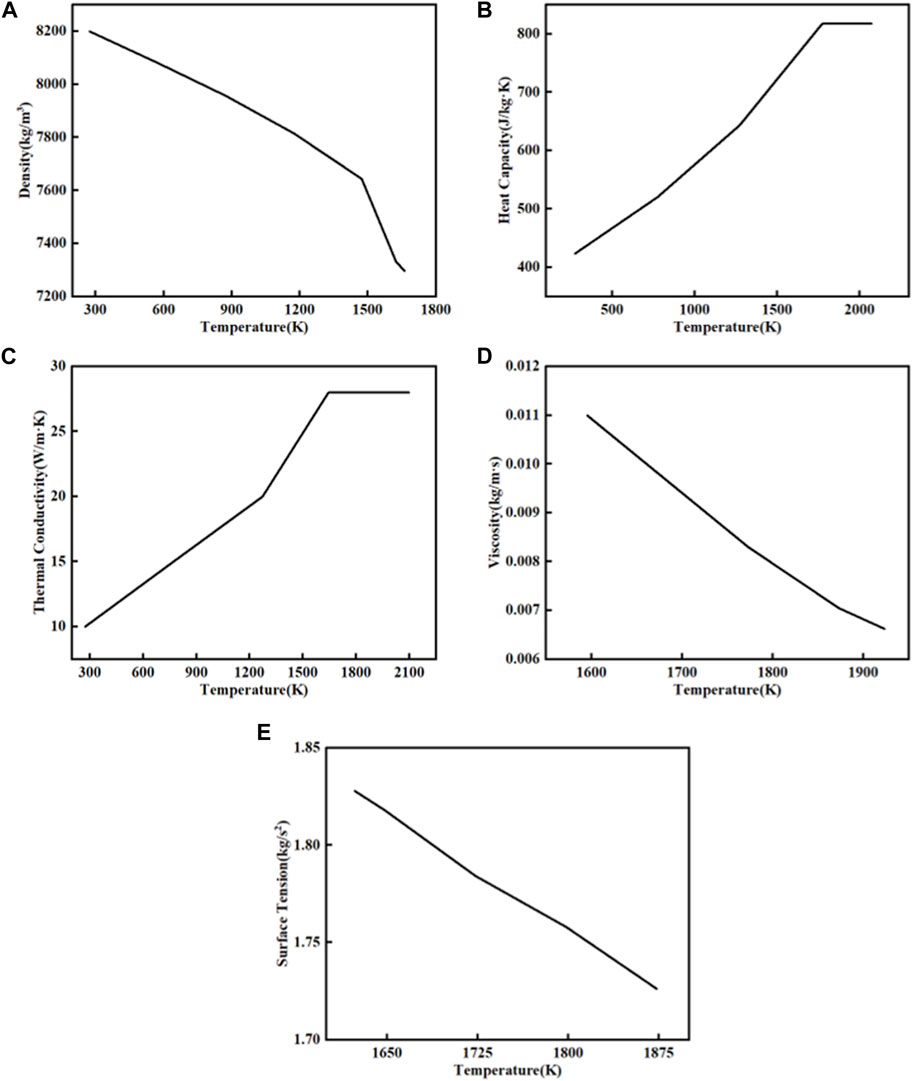
FIGURE 4. Temperature-dependent thermo-physical properties of IN738, (A) Density, (B) Heat capacity, (C) Thermal conductivity, (D) Viscosity and (E) Surface tension.
The powder melting model was validated through a series of experimental melting trials. Initially, a simple cubic coupon measuring 30 mm × 30 mm × 5 mm was built on a flat 316 L substrate using an Arcam® A2X machine. Single tracks were then constructed on the surface of the coupons, perpendicular to the direction of powder spreading. Subsequently, several cubic block samples with dimensions of 15 mm × 15 mm × 10 mm were produced to investigate the impact of hatch on the densification rate and surface roughness.
During the EBSM process, a vacuum pressure of 0.1 Pa was maintained within the process chamber, and the substrate was preheated to 1273 K, which represents the standard preheating temperature for the IN738 superalloy. The utilized power (p) was calculated as the product of the acceleration voltage (60 kV) and beam current. The specific process parameters employed in the experiments are detailed in Table 3.
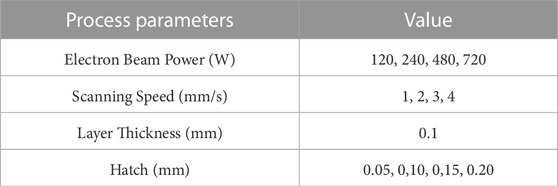
TABLE 3. Combinations of processing parameters.
To examine the morphology and profile of the melt track, a digital microscope (KEYENCE, VHX-950F, Japan) was utilized. The method employed for measurement is illustrated in Figure 5. The samples were prepared by wire-cutting perpendicular to the scanning direction, followed by grinding and polishing using standard metallographic techniques. The surface topography of the samples was then assessed using a laser confocal scanning microscope (LSCM, Smartproof 5, Zeiss), and the surface roughness was expressed as Sa. Furthermore, the densities of the samples were measured using the Archimedes method.
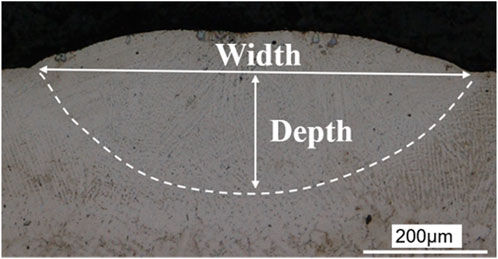
FIGURE 5. Method of determining dimensions.
Figure 6 illustrates the temperature fields and time-dependent morphology of the molten pool during single track scanning at p = 300 W and v = 1.0 m/s. The computational domain is divided along the X-Z plane at the center of the track, revealing the temperature profile across the substrate. The molten pool is represented by the red region, which encompasses temperatures at or above the liquidus temperature (
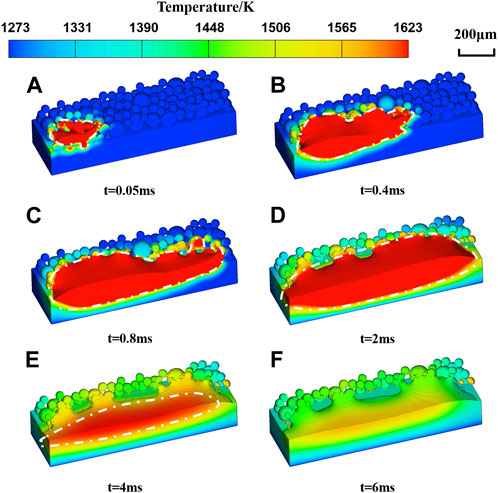
FIGURE 6. Temperature fields and morphologies of molten pool during scanning, (A) t = 0.05 ms, (B) t = 0.4 ms, (C) t = 0.8 ms, (D) t = 2 ms, (E) t = 4 ms and (F) t = 6 ms. (X-Z symmetry section computational domain; Electron beam scanning from left to right).
In the initial stage (Figure 6A), the powder and substrate swiftly absorb energy from the high-speed electrons, reaching the melting point in a short duration. Subsequently, the powder and substrate melt and blend together, forming a molten pool with intricate flow patterns induced by Marangoni forces, recoil pressure, gravity, and buoyancy (Figure 6B). Toward the end of the scanning process (Figure 6C), the width and depth of the molten pool head exceed those of the tail due to heat accumulation. Subsequently, owing to the high surface tension and low viscosity of the liquid metal, the molten pool exhibits highly dynamic fluctuations, progressively melting the surrounding powder and expanding to its maximum volume (Figure 6D). Finally, as the temperature decreases, the molten pool solidifies, resulting in an irregular appearance (Figure 6F).
It is noteworthy that the melting and solidification process of the EBSM molten pool significantly differs from that of Selective Laser Melting (SLM). In SLM, the molten pool typically solidifies rapidly following the laser scan. However, in EBSM, the molten pool continues to expand for an extremely brief period after the scanning ends. This behavior primarily arises from the higher preheating temperature in EBSM, which enhances the material’s thermal conductivity (Leung et al, 2019). Additionally, the high energy density and absorption efficiency of the electron beam (up to 90%) (Boley et al, 2015), coupled with the absence of thermal convection loss, enable heat accumulation, facilitating the expansion of the molten pool.
Due to the random distribution of powder, the temperature field of the molten pool experiences unstable distribution during the EBSM process. Therefore, a probe point was selected (X = 400 μm, Y = 200 μm, Z located at the free surface) for observation within the melt pool. This point varies in the Z-axis with the free surface during melting and solidification accordingly. Figure 7 illustrates the variation of temperature (T), temperature gradient (G), and cooling rate (R) with time (t), where the scanning process occurs from 0 to 0.8 ms and the cooling process occurs from 0.8 to 6 ms. A negative cooling rate indicates the heating process, while a positive value represents the cooling process. The G and R can be expressed as Eqs 16, 17:
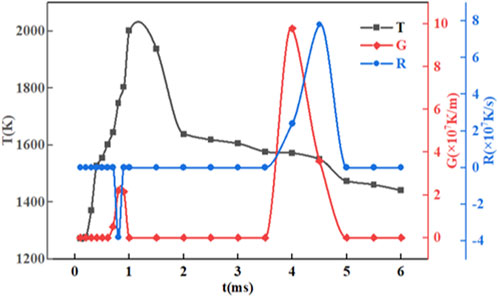
FIGURE 7. Variation of Temperature T, temperature gradient G and cooling rate R at probe point (X = 400 μm, Y = 200 μm, Z located at the free surface) with time t.
Where
During the scanning process, the temperature rises rapidly before melting, while G and R remain relatively low, ranging from approximately 10–8 to 10–6. As heat gradually transfers to the probe point, melting commences after the temperature surpasses the solidus temperature (
The flow behavior of the molten pool exhibits a similar trend to laser powder beds reported in the literature (Cheng et al, 2019) (Li et al, 2022), although they are not identical due to the large width/depth ratio in EBSM (Zhao et al, 2020). Figure 8 demonstrates the complex flow behavior of the molten pool in the YZ and XZ sections. As depicted in Figure 8A, under the influence of Marangoni convection, the molten pool at the surface is drawn toward the interior, resulting in clockwise or counterclockwise vortices. Although this flow pattern can lead to defects such as porosity, cracks, balling, and sputtering, it also facilitates the expansion of the molten pool into the surrounding area.
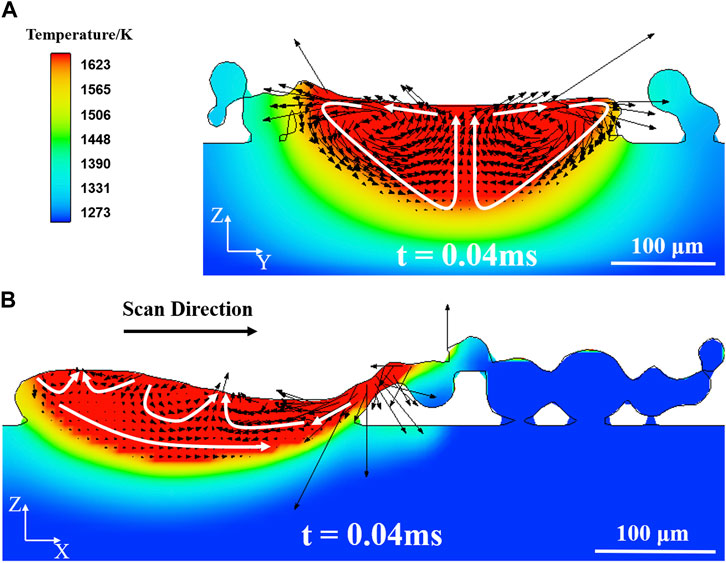
FIGURE 8. Molten pool flow behavior in YZ (A) and XZ (B) sections. The black arrows indicate the velocity vector. The schematic of the flow pattern is demonstrated by the white arrows.
Figure 8B illustrates the flow behavior along the scan direction. Due to surface tension, the molten liquid swiftly flows backward after the electron beam spot, encountering the re-solidification zone, and then reverses its direction to flow forward. Some of the forward-flowing liquid collides and rotates with the newly generated backward liquid in the central region of the molten pool, ultimately converging and flowing upward. Another portion flows forward along the bottom of the molten pool, filling the depressed area.
The flow behavior of the molten pool is a result of the combined effects of several forces, including surface tension, Marangoni force, vapor recoil pressure, and electron counter pressure, among others. According to a study by Zhao et al (Zhao et al, 2019), Marangoni convection primarily influences the profile and temperature distribution of the molten pool. Figure 9A illustrates the velocity distribution of the liquid metal during the scanning process (t = 0.75 ms). In the region where the electron beam impacts, the high-temperature gradient generates intense Marangoni convection, leading to rapid flow of the molten pool. Additionally, due to the irregular shape of the powder particles, the velocity at the edges of the molten pool is greater than that in the inner region. Figure 9B presents the variation of the central velocity
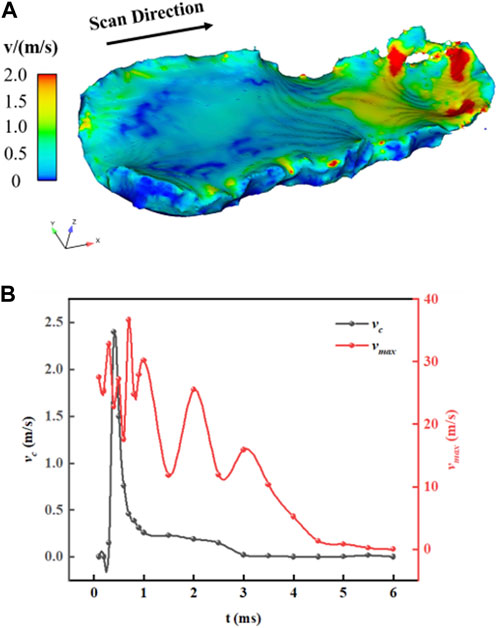
FIGURE 9. Velocity distribution of molten pool during scanning: (A) transient velocity distribution at t = 0.75 ms, (B) variation of the central velocity
In the actual production process, the vacuum environment of EBSM can reduce the interference of impurities in the gas with the high-speed electron beam. The high preheating temperature can pre-sinter the powder in advance and prevent powder smoke. Besides, during the interaction between the energy beam and the material, the keyhole formation is usually associated with the recoil pressure caused by the evaporation of the metal. The high vacuum environment within the EBM can significantly attenuate the effect of the vapor recoil pressure. Therefore, it is worthwhile to study the influence of ambient pressure on the keyhole and the molten pool flow. However, studying the effect of changing environmental conditions on the molten pool experimentally is difficult, and it is discussed next from the perspective of simulation.
Based on Section 4.1, simulations were performed for the no-preheat temperature (T = 300 K, Figure 10B) and standard atmospheric pressure (101,325 Pa, Figure 10C), respectively, by changing environmental conditions. It should be noted that, under standard atmospheric pressure, the substrate thickness was doubled to avoid being penetrated by the molten pool, which does not affect the heat transfer effect. As shown in Figure 10, the maximum temperature of the molten pool is above the material boiling point (
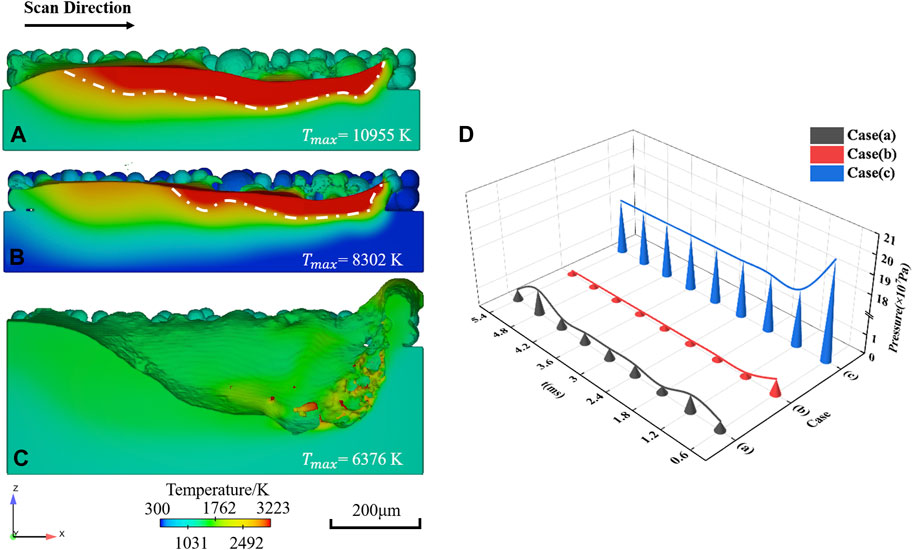
FIGURE 10. Effect of environmental conditions on molten pool morphology and temperature field. (A) Vacuum (0.1 Pa) with preheating (1273 K), (B) vacuum without preheating (300 K) and (C) standard atmospheric pressure (101,325 Pa) with preheating. (D) The pressure under different ambient conditions.
Increasing the preheating temperature can improve the thermal conductivity and thus the heat transfer efficiency of the electron beam-material interaction (Zhao et al, 2020). Therefore, increasing the preheating temperature facilitates the reduction of defects. Figure 10C shows the molten pool at standard atmospheric pressure (101,325 Pa) with preheating. According to Equation (13), vapor recoil pressure is highly dependent on atmospheric pressure. Low chamber pressure produces a feeble metal vapor recoil, and the evaporation has a weak counter-impact on the liquid surface. The high ambient pressure in case (c) significantly exacerbated the effect of the recoil pressure on the molten pool surface. Under standard atmospheric pressure, a depression appeared on the surface of the molten pool and deepened continuously. During the scanning process, spatter was generated, and the liquid metal fell onto the surrounding powder, leading to internal mass loss and surface irregularities in the molten pool. Due to the instability of the molten pool, the accumulated heat is effectively dissipated, and the instantaneous maximum temperature of the molten pool is much lower than that under vacuum conditions. The distribution of pressure on the molten pool during melting and solidification under the three environmental conditions is shown in Figure 10D. Under vacuum conditions, the pressure was kept below 107 Pa and was even lower without preheating. From Equation (13), the recoil pressure is also a function of temperature; therefore, a higher preheating temperature resulted in a higher recoil pressure. Under standard atmospheric pressure, the pressure was significantly higher, at least one order of magnitude greater than the pressure in vacuum. Because the ambient pressure is a critical factor in determining the vapor recoil pressure, the vacuum environment in EBSM not only enables the electron beam to avoid interference from impurities in the gas but also effectively suppresses defects.
In addition to environmental conditions, the influence of process parameters on the morphology and quality of the molten pool during formation cannot be overlooked. For a single track, the line energy density (
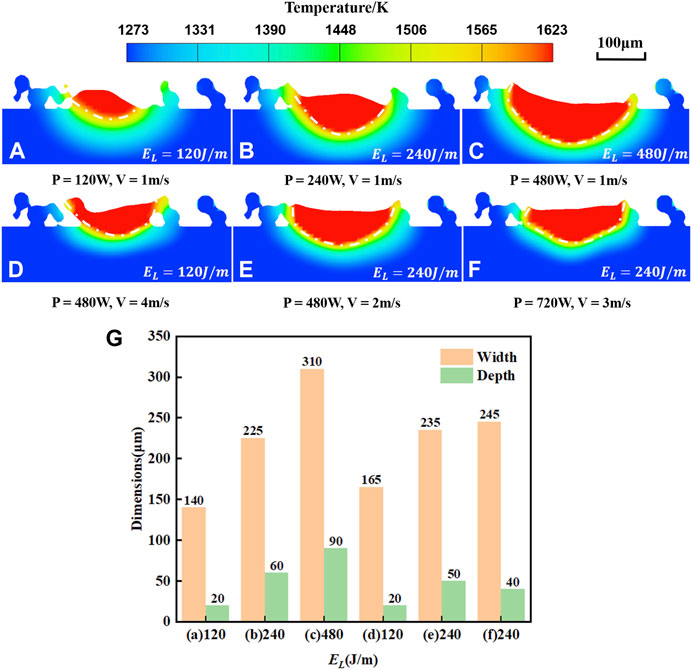
FIGURE 11. Cross-section view of the molten pool at different
Figures 11A–D, as well as E, C, represent cases where either the scanning speed or power is kept constant while
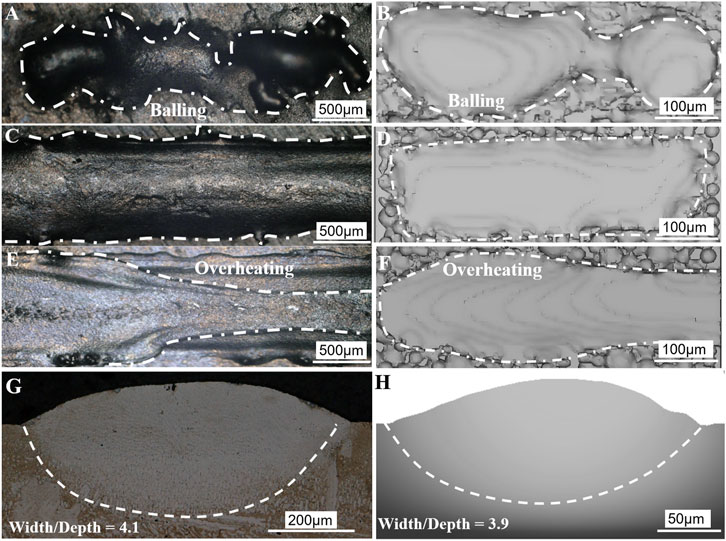
FIGURE 12. Surface morphologies of the melted tracks from experiments (left) and corresponding simulations (right) with different
Once the spot diameter has been determined (250 μm in the simulation), our main concern is to identify the
In addition to power and scanning velocity, hatch is another crucial process parameter. The heat source exhibits a wide variation in the horizontal direction, resulting in a density distribution of heat flow that prompts the molten pool morphology to display a deep middle and shallow ends trend horizontally. If the molten pool does not overlap sufficiently, gaps may appear between the solidified tracks, negatively impacting the final quality of the printed part. Therefore, proper overlap is essential in EBSM to ensure track continuity, prevent defects during solidification, and reduce cracks. In actual production, the hatch is consistently smaller than the beam spot to achieve well-formed parts. To investigate the effect of hatch, simulations were conducted with hatch sizes of 0.05 mm, 0.1 mm, 0.15 mm, 0.2 mm, 0.25 mm, and 0.3 mm, as shown in Figure 13. It was observed that when the hatch exceeded 0.15 mm, the melted region of the first track did not extend as much as the second track. The heat in the molten pool was insufficient to sustain its expansion, indicating the occurrence of solidification. As the hatch size continued to increase, a discontinuity appeared at the bottom of the molten pool until complete separation occurred at a hatch size of 0.3 mm. This significantly impacts the part’s quality and can even result in unsuccessful printing. Therefore, when aiming to achieve better fusion of multiple tracks, the hatch size should not be too large, as it would not significantly increase the processing time.
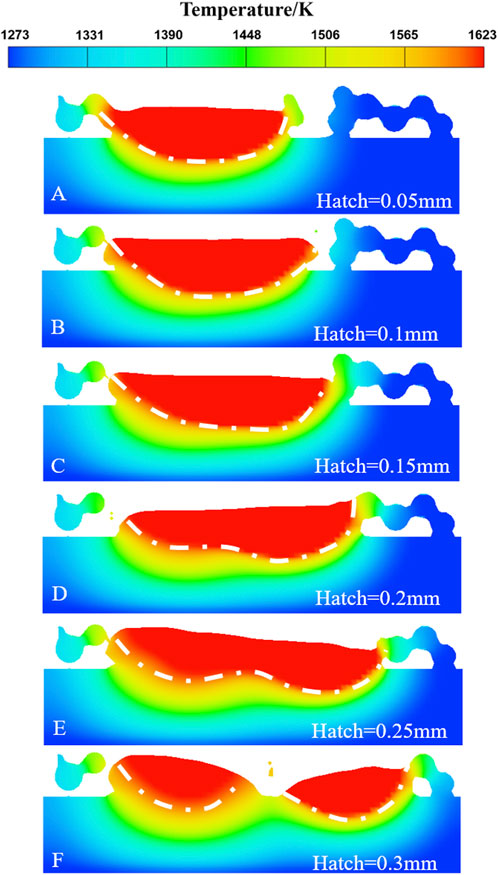
FIGURE 13. The fused zone with various hatch of (A) 0.05 mm, (B) 0.1 mm, (C) 0.15 mm, (D) 0.2 mm, (E) 0.25 mm and (F) 0.3 mm.
To further understand the impact of hatch size on part quality, several cuboid samples were produced with hatch sizes of 0.05 mm, 0.1 mm, 0.15 mm, and 0.2 mm under the same energy density. Figure 14 illustrates three-dimensional surface topographical images of these samples. The samples exhibited an uneven surface due to excessive melting under a hatch size of 0.05 mm. Excessive melting caused by overheating or slow heat dissipation leads to an oversized molten pool that persists for a prolonged period (Wits et al, 2016).
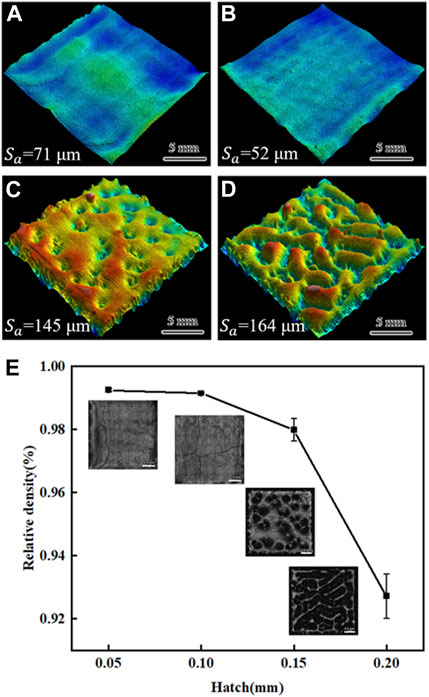
FIGURE 14. 3D surface topographical of samples at different hatch: (A) 0.05 mm, (B) 0.1 mm, (C) 0.15 mm and (D) 0.2 mm. (E) The surface quality and relative of the samples.
Protrusions and depressions appear on the solidified surface due to surface tension. In contrast, for the samples built with a hatch of 0.1 mm, the surface was relatively flat; however, noticeable cracks were present. These cracks are caused by the high Ti and Al content of the superalloy, which is beyond the scope of this paper. Relevant studies on this topic can be found in the literature, such as (Chen et al, 2018) (Xu et al, 2018) (Grange et al, 2020) (Taheri, 2021). However, when the hatch was increased to 0.15 mm and 0.2 mm, the surface of the samples exhibited unfused porous morphological features with large voids. Insufficient penetration of the molten pool, which is directly related to the hatch distance and inadequate energy input, results in a lack of fusion.
The relative densities of the as-built samples were evaluated using the Archimedes method, as shown in Figure 14E. The density of the samples decreased as the hatch distance increased. When the line energy density is the same, a smaller hatch distance corresponds to a larger volume energy density. Therefore, as the volume energy continued to increase, the density reached a stable value.
The present study focused on the dynamics of single/double tracks molten pools and the factors influencing them in EBSM. Thus, this study is limited as the simulations were performed in a single layer. In future studies, we plan to investigate the influence of multi-layer printing on the molten pool.
In this study, the flow behavior of the molten pool and influencing factors of EBSM of IN738 alloy were investigated through DEM and CFD simulations and experimental analysis. The main conclusions are: Gusarov et al, 2003.
(1) The EBSM molten pool tends to maintain the conduction mode of the melting process. Due to the high energy absorption rate, preheating temperature, and vacuum environment, the molten pool continues to expand even after the end of the scan, exhibiting a “fast heating, slow cooling” trend throughout the printing process.
(2) Driven by Marangoni force, the molten pool rapidly flows backward from the high-temperature region to the low-temperature region after the beam spot, returns and collides in the central region, producing vortices that converge and flow upward. Throughout the flow process, the flow velocity at the irregular solid-liquid interface is much higher than inside the molten pool.
(3) The simulated temperature field shows that the instantaneous maximum temperature of the molten pool during melting is much higher than the material’s boiling point. The recoil pressure mainly contributes to the molten pool shape. However, under vacuum, the recoil pressure is considerably lower than that at standard atmospheric pressure, and increasing the preheating temperature increases the recoil pressure.
(4) The width and depth of the molten pool expand as the
The original contributions presented in the study are included in the article/Supplementary Material, further inquiries can be directed to the corresponding authors.
YZ: methodology, investigation, writing. XF: investigation, supervision. WZ: investigation, review and editing. WG: conceptualization, resources. ZW: supervision, review and editing. JZ: project administration, supervision. All authors contributed to the article and approved the submitted version.
This work was supported by the Young Elite Scientists Sponsorship Program by CAST (2021QNRC001) and the State Key Laboratory of Long-life High Temperature Materials (DECSKL202104).
The authors declare that the research was conducted in the absence of any commercial or financial relationships that could be construed as a potential conflict of interest.
All claims expressed in this article are solely those of the authors and do not necessarily represent those of their affiliated organizations, or those of the publisher, the editors and the reviewers. Any product that may be evaluated in this article, or claim that may be made by its manufacturer, is not guaranteed or endorsed by the publisher.
The Supplementary Material for this article can be found online at: https://www.frontiersin.org/articles/10.3389/fmats.2023.1211648/full#supplementary-material
Al-Bermani, S. S., Blackmore, M. L., Zhang, W., and Todd, I. (2010). The origin of microstructural diversity, texture, and mechanical properties in electron beam melted Ti-6Al-4V. Metallurgical Mater. Trans. a41 (13), 3422–3434. doi:10.1007/s11661-010-0397-x
Allmen, M. V., and Blatter, A. (2013). Laser-beam interactions with materials: Physical principles and applications. 2. Berlin: Springer Science & Business Media.
Aune, R. E., Battezzati, L., Brooks, R., Egry, I., and Quested, P. N. (2005). “Thermophysical properties of IN738LC, MM247LC and CMSX-4 in the liquid and high temperature solid phase[J],” in International Symposium on Superalloys & Derivatives Location, Pittsburgh Pa, October 2005.
Boley, C. D., Khairallah, S. A., and Rubenchik, A. M. (2015). Calculation of laser absorption by metal powders in additive manufacturing. Appl. Opt.54 (9), 2477–2482. doi:10.1364/ao.54.002477
Chapman, L., Morrell, R., Quested, P. N., Brooks, R. F., Brown, P., Chen, L. H., et al. (2008). Properties of alloys and moulds relevant to investment casting. NPL Rep. MATC.141.
Chen, K. C., Chen, T. C., Shiue, R. K., and Tsay, L. W. (2018). Liquation cracking in the heat-affected zone of IN738 superalloy weld. Metals8 (6), 387. doi:10.3390/met8060387
Cheng, Bo, and Chou, Kevin (2013). “Melt pool geometry simulations for powder-based electron beam additive manufacturing,” in 2013 International Solid Freeform Fabrication Symposium, Austin, August 12-14, 2013 (University of Texas at Austin).
Cheng, B., Loeber, L., Willeck, H., Hartel, U., and Tuffile, C. (2019). Computational investigation of melt pool process dynamics and pore formation in laser powder bed fusion. J. Mater. Eng. Perform.28 (11), 6565–6578. doi:10.1007/s11665-019-04435-y
Cho, Jung-Ho, Farson, D. F., Milewski, J. O., and Hollis, K. J. (2009). Weld pool flows during initial stages of keyhole formation in laser welding. J. Phys. D Appl. Phys.42 (17), 175502. doi:10.1088/0022-3727/42/17/175502
Chun, yu Li (2019). Simulation and analysis on utilization ratio of laser cladding powder based on EDEM [J]. J. Fujian Univ. Technol.17 (6), 6.
Grange, D., Bartout, J. D., Macquaire, B., and Colin, C. (2020). Processing a non-weldable nickel-base superalloy by selective laser melting: Role of the shape and size of the melt pools on solidification cracking. Materialia12, 100686. doi:10.1016/j.mtla.2020.100686
Gusarov, A. V., Laoui, T., Froyen, L., and Titov, V. (2003). Contact thermal conductivity of a powder bed in selective laser sintering. Int. J. Heat Mass Transf.46 (6), 1103–1109. doi:10.1016/s0017-9310(02)00370-8
Hirt, C. W., and Nichols, B. D. (1981). Volume of fluid (VOF) method for the dynamics of free boundaries. J. Comput. Phys.39 (1), 201–225. doi:10.1016/0021-9991(81)90145-5
Kerrouault, N. (2000). Fissuration a chaud en soudage d’un acier inoxydable austénitique. Paris: Châtenay-Malabry, Ecole centrale de Paris.
Khairallah, Saad A., Anderson, A. T., Rubenchik, A., and King, W. E. (2016). Laser powder-bed fusion additive manufacturing: Physics of complex melt flow and formation mechanisms of pores, spatter, and denudation zones. Acta Mater.108, 36–45. doi:10.1016/j.actamat.2016.02.014
Khairallah, S. A., and Anderson, A. (2014). Mesoscopic simulation model of selective laser melting of stainless steel powder. J. Mater. Process. Technol.214 (11), 2627–2636. doi:10.1016/j.jmatprotec.2014.06.001
Körner, Carolin, Attar, Elham, and Peter, Heinl (2011). Mesoscopic simulation of selective beam melting processes. J. Mater. Process. Technol.211 (6), 978–987. doi:10.1016/j.jmatprotec.2010.12.016
Leung, C. L. A., Tosi, R., Muzangaza, E., Nonni, S., Withers, P. J., and Lee, P. D. (2019). Effect of preheating on the thermal, microstructural and mechanical properties of selective electron beam melted Ti-6Al-4V components. Mater. Des.174, 107792. doi:10.1016/j.matdes.2019.107792
Lee, Y. S., and Zhang, W. (2016). Modeling of heat transfer, fluid flow and solidification microstructure of nickel-base superalloy fabricated by laser powder bed fusion. Addit. Manuf.12, 178–188. doi:10.1016/j.addma.2016.05.003
Li, E., Zhou, Z., Wang, L., Zou, R., and Yu, A. (2022). Numerical studies of melt pool and gas bubble dynamics in laser powder bed fusion process. Addit. Manuf.56, 102913. doi:10.1016/j.addma.2022.102913
Murr, L. E., Gaytan, S. M., Ceylan, A., Martinez, E., Martinez, J., Hernandez, D., et al. (2010). Characterization of titanium aluminide alloy components fabricated by additive manufacturing using electron beam melting. Acta mater.58 (5), 1887–1894. doi:10.1016/j.actamat.2009.11.032
Parteli, E. J., and Pöschel, T. (2016). Particle-based simulation of powder application in additive manufacturing. Powder Technol.288, 96–102. doi:10.1016/j.powtec.2015.10.035
Qi, H. B., Yan, Y. N., and Zhang, R. J. (2007). Scanning method of filling lines in electron beam selective melting. Proc. Institution Mech. Eng. Part B J. Eng. Manuf.221 (12), 1685–1694. doi:10.1243/09544054jem913
Riedlbauer, D., Scharowsky, T., Singer, R. F., Steinmann, P., Körner, C., and Mergheim, J. (2017). Macroscopic simulation and experimental measurement of melt pool characteristics in selective electron beam melting of Ti-6Al-4V. Int. J. Adv. Manuf. Technol.88 (5), 1309–1317. doi:10.1007/s00170-016-8819-6
Risse, J., and Broeckmann, C. (2019). Additive manufacturing of nickel-base superalloy in738lc by laser powder bed fusion[R]. Aachen, Germany: Lehrstuhl für Lasertechnik.
Shen, N., and Chou, K. (2012). “Numerical thermal analysis in electron beam additive manufacturing with preheating effects,” in 2012 International Solid Freeform Fabrication Symposium, Hilton, August 14-16, 2023 (University of Texas at Austin).
Taheri, M. (2021). Analysis of solidification and liquation cracks in the electron beam welding of IN738 superalloy. Metallogr. Microstruct. Analysis10 (6), 815–822. doi:10.1007/s13632-021-00793-z
Tan, X., Kok, Y., Tan, Y. J., Descoins, M., Mangelinck, D., Tor, S. B., et al. (2015). Graded microstructure and mechanical properties of additive manufactured Ti–6Al–4V via electron beam melting. Acta Mater.97, 1–16. doi:10.1016/j.actamat.2015.06.036
Tumbleston, J. R., Shirvanyants, D., Ermoshkin, N., Janusziewicz, R., Johnson, A. R., Kelly, D., et al. (2015). Continuous liquid interface production of 3D objects. Science347 (6228), 1349–1352. doi:10.1126/science.aaa2397
Wang, W., Lin, W., Yang, R., Wu, Y., Li, J., Zhang, Z., et al. (2022). Mesoscopic evolution of molten pool during selective laser melting of superalloy Inconel 738 at elevating preheating temperature. Mater. Des.213, 110355. doi:10.1016/j.matdes.2021.110355
Wang, Xiaoqing, Gong, Xibing, and Chou, Kevin (2015). Scanning speed effect on mechanical properties of Ti-6Al-4V alloy processed by electron beam additive manufacturing. Procedia Manuf.1, 287–295. doi:10.1016/j.promfg.2015.09.026
Wits, W. W., Bruins, R., Terpstra, L., Huls, R. A., and Geijselaers, H. (2016). Single scan vector prediction in selective laser melting. Addit. Manuf.9, 1–6. doi:10.1016/j.addma.2015.12.001
Xiang, Z., Yin, M., Deng, Z., Mei, X., and Yin, G. (2016). Simulation of forming process of powder bed for additive manufacturing. J. Manuf. Sci. Eng.138 (8), 081002. doi:10.1115/1.4032970
Xu, J., Lin, X., Zhao, Y., Guo, P., Wen, X., Li, Q., et al. (2018). HAZ liquation cracking mechanism of IN-738lc superalloy prepared by laser solid forming. Metallurgical Mater. Trans. A49 (10), 5118–5136. doi:10.1007/s11661-018-4826-6
Yan, W., Qian, Y., Ge, W., Lin, S., Liu, W. K., Lin, F., et al. (2018). Meso-scale modeling of multiple-layer fabrication process in Selective Electron Beam Melting: Inter-layer/track voids formation. Mater. Des.141, 210–219. doi:10.1016/j.matdes.2017.12.031
Yann, D., Lacoste, E., and Arvieu, C. (2010). Numerical modeling of inconel 738LC deposition welding: Prediction of residual stress induced cracking. J. Mater. Process. Technol.210 (14), 2053–2061. doi:10.1016/j.jmatprotec.2010.07.027
Zäh, M. F., and Lutzmann, S. (2010). Modelling and simulation of electron beam melting. Prod. Eng.4 (1), 15–23. doi:10.1007/s11740-009-0197-6
Zhao, Y., Koizumi, Y., Aoyagi, K., Wei, D., Yamanaka, K., and Chiba, A. (2019). Molten pool behavior and effect of fluid flow on solidification conditions in selective electron beam melting (SEBM) of a biomedical Co-Cr-Mo alloy. Addit. Manuf.26, 202–214. doi:10.1016/j.addma.2018.12.002
Keywords: electron beam selective melting, superalloy, numerical simulation, molten pool behavior, influencing factors
Citation: Zhang Y, Fang X, Zhang W, Guo W, Wang Z and Zhao J (2023) Molten pool flow behavior and influencing factors in electron beam selective melting of IN738 superalloy. Front. Mater. 10:1211648. doi: 10.3389/fmats.2023.1211648
Received: 25 April 2023; Accepted: 29 June 2023;
Published: 19 July 2023.
Edited by:
Qiyang Tan, The University of Queensland, AustraliaReviewed by:
Erlei Li, The University of Queensland, AustraliaCopyright © 2023 Zhang, Fang, Zhang, Guo, Wang and Zhao. This is an open-access article distributed under the terms of the Creative Commons Attribution License (CC BY). The use, distribution or reproduction in other forums is permitted, provided the original author(s) and the copyright owner(s) are credited and that the original publication in this journal is cited, in accordance with accepted academic practice. No use, distribution or reproduction is permitted which does not comply with these terms.
*Correspondence: Xuewei Fang, eHVld2VpZmFuZ0B4anR1LmVkdS5jbg==; Jiyuan Zhao, MjAyMjI2MDdAYmlzdHUuZWR1LmNu
Disclaimer: All claims expressed in this article are solely those of the authors and do not necessarily represent those of their affiliated organizations, or those of the publisher, the editors and the reviewers. Any product that may be evaluated in this article or claim that may be made by its manufacturer is not guaranteed or endorsed by the publisher.
Research integrity at Frontiers
Learn more about the work of our research integrity team to safeguard the quality of each article we publish.