 Lei Dong
 Aijun Yao1
95% of researchers rate our articles as excellent or good
Learn more about the work of our research integrity team to safeguard the quality of each article we publish.
Find out more
ORIGINAL RESEARCH article
Front. Mater. , 11 July 2023
Sec. Structural Materials
Volume 10 - 2023 | https://doi.org/10.3389/fmats.2023.1201752
This article is part of the Research Topic Physico-Mechanical Properties and Treatment Technology of Hazardous Geomaterials, volume II View all 17 articles
The traditional underground utility tunnel system is characterized by a lengthy construction period, material waste, and poor engineering quality. This study proposes the prefabricated composite shell system underground utility tunnel as a new type of prefabricated underground utility tunnel system. This system uses 20 mm thick high-performance cement-based materials as permanent templates, with steel reinforcement skeletons placed in the cavity between the two side molds, and concrete can be poured after on-site hoisting and positioning to form an integrated tunnel. This study first systematically introduces the system design method of the prefabricated composite shell system underground utility tunnel and clarifies its component and connection structures. Then, bending tests are conducted on the composite shell tunnel top plate specimens, and a cast-in-place top plate specimen is selected as a control group. A suitable bearing capacity calculation formula for composite shell top plates is derived and proposed based on test phenomena and results analysis. The results showed that the prefabricated outer template and internal cast-in-place concrete of the composite shell top plate specimen have good collaborative performance. Its bearing capacity, stiffness, and failure phenomena are consistent with those of cast-in-place components, as are its mechanical properties. In addition, the proposed bearing capacity calculation formula for a composite shell top plates is highly accurate and can guide the design of such components.
Since 2015, China has witnessed explosive growth in the mileage of constructed utility tunnels. Tunnels are the lifeline of cities (Valdenebro and Gimena, 2018; CANTO-PERELLO and CURIEL-ESPARZA, 2001; O’ROURKE et al., 2001; DARLI et al., 2021), and the stress on an underground structure is more complex than that on an above-ground structure (Bai et al., 2019; Luo et al., 2020; Bai et al., 2021a), so its safety is essential. From the perspective of the construction mode, the integral cast-in-place mode is applied to most of the tunnels. The integral cast-in-place mode provides good waterproof performance but has a longer construction duration, a greater environmental impact, and requires more field workers. Thus, it is an inevitable trend to adopt the fabricated construction method.
The composite slab-type concrete structure has been extensively studied and applied in constructing above-ground buildings (Gu et al., 2020; Bai et al., 2021b; Jiang et al., 2021; Zhou et al., 2021; Bai et al., 2023). As a structural member, it consists of the precast concrete arranged on both sides as the formwork connected through truss bars. In the construction process, concrete is poured into the cavity to form the integral structure.
Some scholars have studied composite slab-type underground utility tunnels. Yanmin Yang (YANG et al., 2020) conducted static loading tests on a fabricated composite tunnel and analyzed the phenomenon of its failure, bearing capacity and load-strain curve, and load-displacement curve of each measuring point on the axillary angle under the influence of simulated overburden load. They indicated that the axillary angle exhibits no obvious cracks under the normal service condition, which suffers significant deformation and presents good mechanical performance only under ultimate load. Weichen Xue (XUE et al., 2018) et al. Investigated the seismic performance outside the composite shear wall plane, and their results showed that the ultimate bearing capacity outside the composite shear wall plane is 10.7% lower than that of the cast-in-place shear wall. However, there are still some limitations in applying this technology to underground engineering, which are primarily illustrated by the following points:
(1) It is not easy to detect the molding quality of post-cast concrete. The prefabricated slab for existing underground fabricated composite concrete utility tunnels is generally made of ordinary concrete with a minimum thickness of 50 mm. In addition, there are steel bars within the post-cast concrete, making it difficult to detect the molding quality directly.
(2) The joint connection is poor. The utility tunnel is an out-of-plane stress component. The prefabricated component is thicker, the connecting steel bars are located in the cavity inside the prefabricated slab, and the ultimate bearing capacity outside the plane is lower than that of the cast-in-place structure.
The application of high-performance cement-based materials in construction engineering has become more mature (Roy et al., 1972; Wang et al., 2012; Zheng et al., 2015; Chong et al., 2016; De et al., 2016; Zheng et al., 2016). The prefabricated slab made of ordinary concrete is replaced with formwork made of high-performance material to reduce the thickness of the prefabricated component, thereby assisting in settling the problems mentioned above. Based on this concept, a new technical system of underground fabricated concrete utility tunnels is proposed—underground utility tunnels of prefabricated composite shell system (after this referred to as composite shell utility tunnels). High-strength materials can provide the following advantages:
1) The out-of-plane mechanical performance is better. The loaded and connecting steel bars are all located in the cavity between the formwork shells, and the steel bars at the joints are connected by a lapping connection. The connection method is consistent with the cast-in-place structure, and the distance between the two rows of connecting steel bars is significant, resulting in improved out-of-plane mechanical performance.
2) Transportation and installation costs are low. The weight of composite shell utility tunnels is about 40% lower than that of composite slab concrete pipe gallery, the transportation efficiency is high, and the mechanical requirements for on-site installation are less, with a broader application scenario.
3) Because the formwork shell is thin, thermal infrared technology can be employed to determine the quality of post-pouring concrete molding.
This study addresses the design structure of the system first, determines the component structure, joint construction, the ratio of formwork shell materials, and others of the composite shell utility tunnels, and tests the fundamental mechanical properties of formwork shell materials. Then, an experimental investigation is conducted on the composite shell roof specimens to analyze the primary performance indices and failure forms of cast-in-place and composite shell specimens. On the other hand, the test phenomena and results are utilized to derive the calculation formula for the bearing capacity of the composite shell roof specimens, providing a reference for the system’s application.
Depending on the structure, the composite shell utility tunnel components are divided into formwork shells, steel bar trusses, connectors, and post-cast concrete. The formwork shell is made of high-performance inorganic material, with a thickness of 20 mm, the steel bar truss is placed on the outside of the prefabricated formwork shell, and the connectors are attached to the steel reinforcement cage and poured into the formwork shell to secure the steel bar truss and the formwork shell, as depicted in Figure 1.
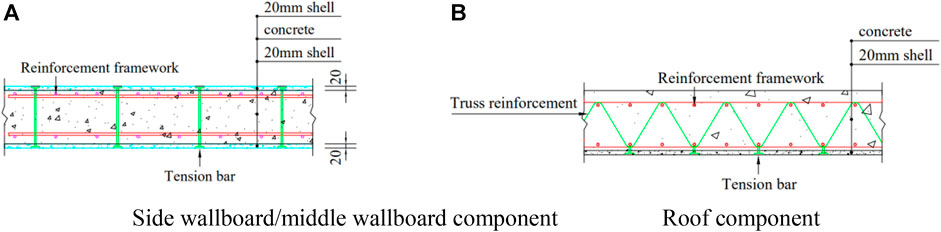
FIGURE 1. Structure of composite shell utility tunnel components. (A) Side wallboard/middle wallboard component, (B) Roof component.
The composite shell utility tunnel components were prefabricated at the factory before being installed on-site and pouring concrete. The transient operating condition involves stripping, transporting, hoisting, concrete pouring, and others. Comprehensively considering the load to be borne by the formwork shell under various working conditions, the spacing between the opposite-pull type’s connectors was 400 mm, the thickness of the formwork shell was 20 mm, and its flexural strength was no less than 12 MPa.
The composite shell utility tunnels are divided into side wallboard, middle wallboard, and roof components based on the component types. Figure 2 depicts how the double-warehouse utility tunnels are subdivided into their component parts. The joint position between the side wallboard of the composite shell and the lower cast-in-place part was set at 500 mm above the top surface of the baseboard, and axillary angles were placed at the four corners of the utility tunnels. During the field operation, concrete was first poured into the bottom plate on-site, and once it reached a certain strength, the concrete on the contact surface was chiseled to create a rough surface. The composite shell’s side wallboards and interior wallboards were placed and secured, followed by the installation of the composite shell’s roof. After the composite shell components were assembled in place, concrete was poured into the cavity to form the integral structure.
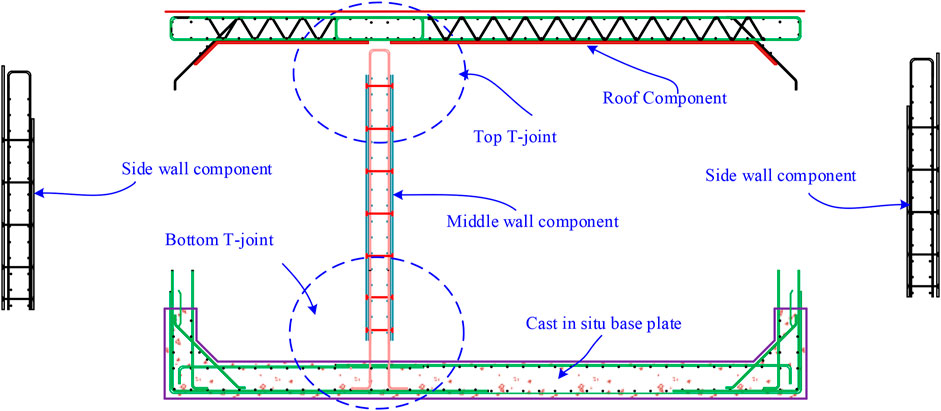
FIGURE 2. Schematic diagram for composite shell utility tunnels.
Since the steel bars in the composite shell components were located in the cavity between formwork shells, the composite shell components, cast-in-place baseboard, and composite shell components can be connected utilizing steel bar splicing, which was consistent with the steel bar connection mode of cast-in-place structure.
The geometric dimensions and reinforcement of two roof specimens of composite shell utility tunnels are illustrated in Figure 3. The length × width for both specimens CS-TF and CIS-TF were 3,600 × 1,500 mm2, and the thickness of the cast-in-place specimen CIS-TF was 300 mm. The thickness of the formwork shell at the bottom of the composite shell specimen CS-TF was 20 mm, while the thickness of the cast-in-place concrete part was 280 mm. The upper longitudinal steel bars in the two specimens were C16@200, the lower longitudinal steel bars were C16@100, and the upper and lower horizontal steel bars were C12@150. The positioning of the middle and upper reinforcing and lower reinforcing meshes of the composite shell specimen CS-TF was achieved by the assembled four truss steel bars (Figure 3), whereas that of CIS-TF was accomplished by reinforced pony stools.
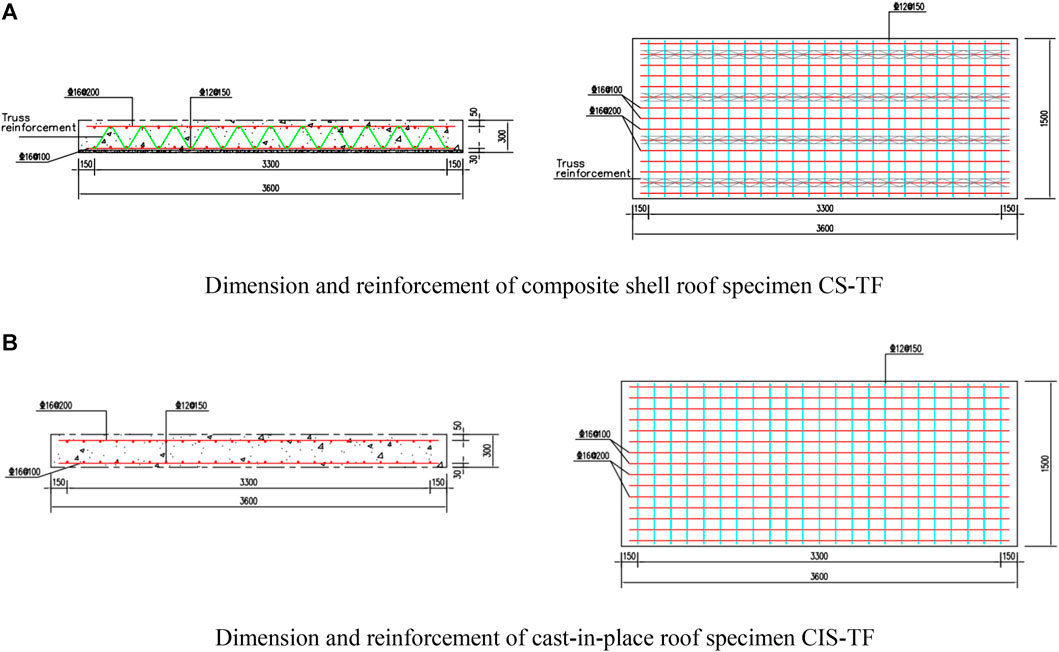
FIGURE 3. Geometric dimension and reinforcement of specimens. (A) Dimension and reinforcement of composite shell roof specimen CS-TF, (B) Dimension and reinforcement of cast-in-place roof specimen CIS-TF.
Tests were conducted on the configuration and performance of formwork shell material to ensure the required mechanical properties of the above materials. Table 1 lists the mixture proportion of formwork shell materials. A total of 29 test specimens were created, whereas Table 2 exhibits their sizes and quantity. Cube specimens were employed to measure the cubic compressive strength, while cement mortar test specimens were conducted to compute the flexural strength. In addition, prism test specimens were performed to determine the elastic modulus, Poisson’s ratio, compressive strength, and peak strain of prisms, whereas slab-shaped test specimens were utilized to calculate the tensile strength and peak tensile strain. Figure 4 illustrates the fabrication and test of various specimens. Before the test, resistance strain gauges were placed on the surface of each test specimen to obtain the elastic modulus, Poisson’s ratio, and the equivalent values of peak tensile strain and compressive strain.

TABLE 1. Mix proportion of materials.

TABLE 2. Size and quantity of test specimens.
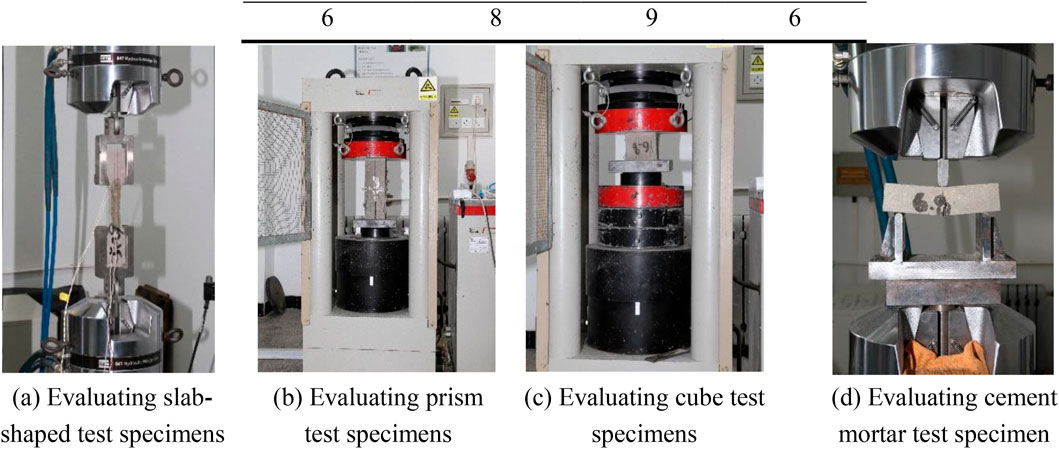
FIGURE 4. Fabrication and Evaluating test specimens. (A) Evaluating slab-shaped test specimens, (B) Evaluating prism test specimens, (C) Evaluating cube test specimens, (D) Evaluating cement mortar test specimen.
Figure 5 displays the loading curve obtained by the stroke of the testing machine, and Table 3 shows the detailed data indices for elastic modulus and Poisson’s ratio measured with a resistance strain gauge. The peak tensile strain and the peak compressive strain obtained utilizing the resistance strain gauge were 150–300 με and 2,500–3,500 με, respectively.
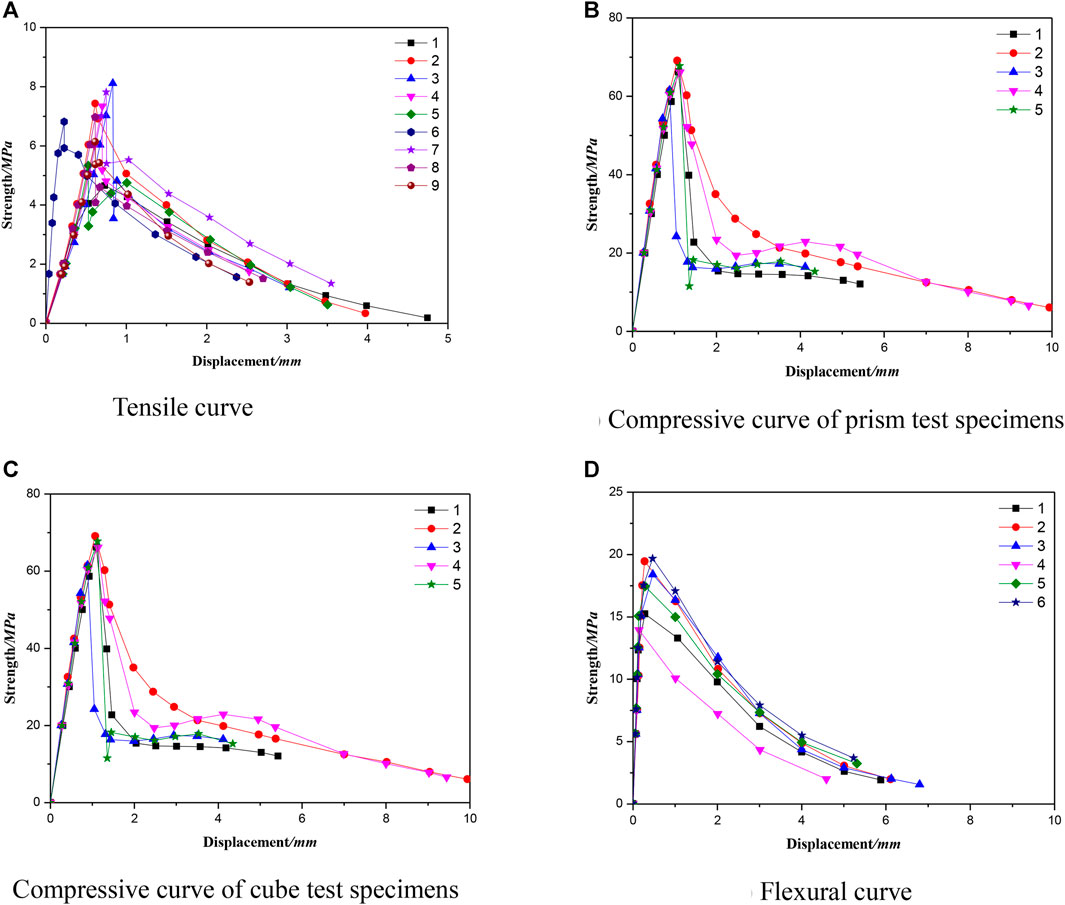
FIGURE 5. Loading curves. (A) Tensile curve, (B) Compressive curve of prism test specimens, (C) Compressive curve of cube test specimens, (D) Flexural curve.
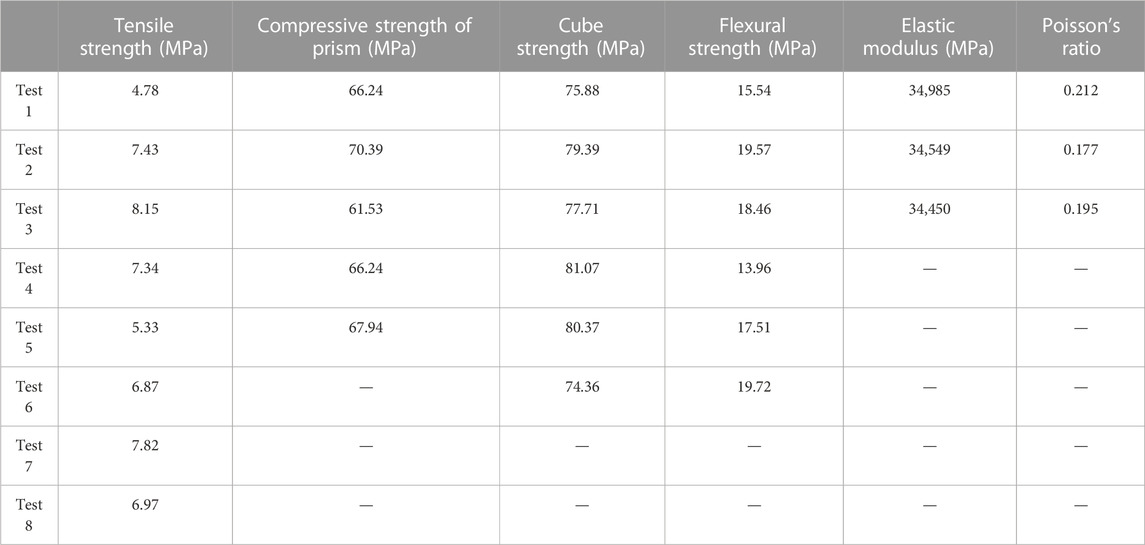
TABLE 3. Strength, elastic modulus and Poisson’s ratio.
During the composite shell roof specimen CS-TF fabrication, the reinforcing mesh sheets on both sides were bound first. The reinforcing mesh sheets were then secured by truss bars to form a steel skeleton, as shown in Figure 6A. The steel skeleton was placed horizontally on the formwork table, supported on the bottom form by the truss bars, and 20 mm of inorganic high-performance material was poured to successfully fabricate the formwork shell, as illustrated in Figure 6B. When the formwork shell reached a specific strength, it was demolded, transported to a predetermined location, and concrete was poured, as revealed in Figures 6C, D.
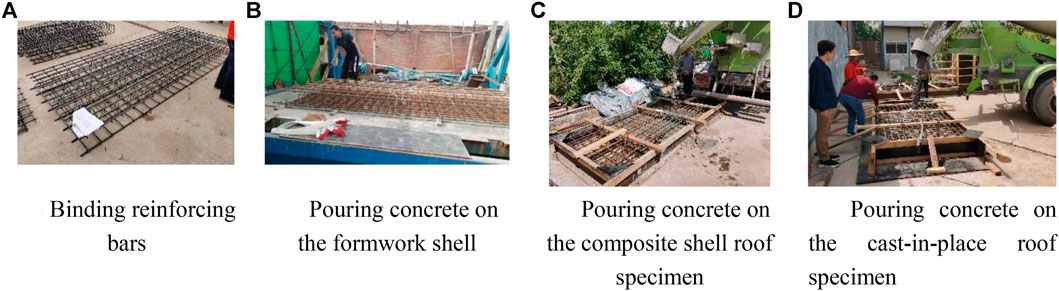
FIGURE 6. Fabricating process of roof specimen. (A) Binding reinforcing bars, (B) Pouring concrete on the formwork shell, (C) Pouring concrete on the composite shell roof specimen, (D) Pouring concrete on the cast-in-place roof specimen.
The design strength of the post-pour part of concrete on CS-TF and CIS-TF was C40. Standard mortar test specimens were reserved when the formwork shell was fabricated, and standard cube test specimens were reserved when concrete was poured. The test and wall specimens were cured under identical conditions. As shown in Table 4, on the day of the test, the average compressive strength fc1 of concrete prism and the average compressive strength fc2 of formwork shell mortar were determined. Table 5 displays the measured yield strength fy, ultimate strength fu, and elongation after fracture for steel bars.
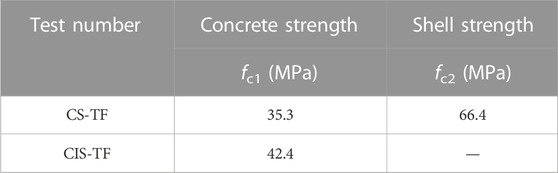
TABLE 4. Strength of concrete and mortar.
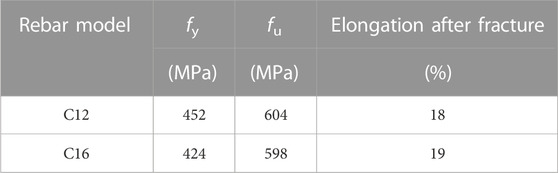
TABLE 5. Mechanical properties of reinforcement.
Midas software was employed to calculate the underground utility tunnel model with a 2.5 m burial depth to obtain the pressure of underground soil on each part of the utility tunnels under static conditions. Based on the calculation results, the axial pressure on the underground utility tunnel’s roof was 100 kN. During loading, the specimen was placed horizontally on the supporting point, and the hydraulic jacks arranged horizontally exerted axial force by the steel distributive beam. Vertically arranged hydraulic jacks applied a linear load to the specimens’ midspan by a steel distributive beam. In addition, force sensors were attached to the hydraulic jacks to obtain real-time load data.
Hierarchical monotone loading was used as the loading mode. First, loading up to 100 kN was performed using 20 kN as a level, followed by 40 kN as a level. The load holding time should not be between 5 and 10 min after completing the loading at each level. When it was determined that the load did not change greatly (the specimens yielded), but the displacement varied significantly during loading, the displacement was controlled, and loading was applied at a level of 10 mm. When the specimen’s load-bearing capacity was reduced to 85% of its peak load, it was considered to have failed, and the loading was stopped. Figure 7 depicts the loading device and loading system.
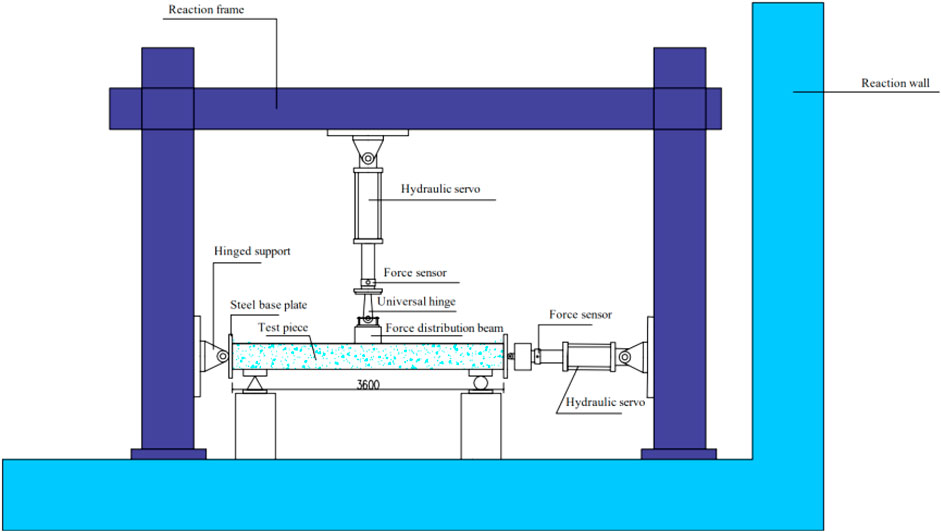
FIGURE 7. Loading device.
A displacement meter was placed at the specimen’s midspan to measure its loading point’s displacement during loading, as illustrated in Figure 8. Reinforcement strain gauges were installed on the tension and compression sides of the specimen’s midspan to determine the variation laws on a strain of steel bars during loading, as demonstrated in Figure 9. Concrete strain gauges were located along the thickness direction of the roof specimen at the midspan of it and 1,000 mm away from the midspan on both sides to measure the variation laws on concrete strain at different heights during loading, as shown in Figure 10.
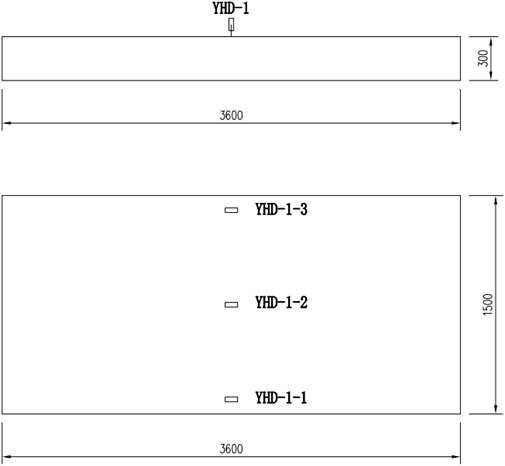
FIGURE 8. Layout of displacement meters.
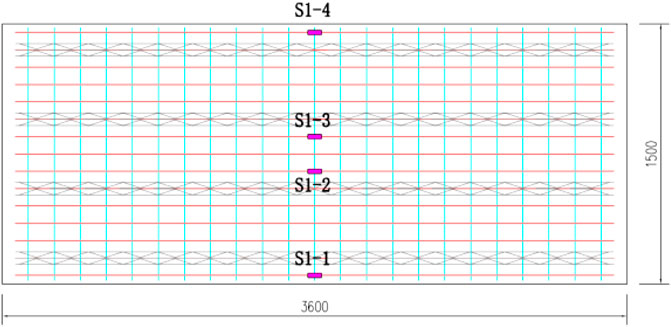
FIGURE 9. Layout of reinforcement strain gauges.
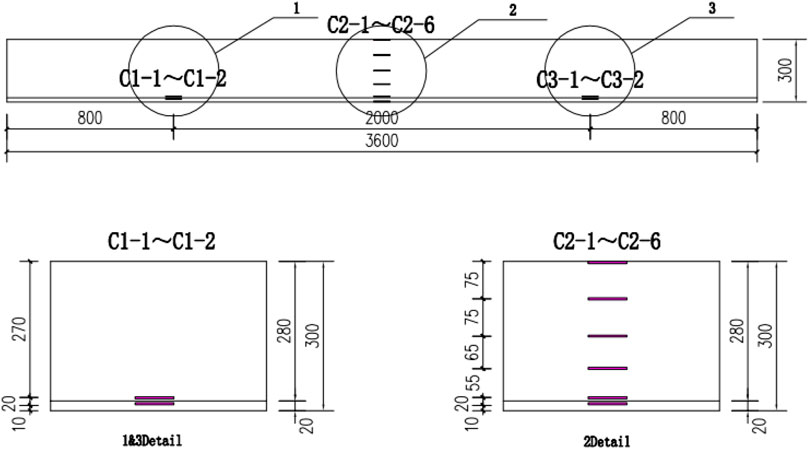
FIGURE 10. Layout of concrete strain gauges.
(1) Specimen cracking: When the load at the loading point reached 143.73 kN (Δ = 3.18 mm), the first crack appeared below the loading point, and simultaneously the formwork shell and concrete cracked. The crack width was approximately 0.05 mm, and the length was about 100 mm.
(2) Cracking of the formwork shell-concrete joint surface: as the load rose, the width of the first crack gradually increased and extended upward, generating several new cracks. The cracks also passed through the joint surface, with the formwork and concrete cracking simultaneously, and the specimens exhibited good integrity. When the load reached 360.59 kN (Δ = 11.14 mm), cracks appeared within 300 mm of the loading point on the formwork shell-concrete joint surface. In this case, the maximum width of the cracks was 0.25 mm, the maximum length was approximately 180 mm, and the steel fibers at the cracking part on the formwork shell remained connected.
With the load increasing, existing cracks continued to develop and propagate, generating several new cracks. An obvious inflection point was observed on the load-displacement curve at the loading point, and then the loading was controlled by displacement.
(3) Reaching the peak load: When the displacement at the loading point reached 142.79 mm, the specimen reached its peak load of 560.12 kN, and the corresponding specimen damage characteristics are shown in Figure 11A. In this case, the maximum crack width on the specimen was 8 mm, and the crack below the loading point extended to 250 mm in length. The formwork shell was disconnected below the loading point, and the steel fiber was no longer connected. Cracks appeared on the formwork shell-concrete joint surface within 1,800 mm below the loading point, and the concrete on the compression side was crushed.
(4) Completing loading: No new cracks were generated after reaching the peak load. The load decreased slowly as the control displacement increased, and the width of the existing crack continued to grow. When the displacement at the loading point achieved 248.00 mm, the load was reduced to 467.75 kN; cracks formed on the formwork shell-concrete joint surface within 2,000 mm below the loading point; and concrete crushing on the compression side was aggravated, the specimen failed severely, and the loading terminated. The corresponding specimen failure characteristics are shown in Figure 11B.
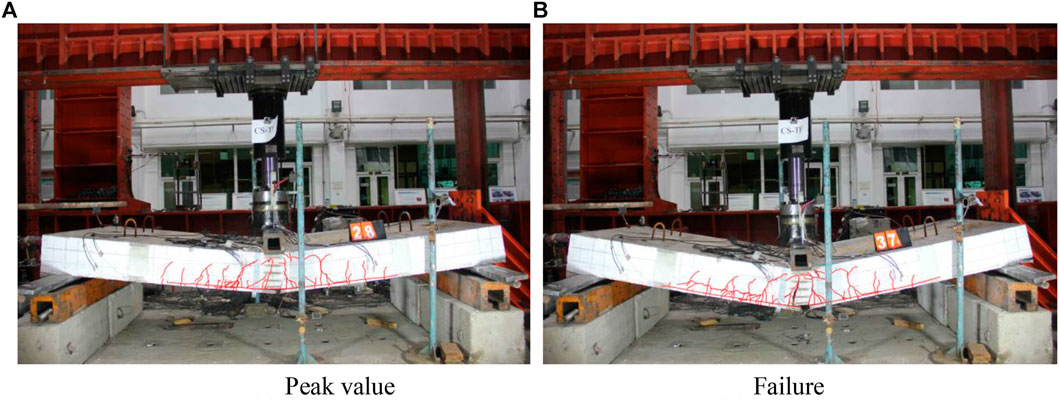
FIGURE 11. Evaluating phenomena of specimen CS-TF. (A) Peak value, (B) Failure.
(1) Specimen cracking: When the load reached 141.3 kN (Δ = 3.01 mm), the first crack appeared below the loading point, with a width of about 0.05 mm and a length of approximately 50 mm.
As the load increased, several new cracks appeared, and the first crack continued to extend. An obvious inflection point was observed on the load-displacement curve of the loading point, and the loading was subsequently controlled by displacement.
(2) Reaching the peak load: When the displacement at the loading point reached 107.05 mm, the specimen reached its peak load of 554.01 kN, and the corresponding specimen damage characteristics are shown in Figure 12A. In this case, the maximum width of the cracks was approximately 10 mm, the crack length below the loading point was 260 mm, and the concrete on the compression side was crushed.
(3) Completing loading: No additional cracks were produced after reaching the peak load. With the increase in displacement at the loading point, the load slowly decreased, existing cracks continued to develop, and the concrete in the compression zone was more severely crushed. When the displacement at the loading point achieved 147.41 mm, the load decreased to 427.08 kN, the specimen suffered a more severe failure, and the loading was terminated. The corresponding specimen failure characteristics are shown in Figure 12B.
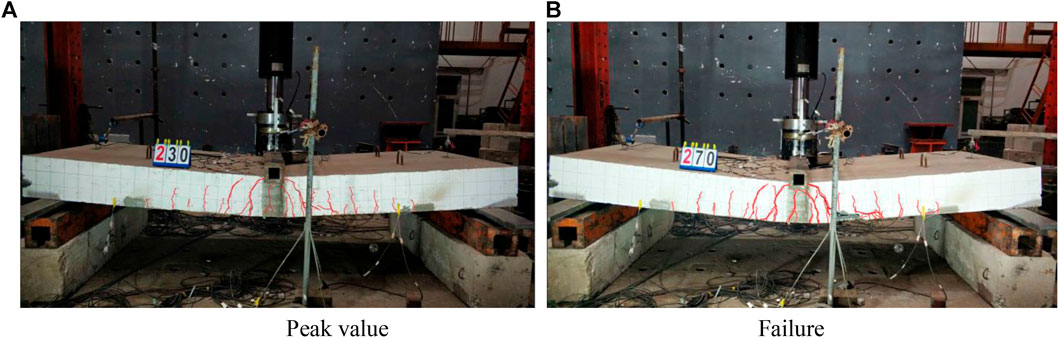
FIGURE 12. Evaluating phenomena of specimen CIS-TF. (A) Peak value, (B) Failure.
Figure 13 exhibits the load-midspan displacement (V-
(1) The Load-displacement curve of the two specimens essentially coincided and presented the same variation trend. The formwork shell was located on the tensile side, not affecting the specimens’ load-displacement characteristics.
(2) Both specimens were in an elastic state during the initial loading, and the load increased significantly while the displacement rose less. Cracks were then observed on the specimens, and the slope of the skeleton curves gradually decreased. As the loading progressed, an obvious inflection point appeared in the curves, and the specimens yielded. After that, the specimen’s load increased slowly, and its displacement grew significantly. After reaching the peak load, there were almost no new cracks on the tensile side at the specimen’s midspan, the concrete on the compression side was crushed, and the load decreased slowly as the displacement improved. Finally, the load dropped to less than 85% of the peak load, and the loading terminated.
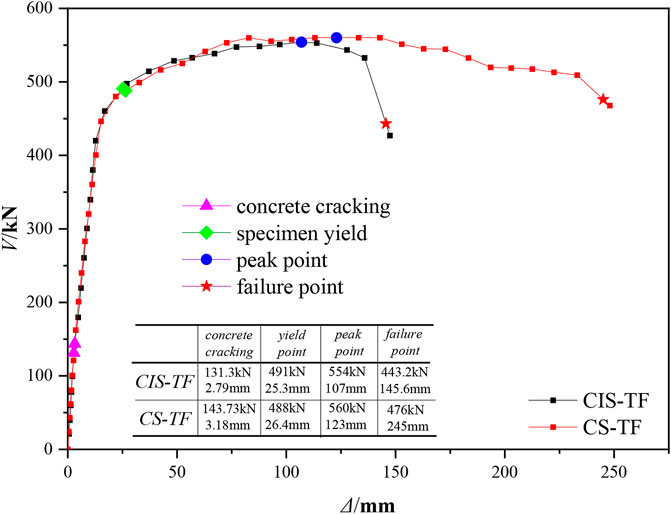
FIGURE 13. Load-displacement curve.
Table 7 lists the characteristic values for the critical state points of the two specimens, wherein the yield point was determined by the energy method, and the limit point referred to the corresponding state point when the load on the specimen’s skeleton curve decreased to 85% of the peak load. The following can be observed from Table 6:
(1) Both specimens’ displacement ductility coefficients were greater than 5, indicating that both specimens had good deformability. The displacement ductility coefficient of composite shell specimen CS-TF was larger than that of cast-in-place specimen CIS-TF.
(2) The characteristic values for the yield point and peak point of the composite roof shell specimen CS-TF were comparable to those of the cast-in-place specimen CIS-TF, and their peak load differed by only 1%. The formwork shell was installed on the tensile side, which did not affect the specimens’ bearing capacity.
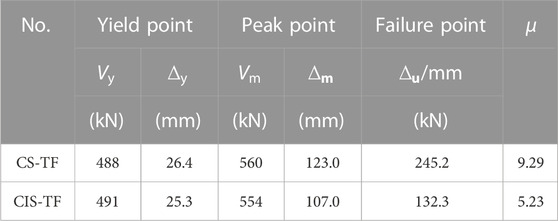
TABLE 6. Characteristics and ductility coefficients for each specimen’s yield, peak, and failure points.
Figure 14 reveals the stiffness degradation curve of each specimen. It indicates that:
(1) The stiffness degradation law of composite shell specimens differed from that of cast-in-place specimens. When the cast-in-place specimen CIS-TF reached the yield state, the stiffness decreased relatively slowly, and a “small plateau” appeared in the stiffness degradation curve, and the stiffness decreased more rapidly after the yield point. During the loading process, the composite shell specimen CS-TF stiffness decreased slowly with the increased applied load/displacement, with no “plateau” appearing.
(2) The initial stiffness of composite shell specimens CS-TF is slightly larger than that of cast-in-place specimens CIS-TF, indicating that the formwork shell and concrete are integral at the initial loading stage, and the formwork shell made of high-performance materials on the tension side can improve the specimens’ resistance to deformation during the normal use stage.
(3) Multiple cracks appeared on the tensile side of the concrete near the yield points of the two specimens at their midspan loading points. The formwork shell in the composite shell specimen CS-TF was ruptured in tension, and a slip appeared on the formwork shell-concrete’s joint surface in the concrete’s crack development area. The formwork shell’s contribution to the specimen’s stiffness faded away. After the yield point, the two specimens’ stiffness values were identical.
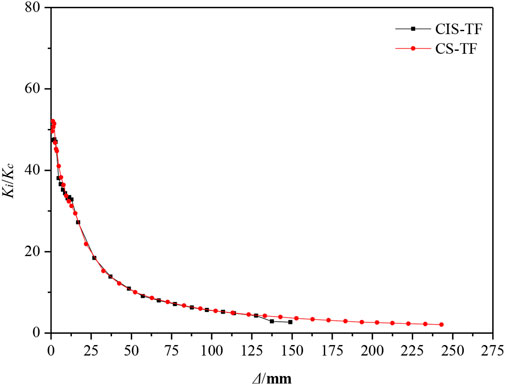
FIGURE 14. Secant stiffness degradation curve for roof component.
Steel bar strain gauges were placed at the midspan of the specimens with the strain-load curve indicated in Figure 15, where the strain trends of steel bars in both specimens were identical. The initial loading state for the lower steel bars (S1-1′-S1-3′) was linear. Near the specimens’ crack points, the steel bars’ strain and load exhibited a nonlinear behavior; near the specimens’ yield points, the steel bars’ strain had reached yield strain, and with the load continuously increasing, the strain value increased significantly. In the initial loading state, the upper steel bars (S1-1-S1-3) were in compression, but with the increase of the load, the concrete on the tensile side cracked, cracks continued to develop and extend, and the compression zone kept decreasing. After the specimens yielded, the upper steel bars began changing from the compression to the tension state.
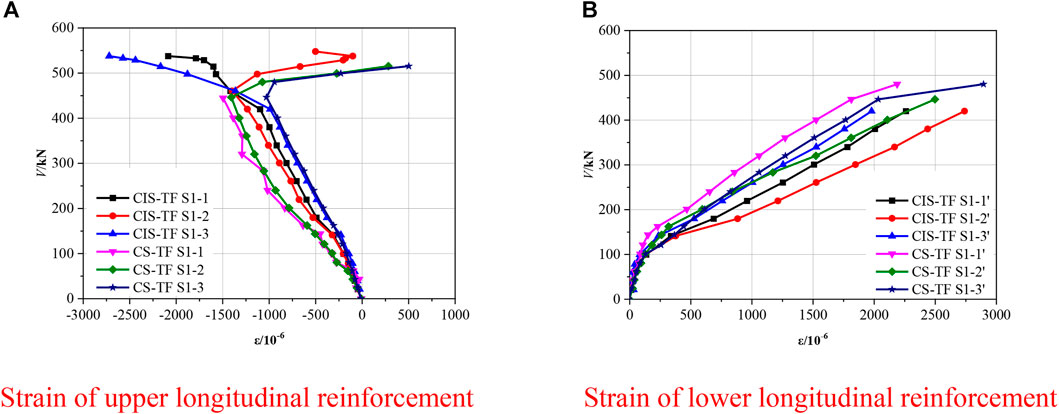
FIGURE 15. Strain curve for steel bars. (A) Strain of upper longitudinal reinforcement, (B) Strain of lower longitudinal reinforcement.
Concrete strain gauges were installed at the midspan of the specimens along the thickness direction. Figure 16 depicts the variation of strain values at various positions of specimens before cracking. It demonstrates that the presence of the formwork shell had no effect on the strain distribution and that the specimens conformed to the plane-section assumption before cracking.
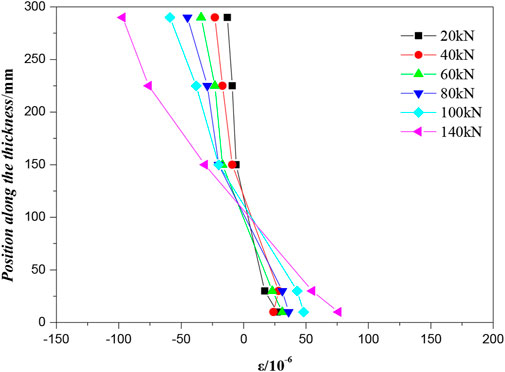
FIGURE 16. Strain curves for concrete at different positions.
The test phenomena and results showed that the first crack on the specimen occurred below the loading point, and the formwork shell and concrete cracked simultaneously during the normal section cracking mode, while the joint surface of the formwork shell-concrete did not crack. Based on this phenomenon, the formwork shell and concrete can be investigated as a unit when the force analysis is performed on the specimen’s cracking point. Since the concrete stress was small in the compression zone, the compressive stress on the concrete was regarded as the linear distribution mode.
For ordinary concrete, it is believed that cracking occurred when the tensile strain on concrete reached two times the peak axial tensile strain
In calculating the yield point’s bearing capacity, the tensile strength of the concrete and formwork shell was disregarded, and the compressive stress of concrete in the compression zone was used as the mode of linear distribution. The state point of the yield of lower steel bars was determined to be the yield point of specimens, and the yield strain
In calculating the peak point’s bearing capacity, the tensile strength of the concrete and formwork shell was ignored, and the compressive stress on concrete in the compression zone was considered the uniformly distributed load mode. Based on the previous analysis, at the peak point, the upper steel bars changed from the compressive state to the tensile state, and the stress value was lower; therefore, the acting force on the upper steel bars was not accounted for in the equilibrium formula. The lower steel bars experienced greater deformation and entered the reinforcing stage, so the stress at the peak point was assumed to be 1.1 times the yield stress
where
Figure 17 depicts the detailed calculation of various load points, with the calculation results illustrated in Table 7. The calculated bearing capacity of the cracking, yield, and peak points was 134, 430, and 490 kN, respectively, with errors of 6.5%, 11.9%, and 12.5%, respectively, compared with the test values. The calculated values were all lower than the test values. The proposed formula can be employed to accurately determine the bearing capacity of composite shell roof specimens in different states. It has certain safety redundancy, providing a reference for performance design in different operating conditions.
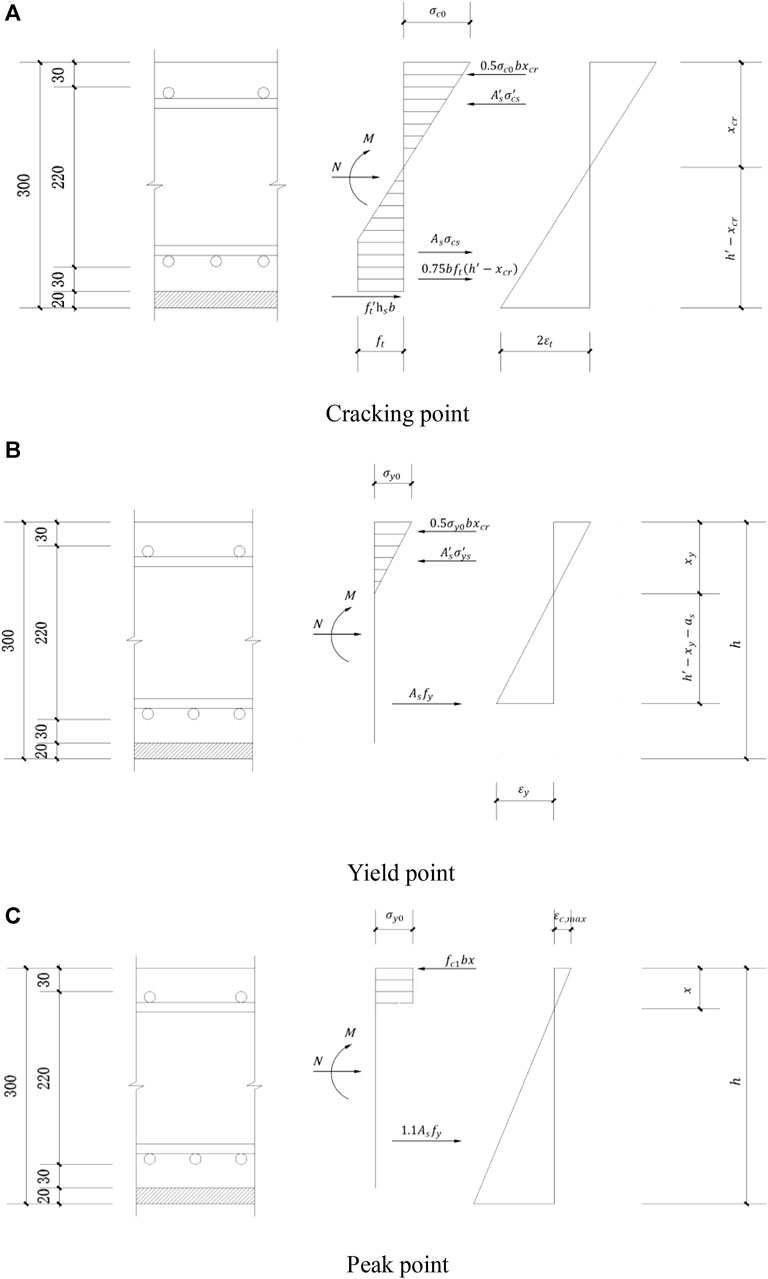
FIGURE 17. Calculation diagram for bearing capacity at different state points. (A) Cracking point, (B) Yield point, (C) Peak point.
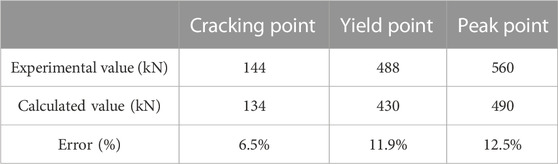
TABLE 7. Comparison between specimens’ experimental and calculated bearing capacity values at various state points.
Due to the use of high-performance cement-based materials in the prefabricated parts, a new fabricated underground concrete utility tunnel technology system is introduced—underground utility tunnels in a fabricated composite shell system. In addition, the system’s component structure and connection structure are proposed, and the properties of high-performance cement-based materials are tested. Based on the proposed structure, two roof specimens for utility tunnels are designed and fabricated, and an experimental study is conducted. The key findings are as follows:
(1) The failure processes and modes of composite shell specimen CS-TF and cast-in-place specimen CIS-TF were identical: lower steel bars suffered tensile yield, upper steel bars gradually transformed from compression to tension, and concrete on the compression side was crushed.
(2) The bearing capacity and stiffness of composite shell specimen CS-TF and cast-in-place specimen CIS-TF were the same, and the ductility of composite shell specimen CS-TF was significantly superior to that of cast-in-place specimen CIS-TF. The composite shell roof specimen achieved the same mechanical performance index as the cast-in-place structure. The existence of the formwork shell had no adverse effect on the mechanical properties of the integral structure.
(3) Based on the testing phenomena and data analysis results, formulas for calculating the bearing capacity of composite shell roof at the cracking point, yield point, and peak point were proposed, with an error of no more than 12.5%, which was in good agreement with the experiments.
The original contributions presented in the study are included in the article/Supplementary Material, further inquiries can be directed to the corresponding author.
1) LD, responsible for the overall experiment and the preparation of the paper, as well as the main derivation of the formula. 2) AY, the corresponding author of the paper, undertakes the funding, design, writing and checking of the subject. 3) DZ, the person in charge of the on-site test of the thesis. 4) PZ is responsible for data processing. All authors contributed to the article and approved the submitted version.
The research reported in this article is sponsored by the China Railway Construction Scientific Research Program (Grant No. 2019-A01) and Research and Development Project of the Ministry of Housing and Urban-Rural Development (Grant No. 2021-K-047).
Authors LD, DX, and PZ were employed by China Railway Construction Group Co., LTD.
The remaining author declares that the research was conducted in the absence of any commercial or financial relationships that could be construed as a potential conflict of interest.
All claims expressed in this article are solely those of the authors and do not necessarily represent those of their affiliated organizations, or those of the publisher, the editors and the reviewers. Any product that may be evaluated in this article, or claim that may be made by its manufacturer, is not guaranteed or endorsed by the publisher.
Bai, B., Fan, B., Nie, Q., and Jia, X. (2023). A high-strength red mud–fly ash geopolymer and the implications of curing temperature. Powder Technol. 416, 118242. doi:10.1016/j.powtec.2023.118242
Bai, B., Nie, Q., Zhang, Y., Wang, X., and Hu, W. (2021b). Cotransport of heavy metals and SiO2 particles at different temperatures by seepage. J. Hydrology 597, 125771. doi:10.1016/j.jhydrol.2020.125771
Bai, B., Yang, G., Tao, L., and Yang, G. (2019). A thermodynamic constitutive model with temperature effect based on particle rearrangement for geomaterials. Mech. Mater. 139, 103180. doi:10.1016/j.mechmat.2019.103180
Bai, B., Zhou, R., Cai, G., Hu, W., and Yang, G. (2021a). Coupled thermo-hydro-mechanical mechanism in view of the soil particle rearrangement of granular thermodynamics. Comput. Geotechnics 137 (8), 104272. doi:10.1016/j.compgeo.2021.104272
Canto-Perello, J., and Curiel-Esparza, J. (2001). Human factors engineering in utility tunnel design. Tunn. Undergr. Space Technol. 16 (3), 211−215. doi:10.1016/s0886-7798(01)00041-4
Chong, X., Xie, L., Ye, Xi, Jiang, Q., and Wang, D. (2016). Experimental study and numerical model calibration of full-scale superimposed reinforced concrete walls with I-shaped cross sections. Adv. Struct. Eng. 19 (12), 1902–1916. doi:10.1177/1369433216649392
Darli, C. M., Aiping, T., Delong, H., and Jiqiang, Z. (2021). Large scale shaking table model test and analysis on seismic response of utility tunnel in non-homogeneous soil. Earthq. Eng. Eng. Vib. 20 (2), 505–515. doi:10.1007/s11803-021-2035-6
De, A., Morgante, A. N., and Zimmie, T. F. (2016). Numerical and physical modeling of geofoam barriers as protection against effects of surface blast on underground tunnels. Geotext. Geomembranes 44 (1), 1–12. doi:10.1016/j.geotexmem.2015.06.008
Gu, Q., Ge, D., Yang, K., Tian, S., Wen, S., Tan, Y., et al. (2020). Seismic behavior of precast double-face superposed shear walls with horizontal joints and lap spliced vertical reinforcement. Struct. Concr. 21 (5), 1973–1988. doi:10.1002/suco.201900019
Jiang, Q., Shen, J., Chong, X., Chen, M., Wang, H., Feng, Y., et al. (2021). Experimental and numerical studies on the seismic performance of superimposed reinforced concrete shear walls with insulation. Eng. Struct. 240, 112372. doi:10.1016/j.engstruct.2021.112372
Luo, Y., Alaghbandrad, A., Genger, T. K., and Hammad, A. (2020). History and recent development of multi-purpose utility tunnels. Tunn. Undergr. Space Technol. 103, 103511. doi:10.1016/j.tust.2020.103511
O ’Rourke, T. D., Stewart, H. E., and Jeon, S. S. (2001). Geotechnical aspects of lifeline engineering. Geotech. Eng. 149 (1), 13–26. doi:10.1680/geng.149.1.13.39308
Roy, D. M., Gouda, G. R., and Bobrowsky, A. (1972). Very high strength cement pastes prepared by hot pressing and other high pressure techniques. Cem. Concr. Res. 2 (3), 349–366. doi:10.1016/0008-8846(72)90075-0
Valdenebro, J. V., and Gimena, Q. F. N. (2018). Urban utility tunnels as a long-term solution for the sustainable revitalization of historic centres: The case study of pamplona-Spain. Tunn. Undergr. Space Technol. 81, 228–236. doi:10.1016/j.tust.2018.07.024
Wang, C., Yang, C., Liu, F., Wan, C., and Pu, X. (2012). Preparation of ultra-high performance concrete with common technology and materials. Cem. Concr. Compos. 34 (4), 538–544. doi:10.1016/j.cemconcomp.2011.11.005
Xue, W., Li, Y., and Cai, L. (2018). In-plane and out-of-plain mechanical behavior of double faced superpdsed concrete shear walls. Eng. Mech. 35 (05), 47–53+142. doi:10.6052/j.issn.1000-4750.2017.07.ST11
Yang, Y., Xu, R., and Zhang, Z. (2020). Experimental study on the mechanical properties of axillary angle of aassembly superimposed pipe gallery and the overall failure pattern. North. Archit. 5 (02), 2096–2118.
Zheng, W., Lu, X., and Wang, Y. (2016). Flexural behaviour of concrete composite slabs with precast ribbed reactive powder concrete bottom panels. J. Comput. Theor. Nanosci. 13 (3), 1831–1839. doi:10.1166/jctn.2016.5120
Zheng, W., Lu, X., and Wang, Y. (2015). Flexural behaviour of precast, prestressed ribbed RPC bottom panels(Article). Open Civ. Eng. J. 9 (1), 98–106. doi:10.2174/1874149501509010535
Keywords: utility tunnels in composite shell system, high-performance cement-based material, bending test, theoretical calculation, fabricated composite shell system
Citation: Dong L, Yao A, Zhou D and Zhang P (2023) Characterizing the bending behavior of underground utility tunnel roofs in a fabricated composite shell system. Front. Mater. 10:1201752. doi: 10.3389/fmats.2023.1201752
Received: 07 April 2023; Accepted: 16 June 2023;
Published: 11 July 2023.
Edited by:
Xianze Cui, China Three Gorges University, ChinaReviewed by:
Han Zhiming, Shijiazhuang Tiedao University, ChinaCopyright © 2023 Dong, Yao, Zhou and Zhang. This is an open-access article distributed under the terms of the Creative Commons Attribution License (CC BY). The use, distribution or reproduction in other forums is permitted, provided the original author(s) and the copyright owner(s) are credited and that the original publication in this journal is cited, in accordance with accepted academic practice. No use, distribution or reproduction is permitted which does not comply with these terms.
*Correspondence: Lei Dong, ZG9uZ2xlaTA0MDFAaG90bWFpbC5jb20=
Disclaimer: All claims expressed in this article are solely those of the authors and do not necessarily represent those of their affiliated organizations, or those of the publisher, the editors and the reviewers. Any product that may be evaluated in this article or claim that may be made by its manufacturer is not guaranteed or endorsed by the publisher.
Research integrity at Frontiers
Learn more about the work of our research integrity team to safeguard the quality of each article we publish.