 Lichao Feng1Yongran Zhang1Xiaowei Wang2Stephene Mery3Michelle Akin3Mengchao Li1
 Ning Xie3
 Zhenming Li4*Xianming Shi3,5*
- 1Jiangsu Marine Resources Development Research Institute, School of Mechanical Engineering, Jiangsu Ocean University, Lianyungang, Jiangsu, China
- 2New Materials Engineering and Technology Joint Institute of University of Jinan and Qingdao Weili Cooperation, Qingdao, China
- 3Civil Engineering Department, College of Engineering, Western Transportation Institute, Montana State University, Bozeman, MT, United States
- 4Department of Materials Science and Engineering, The University of Sheffield, Sheffield, United Kingdom
- 5Laboratory of Advanced and Sustainable Cementitious Materials, Department of Civil and Environmental Engineering, Washington State University, Pullman, WA, United States
Two pervious concrete projects (named as SR28 and SR431), with the same mixture design but different winter maintenance activities, were included in this research. Both projects are located in the Lake Tahoe area, Nevada, United States. Testing results indicated that the mechanical properties were significantly higher in SR28 cored samples than the ones in SR431. It was found that the SR28 pieces have fewer air voids, while the SR431 samples have higher water absorption and hydraulic conductivity, and the SR28 samples show fare better performance against repeated freezing and thawing cycles than the SR431 ones. scanning electron microscope pictures of crack surfaces in cores taken from SR28 indicate that the cement binder phase has been largely retained. However, in the coring sample of SR431, needle-shaped residues can be seen within the cement binder phase and an abundance of precipitated micro-sized crystalized particles can be observed. On a micrometer scale, the μCT examination reveals that the porosity of SR28 samples is significantly less than that of SR431. The analyzing results give a clue to demonstrate the durability of pervious concrete pavement can be attributed to the construction quality control, maintenance activity, or the weather and locations of the field sites.
1 Introduction
Pervious concrete pavement is a powerful method for mitigating the negative effects of stormwater runoff on watersheds. Additionally, it benefits urban heat island reduction and groundwater purification (Xie,.2019a). The open network of pores in pervious concrete pavement reduces the volume of excess stormwater and improves the quality of water by reducing suspended particles, overall phosphorus, whole nitrogen, and metals (McCain, 2010). The use of mechanical and biological systems accomplishes this. Effective air voids may vary from 14%–31%, permeability can range from 90 to 2,000 cm/h, and compressive strength can range from 6–21 MPa (Schaefer et al., 2006).
Durability is the most significant factor influencing pervious concrete pavement life cycle performance. Winter road maintenance may significantly impact a pervious concrete installation’s durability and performance. The durability of pervious concrete may also be affected by seasonal freeze-thaw cycles brought on by deicers. When utilizing pervious concrete, a few additional concerns need to be addressed. To provide suitable in-place material qualities, proper mixing and installation are required. Large void spaces severely impact the mechanical characteristics of pervious concrete. Infiltration capacity, mechanical features, and durability of pervious concrete pavements must thus be kept in a proper balance.
Saturated freeze-thaw performance (as can be measured by ASTM C666) can be enhanced through various changes to the design of the mixture, as found by Schaefer et al. (2006). These include the use of a reduced cementitious material content, the inclusion of polypropylene fibers, the use of a higher water/cement ratio, an increase in concrete strength, and the inclusion of entrained air (Kevern, 2008). The addition of polypropylene fibers, silica fume, or a larger cementitious material, according to Yang (2011), significantly increased saturated freeze-thaw endurance, especially for water-cured samples. According to the ASTM C666, while structural characteristics were not considerably different, fluent pervious concrete samples measured for freeze-thaw resistance showed much superior endurance than either clogged or saturated models (Guthrie, 2010). It was found that the recycled carbon fiber composite scraps from the aerospace industry with large aspect ratios can be used as a replacement for natural coarse aggregate in low-porosity pervious concrete. Mechanical and durability assessment results show that the mechanical properties increased with increasing recycled fibers due to the bridging mechanism. After rapid freeze-thaw cycling and deicer chemical attacking assessment, the fiber-reinforced pervious concrete maintained over 95% of the original mass and about 80% of the dynamic modulus after experiencing over 200 cycles (Nassiri, 2021). Steel fiber is also appropriate to reinforce the pervious concrete. It was pointed out that pervious concrete with 2% steel fiber has a compressive strength of 52.8 MPa at the age of 28 days (Lee, 2022). Basalt fiber and glass fiber are also good options to reinforce the pervious concrete. By adding a small amount of basalt fiber, the mechanical properties of the pervious concrete can be significantly enhanced (Wu, 2022), and the flexural strength of pervious concrete can increase by about 5% with even 0.3% of glass fiber (Singh, 2022).
The durability of the pervious concrete road is also greatly impacted by the use of deicers during winter maintenance operations, in addition to freeze-thaw degradation. The U.S. Environmental Protection Agency (EPA) demonstrates that the pervious concrete pavements cannot be treated with traction sand. Also, lower deicer application rates are advised. Even though several studies have proved that the use of deicers may increase anti-icing effectiveness, snow, and ice management operations continue to provide distinct issues for pervious concrete pavement. Calcium magnesium acetate, potassium acetate, or magnesium chloride deicers should not be used on pervious concrete pavement, according to the recent edition of the NRMCA Pervious Concrete Pavement Maintenance and Operations Guide. The freeze-thaw deterioration, mass loss, properties deterioration, and dynamic elastic modulus attenuation of pervious concrete under freeze-thaw cycles were investigated. The results indicated that the pervious concrete deteriorates water and salt freeze-thaw cycling and the defects between the paste and aggregate interface increased with the increase in freeze-thaw cycles (Xiang, 2022). Although the consensus has been reached that the deicers harm the pervious concrete, a well-accepted test method to assess the durability of pervious concrete with exposure to freeze-thaw cycling along with deicing salts is still lacking (Cutler, 2010). By comparing several commonly used deicers, the order of the caustic deicers is NaCl, CaCl2, MgCl2, potassium acetate, sodium acetate, and calcium-magnesium acetate (Tsang, 2016). Apart from the types of deicing salts, the impact of salt concentration on the durability of pervious concrete has been investigated. It was found that the mass-loss rate, relative dynamic modulus of elasticity, mechanical properties, and hydraulic conductivity after 300 freeze-thaw cycles varies significantly with various salt concentrations. The most severe freeze-thaw damage of the samples was those immersed in a 3% NaCl solution, while no observable damage in a 20% of NaCl solution (Feng, 2020). Unlike the statement of this study, it was claimed by several studies that the impact of MgCl2 on the durability of concrete has been considerably underestimated. It was claimed that the Mg2+ will react with the C-S-H binder phase in cement hydration products to form an amorphous M-S-H phase, CaCl2, brucite, oxychlorides, and Mg3(OH)5Cl∙4(H2O) phases (Xie, 2019b).
Further elucidating the influence of various deicers on pervious concrete pavements, under a freeze-thaw or dry-wet environment, Culter et al. (2010) made two pervious concrete mixtures (modified and unmodified latex). Tests were done with three deicers. Meanwhile, both the saturated and drained techniques of applying deicer were used. The greatest harm was observed to be done by calcium chloride solution, which contradicts the NRMCA Pervious Concrete Pavement Maintenance and Operations Guide. In contrast, calcium magnesium acetate was the least harmful. Comparing the results to a revised, more accurate drained test procedure, the saturated scaling measure technique (ASTM C672, 2012) caused a substantially more extensive loss of concrete mass. Results from the soaked and drained experiments showed that, regardless of the kind of deicer, wet curing samples using latex materials showed considerably greater loss of mass than concrete that did not contain the latex polymer.
Different blends of pervious concrete pavement have varying levels of durability. Construction of a pervious concrete pavement is essential for obtaining desired performance. The laboratory tests replicated several years of experience in operation and gave information on properties and durability without requiring field installation findings. It made use of current studies to fill in a knowledge gap for using pervious concrete roads in cooler environments, which present special difficulties.
Laboratory permeability testing on pervious concrete samples is commonly done. Falling head permeability tests are the most used laboratory testing (Schaefer et al., 2006; Huang, 2010; McCain, 2010; Rizvi et al., 2010). In this test, the sides of the concrete samples were sealed, and the time required for water supplied to the sample’s surface to decrease in height was measured. To calculate the hydraulic conductivity, the time, and the initial and final pressure heads were utilized.
To comply with federal (EPA) regulations, the Nevada Department of Transportation (NDOT) requires helpful measures to minimize the number of fine silt created by NDOT. The most efficient approach for eliminating fine particles is infiltration. Pervious concrete pavement replaces impermeable areas to minimize runoff and spread infiltration. In the summer of 2012, NDOT constructed two pervious concrete pavement projects near Lake Tahoe, named as SR28 and SR431. During the winter months, de-icing compounds such as salt was applied to the asphalt highway surfaces near both of these two project locations. Maintenance activities such as street sweeping and vacuuming were performed by NDOT maintenance crews within the project area. Snow plows and snow removal equipment with tire chains have subjected the slabs to greater load weights as well as cracking. In light of the same mixture design specifications and similar maintenance activities, the durability of the pervious concrete pavements in these two sites is expected to be the same. However, the forensic observation demonstrated that the SR28 site has better durability compared with the SR431 site. Therefore, it is necessary to investigate the reasons that lead to the evident different performances of these two sites.
It was believed that there are several potential reasons which can lead to the durability difference between these two sites: 1) the construction quality control; 2) the maintenance activity; and 3) the weather and locations of the field sites. First, for the construction quality control, some parameters should be analyzed in detail such as the mix design, the shapes and quality of the aggregates, the vibration process, the local water/binder ratio, and the quantity of additives. Second, for the effect of the maintenance activities, the types and quantity of the deicing chemicals usage, and the cleaning approaches should be systematically investigated. Finally, the effects of the external conditions such as weather and locations of the field sites, the precipitations, the real local freeze/thaw cycling times, and the traffic loadings must be considered carefully. Although many researchers have reported the effects of the above-mentioned factors on the durability of concrete pavements, little study has statistically reported the influence of these factors on the durability of pervious concrete pavement. Collecting all the information mentioned above will be a big step forward to finding out the influence factors on the durability performance and help to realize a durable pervious concrete pavement. This study sets out to determine how well pervious concrete controls the quantity and quality of drainage systems in areas often subjected to snow plowing and de-icing salt materials, which will benefit the analysis of the effectiveness and resilience of pervious concrete.
2 Experimental
2.1 Materials and mixtures
The samples were named the SR28 and the SR431, and two slabs of pervious concrete were installed in Incline Village, Nevada (Lake Tahoe). These two locations, SR431 and SR28, were coring locations for conducting tests. The combined scale of the pervious concrete investigated is demonstrated in Table 1. The ratio of water to cement is 0.3. Nevada II was used in the study as the cement, and the specific gravity of the aggregate was 2.64.
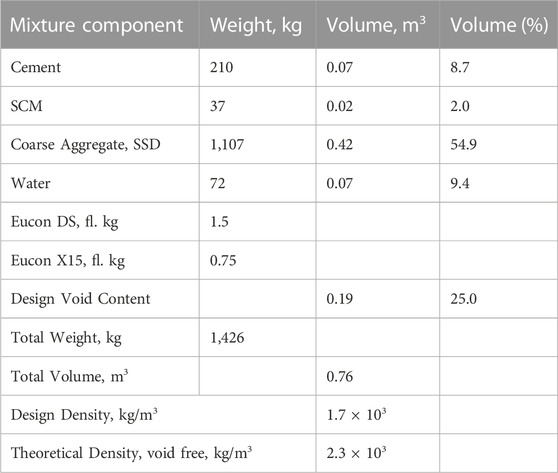
TABLE 1. Mixture proportions, for 0.76 m3 (1 cubic yard).
Under ASTM C143, C1688, C39, 2021, and C496, 2017, the density, slump, air void content, and strength of samples were determined. Table 2 displays the slump of concrete as 0.64 cm. The compressive strength and tensile strength at 7 days were 19.1 and 2.1 MPa, and the compressive strength and tensile strength at 28 days were 23.0 and 2.2 MPa, respectively.
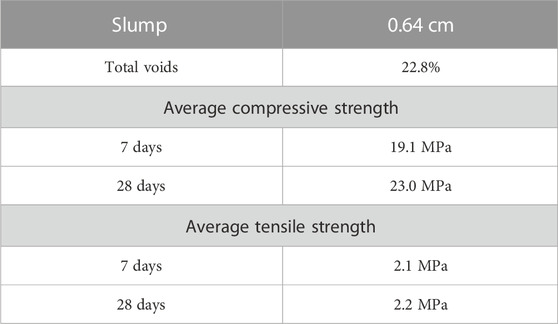
TABLE 2. The characteristics of mixed pervious concrete.
Pervious concrete road has been tested in the field, and the soil drainage and road design (such as a steep slope) were examined and noted. The infiltration was computed using the following formula:
where t represents the time it needs for water to enter concrete (sec), I represents the soaking speed (cm/hr), M represents the infiltrated water weight (kg), D represents the interior diameter of the infiltration ring (cm), and K is a constant 144.6 cm-kg.
2.2 Experiments
The coring locations were positioned at varying distances from the pavement edge throughout the test sites. In addition, cores were obtained from places with different degrees of suffering (limited, moderate, or severe). Two slabs and the restricted number of distress cores from each location were utilized in two measurements of assessing the engineering qualities of the built and tested specimens. Given that the majority of this deterioration is caused by moisture entering the concrete, a concrete’s absorption capacity may be used to determine how resistant it is to destruction from different environmental conditions. Tests for abrasion, freeze-thaw, and salt-scaling resistance were used to determine the pervious concrete samples’ durability. Drainage testing was used to determine the infiltration rate during performance tests. The damaged cores were used to analyze the concrete’s microstructure. A micro-computed X-ray tomography (μCT) and scanning electron microscope (SEM) device were utilized to analyze the microstructure of samples in this work. Detailed experimental procedures are described below.
2.2.1 Compressive strength
Due to the lack of an official standard for pervious concrete, the performance of the concrete’s compressive strength was evaluated based on ASTM C39, 2021, with the following modifications: A height of eight inches was hacked from cores with a ratio of diameter to height of 0.5, and then permitted with 24 h drying.
The suggested ASTM C617, 2016 standard was followed while covering the cores with cement to provide a smooth surface for the sample. The cement paste had a water-to-powder ratio of 0.3. The combination contained 1% by mass of water reducer after a relatively tiny addition of the reducer. The mixture was applied using the sample’s flat end, covering the sample’s whole surface with around 4 mm of the sample. To maintain the cement capping’s integrity inside the core’s boundaries, excess cement paste had to be removed. The cap surface was checked to make sure it was parallel to the axis of the cylindrical sample using a set of levels. Before proceeding with the other end of the sample, 6 h were given for the cement to cure.
Six height measurements were taken of each sample after the cement tops had cured. After that, the cores were broken apart by being vertically crushed at a rate of 200 kg per second (Figure 1). For each specimen, the enormous force required to produce failure was measured and documented.
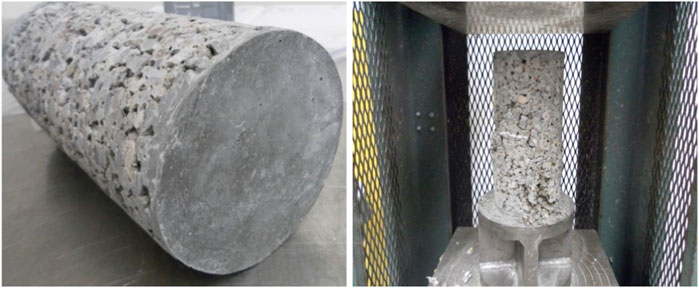
FIGURE 1. Compressive strength testing pictures of samples.
2.2.2 Splitting tensile strength
In terms of ASTM C496, 2017 testing standard, the performance of the splitting tensile strength was evaluated. The sample was divided into cores with a diameter-height ratio of 0.5 and an eight-inch height. The cores were left to cure for 24 h.
By the ASTM 617, 2016 standard, the compression test was performed after the tensile strength had been measured using a cement strip that had been installed down the whole length of each sample’s opposing edges to provide level, parallel, and stable surfaces. However, two opposing strips of cement matrix were put throughout the whole length of the specimens. The paste’s liquid-to-cement content was 0.3. It was necessary to add only enough water reducer to the mixture to make it contain 1% by mass of reducer. A strip of sample about 4 mm thick was placed on the edge of the core cement sample such that it ran the whole length of the sample. After 6 h of setting time, the cement was applied to the other side. Throughout the procedure, a series of standards were utilized to guarantee the sample remained horizontal to the same diameter and parallel to each other.
After being cured, the six heights of each cement sample were measured. Following the failure at 60 kg/s, the cores were crushed along their diameter. For each sample, the highest force applied to achieve loss was recorded. Figure 2 depicts the sample pictures for the strength testing results.
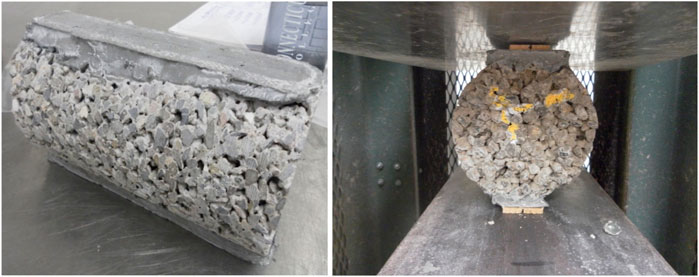
FIGURE 2. Splitting tensile strength test process.
2.2.3 Density, voids, and absorption
Following ASTM C1754, 2012, the Density, and void percentage were measured. To provide a more consistent height throughout a particular group of cement samples, the cores were prepped by having their rough edges sawed off.
The density of the cement samples was assessed by using calipers through testing the diameter and length. Each sample’s dry mass was determined using the following drying procedure. Before putting the sample into a 100°C oven for 24 h to dry, its mass was defined. Repeat the procedure until the reported mass change for each sample is less than 0.5% before the drying. Measure the mass of the samples once again after dried 1 day. After two dryings, this condition is satisfied.
Calculate the testing density with the after equation, using the synthetic mass of each concrete sample along with the mean length and diameter values:
where:
A = the dry mass.
D = the average diameter.
L = the average length.
K = 1,273,240.
The next step was to weigh each sample suspended in a water bath, which allowed us to determine its submerged mass. To hang the sample, secure a rope through a wooden pin to the middle of the sample and put it around the tub’s rim. Each sample spent 30 min in the water bath before being slapped with a hammer to remove the remaining bubbles. Then, the mass immersed in the water and its temperature was documented. The following calculation was used to compute the void content as a percent
where:
B = submerged mass.
ρw = water density.
ASTM C642, 2022 was utilized to determine the water absorption rate. Each sample’s dry mass was recorded and immersed in water for 24 h. After being taken out of the water, the sample’s exposed surfaces were dried off and allowed to drain. Before being put in the water for another 24 h, the sample’s mass was measured again. This process was performed several times until the sample mass change was less than 0.5% of the preceding time. The following equation was used to determine the water absorption:
where:
A = the initial dry mass.
B = the final mass.
2.2.4 Abrasion resistance
The ASTM C1747, 2022 was used to determine the abrasion resistance. Every cement sample was air-dried for 36 h after being cut to 4 inches. When the samples were dried, their masses were tested.
A collection of three samples from the same site SR28 were tested using a 30-rpm, 500-rpm Los Angeles abrasion testing machine. A 1-inch sieve was used to sort the complete result, and the kept material was recorded. The identical procedure was subsequently applied to three samples from position SR431.
2.2.5 Water permeability
Recently, without any accepted standards for determining water permeability in pervious concrete. To determine the speed of water seeping pervious concrete, past researchers have successfully modified a dropping head permeameter. The approach utilized is identical to previous studies (Schaefer et al., 2006; Huang, 2010; McCain, 2010; Rizvi et al., 2010).
Each sample from each sampling point was subjected to a falling head test. Test specimens were trimmed to the height is four inches. Only the bottom and top sides of the samples could pass water through them since the total size of the cylinder was sealed with silicone.
To make a standpipe, a PVC pipe with a nominal diameter of 4 inches was utilized. Schaefer et al. (2006) inspired the design of the standpipe. Each standpipe required the cutting of three pipe pieces: a length of 51 cm (20 inches) for the top standpipe tube and two portions measuring 10.2 cm in length. The bottom drainage reservoir was made out of one of the 10.2 cm components. The other 10.2 cm section included the specimen.
Water came out of a hole with a radius of 1.55 cm in the bottom of the PVC. The pipe’s bottom was sealed with silicone sealant. Drill a hole with a radius of 5.1 in the center of another plastic plate. The second plate was hit with four holes in the four outer quadrants. After that, to align the second plate with the pipe’s 10.2 cm opening, it was secured to the head of the lower piece of PVC.
Close to the bottom, a small hole was bored into the top PVC piece. This hole was used to attach a small, clear plastic pipe that measured the standpipe’s water level and was affixed to the outside in a straight, vertical position. The transparent line was then drawn at one-inch intervals by measurement from the PVC’s bottom to a height of 38.1 cm. The bottom of the top PVC piece was covered with a plastic plate.
To offer enough flexibility for the insertion of pervious concrete samples, a second 10.2 cm (4 in) piece of pipe was cut along a single length from top to bottom. Once the sample had been inserted, silicone was used to seal the pipe’s vertical aperture and the boundaries between the sample and pipe at the top and bottom. Figure 3 illustrates the preparation work of measuring water permeability. After that, the sample was placed using spherical plastic spacers between both the top and bottom halves of the standpipe contraption. The four plastic plate holes were each fastened with a nut and bolt. The spaces between the sample’s top and bottom and the matching equipment part were filled with silicone; Figure 4 illustrates the test equipment for water permeability. The device’s bottom drain was plugged with a rubber washer, and the standpipe was filled to just above the 38.1 cm (15 in) level. The rubber stopper was lifted as the water level dropped by an inch at a time, and a timer with repeated lap functionality was used to clock the lap. This procedure was repeated thrice for each sample.
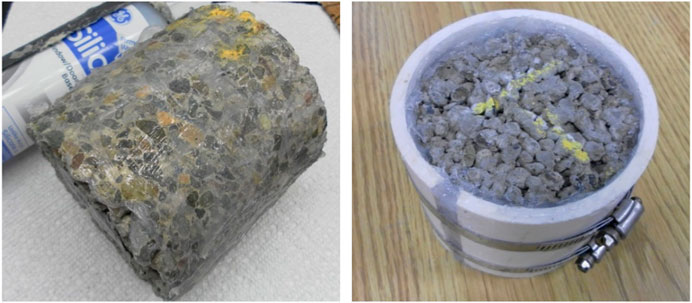
FIGURE 3. Pictures of water permeability testing preparation.

FIGURE 4. The test equipment for water permeability.
2.2.6 Salt scaling
For testing salt scaling resistance, a drained test technique was utilized. The experiment utilized a solution containing 3% sodium chloride by mass. Two slabs, each measuring 22 × 22 × 10.2 cm3, were taken from each site. During the experiment, testing concrete samples were stored in transparent plastic containers of the appropriate size. The container was placed over another plastic bottle that functioned as a storage bottle for the salt solution to drain into during the experiment. To avoid the sample resting in the solution pool that remained after draining, spacers were placed between the concrete and the container. To empty the salt liquid, two small holes were made at the bottom. The sample was immersed in the solution for around 20 min until the holes were large enough for it to no longer be submerged. The process for testing for salt scaling is shown in Figure 5. Before each freezing and thawing cycle, the sample was placed on top of the spacers in the container. The container was filled with sodium chloride until the sample was completely submerged. Every few minutes, the draining process must be examined for clogged or blocked holes.
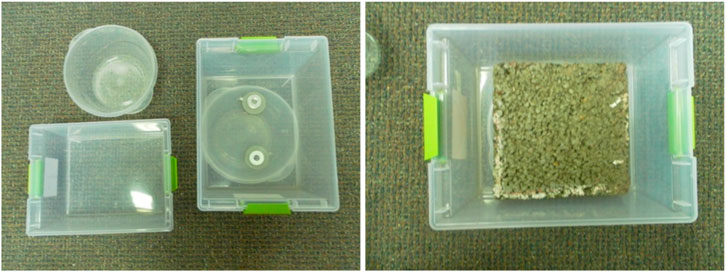
FIGURE 5. Pictures of testing the salt scaling procedure.
Following 24 h in the freezer, the concrete samples were taken out and allowed to thaw for an additional 24-h period. Afterward, wiped off any litter from the surface of the sample and tested the mass. Repeat seven times to collect all scaled material, measured the mass after drying, and shortened the predetermined ten cycles.
2.2.7 Microstructure analysis
Materials cored from sites SR431 and SR28 had low and high-magnification fracture surfaces that were categorized as limited, moderate, and severe, respectively. These fracture surfaces were discovered using SEM and μCT. Typically, 20 kV of accelerating voltage was used for SEM. 10 μm is the resolution of the μCT analysis.
2.2.8 Notes on maintenance activities
The concrete parts had not received any maintenance procedures like vacuuming, sweeping, or brooming during the NCE’s beginning infiltration test results. There was no grip sand on the roadways because the winter season was not yet started.
Both sites’ asphalt roadway surfaces received traction sand application over the winter. The amount and timing of traction sand treatment were governed by the length and strength of the winter storm. The application rates and timing of traction sand cannot be estimated. Both sites applied salt and deicing agents to the asphalt roadway surfaces. NDOT maintenance staff conducted tasks such as street sweeping and vacuuming within the project’s scope. The slabs were exposed to higher weights and breaking from snowblowers and tire-chained snow removal machines.
3 Results and discussions
The conclusions of two infiltration field tests are shown in Table 3. The average infiltration rate of newly mixed concrete samples is 0.76–1.02 cm/s; the final infiltration rate, however, dropped to 0.25–0.025 cm/s after a year of operation.
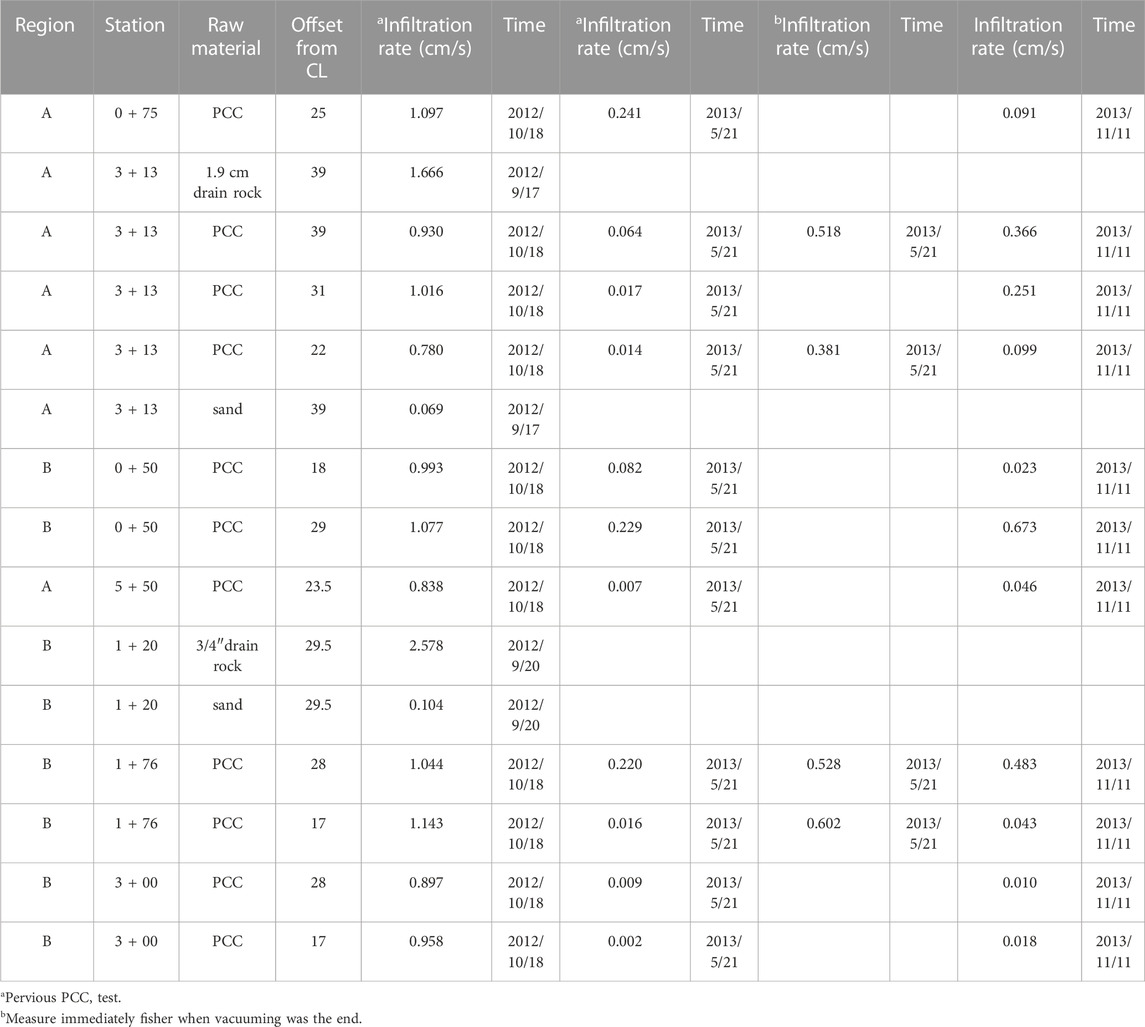
TABLE 3. Results of the infiltration test.
3.1 Compressive strength
Figure 6 gives the mechanical properties. The compressive strength of the SR28 was higher than the SR431 at 6.26 ± 0.66 MPa compared to 5.25 ± 0.43 MPa (90,895 psi and 76,262 psi, respectively).

FIGURE 6. Compressive strength of the SR28 and SR431 samples.
3.2 Splitting tensile strength
Figure 7 displays the results for splitting tensile strength. The strength of the concrete samples from SR28 compared to SR431 was higher, measuring 1.9 ± 0.13 MPa and1.26 ± 0.32 MPa, similar to the results of the compressive strength testing.
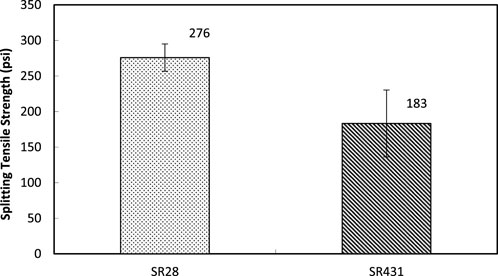
FIGURE 7. Results of splitting tensile strength.
3.3 Abrasion resistance
Figure 8 shows that, following the strength test findings, the SR28 samples lost less mass than the SR431 samples (only 48 versus 59%) throughout the impact and abrasion test performed. This equates to a higher than 20% increase in abrasion resistance between sites SR28 and SR431. All financial, commercial, or other relationships that might be perceived by the academic community as representing a potential conflict of interest must be disclosed. If no such relationship exists, authors will be asked to confirm the following statement.
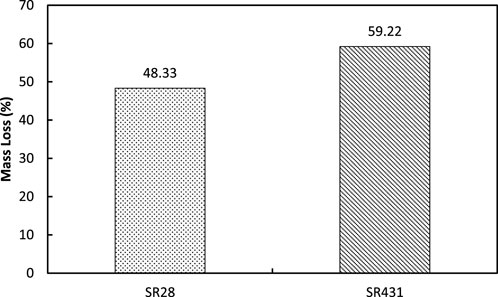
FIGURE 8. Results of abrasion resistance results. Note: Select the three samples for every location. Under the testing protocol, a total mass loss was calculated by analyzing all three samples from a particular location at the same time.
3.4 Density and air voids
Figure 9 depicts the results of density. The density between the two places is not very noticeable, as demonstrated in this picture. The mean density results of samples from site SR28 is 1,666 ± 74 kg/m3. However, the average density of samples from site SR431 is 1,634 ± 202 kg/m3.
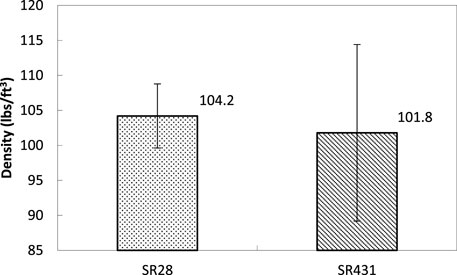
FIGURE 9. Density results of the SR28 and SR431 samples.
As demonstrated in Figure 10, SR28 and SR431 core samples had comparable air void values. The average percentage of air voids in samples from site SR28 was 34.5% ± 3.1%, whereas the average percentage in samples from site SR431 was 36.2% ± 7.1%.
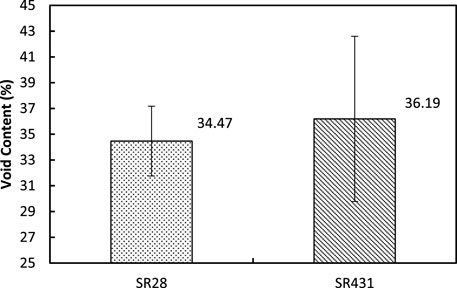
FIGURE 10. Void content results of samples.
The samples’ great departures from the typical air voids and density indicate that there were issues with the compaction and placement of the pervious concrete construction at site SR431. The porosity of both sites exceeds what is necessary by the mixture. This is in line with both areas having smaller compressive strengths than anticipated. The greater porosity and smaller density of SR431 than SR28 explain the lower compressive strength performance.
3.5 Water permeability
The SR28 samples displayed greater densities and lower air voids, although the fact that there was no notable variation in the results of density and air voids between these two sites. The hydraulic conductivity of SR431 is thus larger than SR28, with respective values of 0.44 ± 0.06 in/sec and 0.53 ± 0.03 in/sec in Figure 11. This adheres to the proportionate connection between permeability and porosity.
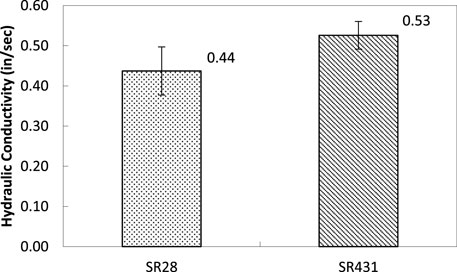
FIGURE 11. Results of hydraulic conductivity.
3.6 Water absorption
As demonstrated in Figure 12, the difference between the SR28 and SR431 was greater than in density and air spaces. The average percentage of air voids in concrete samples from site SR28 was 34.5% ± 3.1%, whereas the average percentage in samples from site SR431 was 36.2% ± 7.1%.
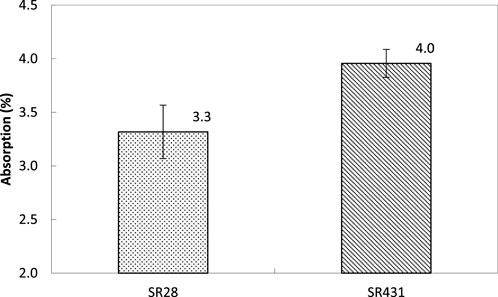
FIGURE 12. SR28 and SR431 samples’ water absorption.
The air void and the density are controlled mainly by the macro pores (with sizes ranging from centimeters to millimeters), and the water absorption value is primarily controlled by the micropores (with sizes ranging from micrometers to nanometers). It may be deduced from analyzing the findings of the absorption tests to those of the strength tests, which showed different rates of 20% and 50% among the SR28 and SR431, furthermore, the microstructure is the main factor affecting the mechanical properties, which will cause the reduction of mechanical properties, although the macrostructure is not changed. This is also supported by the fact that variation rates for air and density are less than 5%, but exceed 20% for water permeability and absorption.
3.7 Salt scaling
The exterior dimensions of concrete samples subjected to seven freeze/thaw cycles using a 3% NaCl solution are shown in Figure 13. The SR431 samples display more noticeable salt scaling compared to the SR28 which have exterior dimensions that are generally well-retained. Figure 14 shows the mass loss from SR28 and SR431 has a math relationship with freeze/thaw cycles in a solution of 3% salt solution. The picture shows that the SR28 site’s mass loss is more stable than the SR431. The mass losses changing the SR28 were from 81.07% to 27.24% after seven freeze/thaw cycles in 3% NaCl solution, whereas the mass losses of the SR431 sample were 90.35% and 89.77%, respectively.
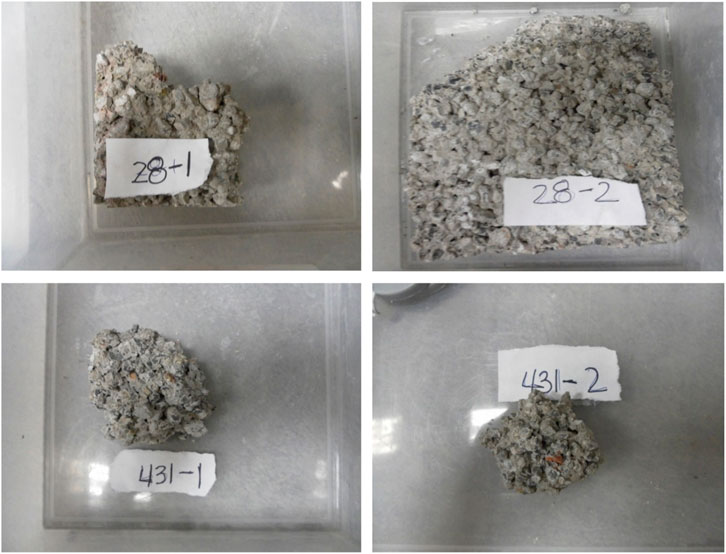
FIGURE 13. Following seven freeze/thaw cycles, the size of the SR28 and SR431.

FIGURE 14. Loss in mass of samples from SR28 and SR431.
3.8 Microstructure investigation
The performance of concrete is greatly influenced, as was already shown, by the microstructures of the samples. The microstructure must next be investigated to understand the causes behind performance degradation. In this section, the porosity and 3D images of the SR28 and SR431 core samples were examined using SEM and μCT. The SEM was utilized to highlight the structure of two aggregates in interfaces, while the μCT was used to exhibit porous with a resolution of 10 μm and a 3D photograph.
3.8.1 SEM
The samples suffered from three levels of dicing salt, limited, moderate, and severe (termed as SR431-lim, SR431-mod, and SR431-sev, SR28-lim, SR28-mod, and SR28-sev, respectively) were observed by using SEM. Figure 15 shows the SEM characteristics of the core from the SR431 site. Parts Figures 15A–C of this figure stand for limited, moderate, and severe conditions, respectively. Although there are a few porous areas, Figure 15A) of the small sample exhibits a rather strong amorphous cementitious phase. The amount of amorphous phase has greatly decreased in Figure 15B), where needle-shaped precipitates may be seen. Additionally, as can be shown in Figure 15C), the amorphous phase evolved into pores, and many tiny crystals have been observed in the pores.
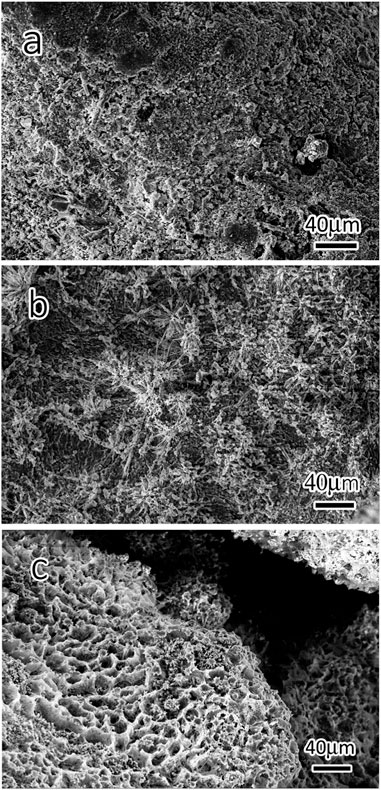
FIGURE 15. Fracture surface SEM pictures in low magnification of SR431 (A) limited, (B) moderate, and (C) severe.
The SEM of SR431 is shown in Figure 16 to show more structural properties. The limited, moderate, and severe environments were shown in Figures 16A–C, correspondingly. A fraction of the cementitious phase contained several crystal structures, while other similar amorphous phases were also found but lacked random orientations. Despite the majority of the material in Figure 16B being the homogeneous amorphous binder phase, a great number of needle-shaped deposits be detected. The majority of the phase has been replaced as the dominant phase in Figure 16C by the needle-shaped precipitates, which have grown into massive crystals.
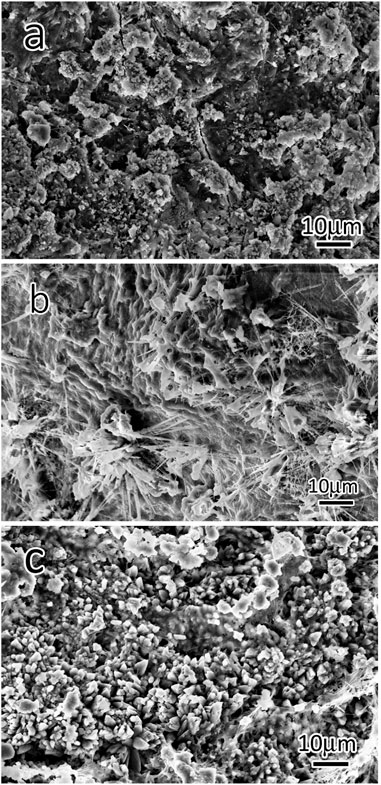
FIGURE 16. Fracture surface SEM pictures in high magnification of SR431 a) limited, (B) moderate, and (C) severe.
In Figure 17, the high-magnification SEM pictures of SR431 under different conditions. Figure 17A gives the needle-shaped precipitates with diameters around 100 nm and smooth or rough surfaces. In the needle-shaped agglomerates, a minor quantity of the binder phases, which primarily contribute to the samples’ strength, may still be visible. However, as illustrated in Figure 17B, the binder phase is rarely visible, and many crystals were found in place of sediments in the shape of needles. The diameter is 1 μm and the length is 10 μm of the crystals that were measured. This explains why these samples have the worst strength.
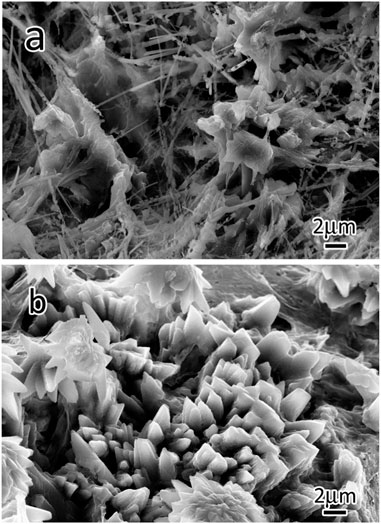
FIGURE 17. Fracture surface SEM pictures in high magnification of SR431, (A) moderate, and (B) severe.
The microstructure of the SR28 sample also was studied the same as the SR431. Figure 18 shows the SEM pictures of the fracture surfaces of samples of SR28. The fracture surface of the limited selection one, illustrated in Figure 18A, has a normal amorphous phase. It can be seen that the microscopic morphology of the sample is very dense, and the pores are invisible. No residues are seen on the fracture surface, which is relatively flat. In moderate samples, the surface is less flat than in limited samples. Despite the main binder phase still predominating, some uniformly distributed precipitates have been found. The severe samples exhibit extremely rough surfaces with many crystal residues, similar to the samples from site SR431 (Figure 18C).
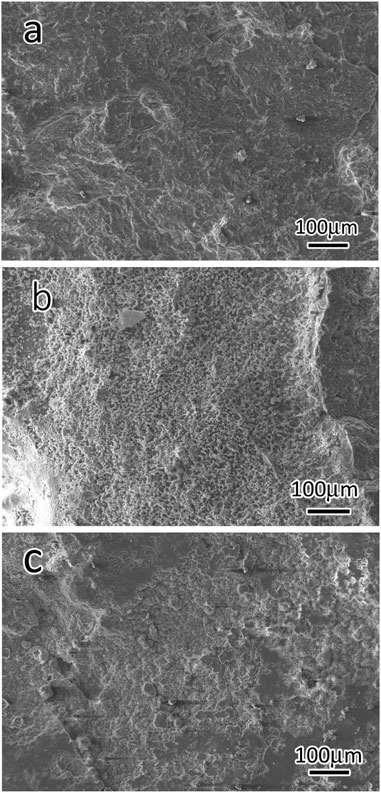
FIGURE 18. Fracture surface SEM pictures in low magnification of the SR28 site, (A) limited, (B) moderate, and (C) severe.
Figure 19 depicts the SEM fracture morphology of a cored sample of SR28. The amorphous binder phase is in great condition and there are not many precipitates in Figure 19A. Figure 19B shows that the homogenous amorphous phase has decreased in quantity and has been replaced by some crystal-sized nanoparticles. Distinct from the SR431, the precipitated equidistant crystals are the dominant phase in SR28, and the majority of the amorphous phase is present. Approximately 1 μm is the average size of the isotropic crystals. The samples from SR431-lim share a microstructure with SR28-mod samples that features nano-sized precipitates incorporated in the structure.
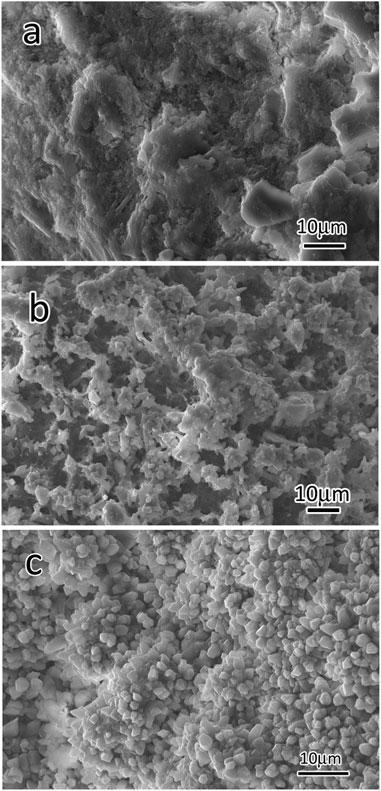
FIGURE 19. Fracture surface SEM pictures in high magnification of the SR28, (A) limited, (B) moderate, and (C) severe.
The morphology of SR28-mod samples under different conditions showed in Figure 20 using magnified high-magnification SEM. The amorphous binder phase contains a few isotropic crystals. Furthermore, in Figure 20B, a little amount of amorphous phase and a lot of isotropic crystals were discovered to be the dominating phases. The crystals were around 1 μm in size on average.
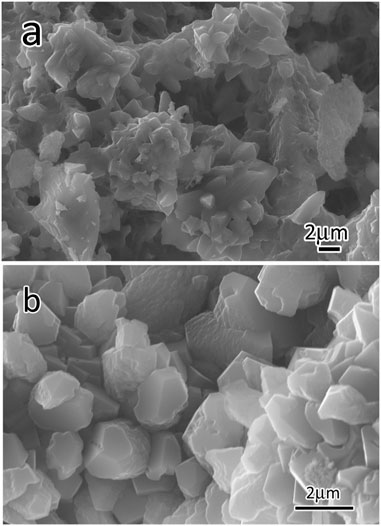
FIGURE 20. Fracture surface SEM pictures in high magnification of the SR28, (A) moderate, and (B) severe.
It is commonly known that the primary binder material responsible for the concrete’s strength is the C-S-H phase structure. The C-S-H composition in these samples of pervious concrete determines the variations in overall performances. The figures above show that as the environment changed, the microstructure transformed from a high-density C-S-H phase to high porosity, which greatly decreased the cement strength and increased porosity, permeability, and water absorption. And the compressive strength and wear resistance were also reduced.
3.8.2 3D X-ray tomography (μCT)
The μCT data prove that the microstructure of materials cored from SR28 and SR431 locations has changed. Since the μCT has a resolution of 10 m as opposed to the tests for water permeability and the number of air voids, it may detect multiscale pores in the porosities, which is the most crucial component in establishing the final characteristics.
The samples from SR28 and SR431 exhibit the usual 2D microstructures in Figures 21, 22. As demonstrated by these pictures, pore content was higher in SR431 than in SR28.
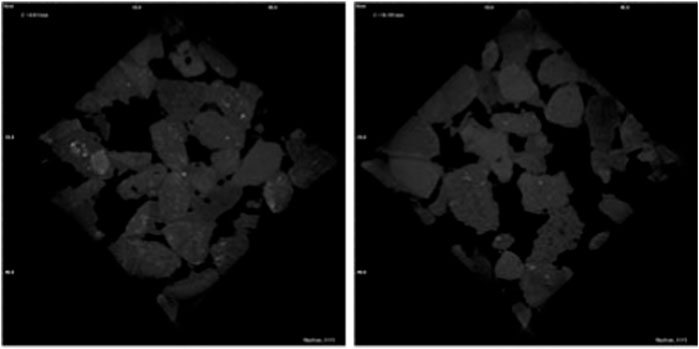
FIGURE 21. The μCT pictures of the SR28 sample.

FIGURE 22. The μCT pictures of the SR431 sample.
Table 4 shows the assessed porosity results of the μCT test. As shown in the table, with values of 31.4% and 47.2%, Samples from sites SR28 and SR431 have different levels of porosity. Comparing the μCT test results to the air voids content data indicates similar findings, that the SR431 samples are more porous than the SR28 samples.

TABLE 4. Porosity results of SR431and SR28.
Major changes in microstructure might result from several different reasons. First, the cement binder phase morphologies were significantly chemically altered by maintenance operations like deicer impact. The degree of the chemical reaction between the deicers and cement is directly proportional to the exposure of the deicing agent. Second, the wintertime freeze/thaw damage will cause serious physical damage to the cement binder phase. SEM scans and μCT findings can also identify this. Thirdly, the binder phase structure will be impacted by the execution process. The ratio of water to cement has a significant impact on the final qualities of the concrete. Due to the relative porosity of pervious concrete, it is not straightforward to maintain a constant water/cement ratio in all locations. Consequently, the water-to-cement ratio in samples from various places may vary significantly. The surface quality of the aggregates is yet another crucial element that affects how pervious concrete pavements ultimately perform.
Although the mechanical properties reduction trend of the concrete materials with exposure to various deicers shows different results, in general, the negative impact of deicers on the mechanical properties of concrete still can be reflected from a statistical perspective (Shi, 2009; Sajid, 2022). It was claimed that the chemical reaction between the deicer along with the freeze/thaw damage, which resulted from the microstructure change of the concrete, are the major reasons for the reduction of the mechanical properties of the concrete samples cored from these sites. Microstructure analysis results have confirmed the chemical reaction between deicers and the Ca-rich cementitious phases in concrete (Farnam, 2015; Qiao, 2021). It was found that the intact layered structure C-S-H phases can be observed in the samples without exposure to deicers, and the surfaces of the pores are smoother than those with exposure to deicers (Xie, 2015). The silica in C-S-H is organized in single chains whereas that in M-S-H is in the form of silica sheets (Farnam, 2015). In addition to a different molar ratio of Si/Ca, M-S-H contains more chemically bound water than C-S-H (Lothenbach, 2015). The introduction of MgCl2 is prone to reduce the pH value of the pore solution, thus facilitating the formation of M-S-H due to the reaction between Mg(OH)2 and the silica (Helmy, 1991).
Our latest study has elucidated the fatal impact of MgCl2 on concrete materials (Xie, 2019a). As demonstrated in Eq. 1, the reaction between the MgCl2 and the cementitious calcium silicate hydrate (C-S-H) leads to a non-cementitious magnesium silicate hydrate (M-S-H). In addition, as shown in Eq. 2, MgCl2 can also react with Ca(OH)2 to form a crystalline Mg(OH)2. The formation of CaCl2 in confined concrete pores results in the enhancement of the crystallization pressure and expansive forces, which leads to the internal cracks of concrete.
Laboratory studies reported the formation of detrimental calcium oxychloride (3CaO•CaCl2•15H2O) phase as a result of exposure to MgCl2 (Sutter, 2006). The proposed mechanism is based on Eqs 2, 3:
Apart from the plate-like calcium oxychloride crystals and their carbonate phase in voids and cracks, Friedel’s salt (3CaO·Al2O3·CaCl2·10H2O) is another important precipitate with exposure to chloride salts. It was also claimed that the chemical reactions between MgCl2 and C-S-H are more complicated than the known reactions (1) to (3). One additional chemical reaction that might have occurred is:
Previous studies have demonstrated that for those exposed to NaCl solution, needle-shaped precipitates, which are nanometers in diameter, can be observed in the C-S-H phase (Xie, 2019b). This morphology is well agreed with the SR 431 samples in this study. However, the concrete samples exposed to MgCl2 solutions featured a highly porous microstructure with nano-sized crystalline Mg-riched precipitates, well agreed with the SR 28 samples in this study. Although the microstructure analysis has shed light on the potential reasons for the field samples, it is necessary to further explore the deep deterioration mechanism of the environmental impact on the durability of pervious concrete pavement with a synergistic attack from freeze/thaw, de-icers, loading, clogging, and complicated maintenance activities.
4 Conclusion
• Following engineering property testing, it was determined that samples cored from SR28 exhibit higher compressive and splitting tensile strength than the SR431. Those cored from SR28 have an abrasion resistance that is around 20% greater than the SR431.
• The SR28 samples have a slightly greater density, a reduced air void content (approximately 5%) than the SR431, and a lower hydraulic conductivity than the SR431.
• The water absorption of SR28 samples was approximately 50% less than those extracted from SR431. In addition, SR28 has higher freeze/thaw resilience.
• According to the results of SEM pictures of the SR28 and SR431 samples, the limited group exhibits good performance in the binder, however, samples under moderate conditions exhibit some precipitates with a needle-like shape embedded in phase. The major phase of the severe concrete samples showed many precipitated micro-sized crystals. The μCT results display that the SR28 samples had much less porosity than SR431 at the micrometer scale.
Data availability statement
The raw data supporting the conclusion of this article will be made available by the authors, without undue reservation.
Author contributions
LF, NX, ZL, and XS contributed to the conception and design of this study. LF, YZ, XW, SM, MA, and ML contributed to the investigation and analysis of the data. LF and NX wrote the first draft of the manuscript. ZL and XS contributed to manuscript revision and proofing. All authors contributed to the article and approved the submitted version.
Funding
The authors acknowledge the financial support for this project provided by the Nevada Department of Transportation (ODOT), Jiangsu Industry-University-Research Corporation Program (BY2022254), Lianyungang Key Technique Competition Program (CGJBGS2103), Marie Skłodowska-Curie Individual Fellowships under EU’s H2020 programme (Grant No. 846 and 028), and Horizon Europe Guarantee Fund (Grant No. EP/X022587/1).
Acknowledgments
We also appreciate the help from the penal members and the Nichols Consulting Engineers (NCE).
Conflict of interest
The authors declare that the research was conducted in the absence of any commercial or financial relationships that could be construed as a potential conflict of interest.
Publisher’s note
All claims expressed in this article are solely those of the authors and do not necessarily represent those of their affiliated organizations, or those of the publisher, the editors and the reviewers. Any product that may be evaluated in this article, or claim that may be made by its manufacturer, is not guaranteed or endorsed by the publisher.
References
ASTM C672/C672M-03 (2012). Standard test method for scaling resistance of concrete surfaces exposed to deicing chemicals. West Conshohocken, United States: American Society for Testing Materials.
Astm standard C1747/C1747M, (2022). ASTM standard C1747/C1747M. West Conshohocken, United States: American Society for Testing Materials.
Astm standard C1754/C1754M, (2012). Standard test method for density and void content of hardened pervious concrete. West Conshohocken, United States: American Society for Testing Materials.
Astm standard C39/C39M, (2021). ASTM standard C39/C39M. West Conshohocken, United States: American Society for Testing Materials.
Astm standard C496/C496M, (2017). ASTM standard C496/C496M. West Conshohocken, United States: American Society for Testing Materials.
Astm standard C617/C617M, (2016). ASTM standard C617/C617M. West Conshohocken, United States: American Society for Testing Materials.
Astm standard C642, (2022). ASTM standard C642. West Conshohocken, United States: American Society for Testing Materials.
Cutler, H. E., Wang, K., Schaefer, V. R., and Kevern, J. T. (2010). Resistance of Portland cement pervious concrete to deicing chemicals. Transp. Res. Rec. 2164 (1), 98–104. doi:10.3141/2164-13
Farnam, Y., Dick, S., Wiese, A., Davis, J., Dale, B., and Weiss, J. (2015). The influence of calcium chloride deicing salt on phase changes and damage development in cementitious materials. Cem. Concr. Compos. 64, 1–15. doi:10.1016/j.cemconcomp.2015.09.006
Feng, J., Zong, N., Zhu, P., Liu, H., Yao, L., and Jiang, G. (2020). The frost-resisting durability of high strength self-compacting pervious concrete in deicing salt environment. J. Wuhan Univ. Technology-Mater. Sci. Ed. 35 (1), 167–175. doi:10.1007/s11595-020-2240-6
Guthrie, W. S., DeMille, C. B., and Eggett, D. L. (2010). Effects of soil clogging and water saturation on freeze–thaw durability of pervious concrete. Transp. Res. Rec. 2164 (1), 89–97. doi:10.3141/2164-12
Helmy, I. M., Amer, A. A., El-Didamony, H., and Amin, A. M. (1991). Chemical attack on hardened pastes of blended cements. I, Attack of chloride solutions. ZKG Int. 44 (1), 46–50. doi:10.1016/j.jmrt.2021.01.101
Huang, B., Wu, H., Shu, X., and Burdette, E. G. (2010). Laboratory evaluation of permeability and strength of polymer-modified pervious concrete. Constr. Build. Mater. 24 (5), 818–823. doi:10.1016/j.conbuildmat.2009.10.025
Kevern, J. T., Wang, K., and Schaefer, V. R. (2008). Pervious concrete in severe exposures. Concr. Int. 30 (7), 43–49.
Lee, M.-G., Wang, W.-C., Wang, Y.-C., Hsieh, Y.-C., and Lin, Y.-C. (2022). Mechanical properties of high-strength pervious concrete with steel fiber or glass fiber. Buildings 12 (5), 620. doi:10.3390/buildings12050620
Lothenbach, B., Nied, D., L'Hôpital, E., Achiedo, G., and Dauzères, A. (2015). Magnesium and calcium silicate hydrates. Cem. Concr. Res. 77, 60–68. doi:10.1016/j.cemconres.2015.06.007
McCain, G. N., Suozzo, M. J., and Dewoolkar, M. M. (2010). “A laboratory study on the effects of winter surface applications on the hydraulic conductivity of porous concrete pavements,” in Transportation Research Board 2010 Annual Meeting CD-ROM, Washington, United States, January 10-14, 2010.
Nassiri, S., AlShareedah, O., Rodin, H., and Englund, K. (2021). Mechanical and durability characteristics of pervious concrete reinforced with mechanically recycled carbon fiber composite materials. Mater. Struct. 54 (3), 107. doi:10.1617/s11527-021-01708-8
Qiao, C., Chen, X., Suraneni, P., Jason Weiss, W., and Rothstein, D. (2021). Petrographic analysis of in-service cementitious mortar subject to freeze-thaw cycles and deicers. Cem. Concr. Compos. 122 (2021), 104112. doi:10.1016/j.cemconcomp.2021.104112
Rizvi, R., Susan, T., Henderson, V., and Jodi, N. (2010). Evaluating the use of recycled concrete aggregate in pervious concrete pavement. Transport. Res. Rec.: J. Transport. Res. Board. 2164, 132–140.
Sajid, H. U., Jalal, A., Kiran, R., and Al-Rahim, A. (2022). A survey on the effects of deicing materials on properties of Cement-based materials. Constr. Build. Mater. 319 (2022), 126062. doi:10.1016/j.conbuildmat.2021.126062
Schaefer, V. R., Wang, K., Suleiman, M. T., White, D., and Kevern, J., (2006). Mix design development for pervious concrete in cold weather climates lowa. Lowa, United States: Dept.of Transportation.Highway Division.
Shi, X., Akin, M., Pan, T., Fay, L., Liu, Y., and Yang, Z. (2009). Deicer impacts on pavement materials: Introduction and recent developments. Open Civ. Eng. J. 3 (1), 16–27. doi:10.2174/1874149500903010016
Singh, A., Charak, A., Biligiri, K. P., and Venkataraman, P.(2022). Glass and carbon fiber reinforced polymer composite wastes in pervious concrete: Material characterization and lifecycle assessment. Resour. Conservation Recycl. 182, 106304. doi:10.1016/j.resconrec.2022.106304
Sutter, L., Peterson, K., Touton, S., Van Dam, T., and Johnston, D. (2006). Petrographic evidence of calcium oxychloride formation in mortars exposed to magnesium chloride solution. Cem. Concr. Res. 36 (8), 1533–1541. doi:10.1016/j.cemconres.2006.05.022
Tsang, C., Shehata, M. H., and Lotfy, A. (2016). Optimizing a test method to evaluate resistance of pervious concrete to cycles of freezing and thawing in the presence of different deicing salts. Materials 9, 878. doi:10.3390/ma9110878
Wu, J., Qian, P., Lv, Y., Zhang, J., and Gao, S. (2022). Research on the mechanical and physical properties of basalt fiber-reinforced pervious concrete. Materials 15 (19), 6527. doi:10.3390/ma15196527
Xiang, J., Liu, H., Lu, H., and Gui, F. (2022). Degradation mechanism and numerical simulation of pervious concrete under salt freezing-thawing cycle. Materials 15 (9), 3054. doi:10.3390/ma15093054
Xie, N., Akin, M., and Shi, X. (2019a). Permeable concrete pavements: A review of environmental benefits and durability. J. Clean. Prod. 210, 1605–1621. doi:10.1016/j.jclepro.2018.11.134
Xie, N., Dang, Y., and Shi, X. (2019b). New insights into how MgCl2 deteriorates Portland cement concrete. Cem. Concr. Res. 120, 244–255. doi:10.1016/j.cemconres.2019.03.026
Xie, N., Muthumani, A., Dang, Y., and Shi, X. (2015). “Deicer impacts on concrete bridge decks: A comparative study of field cores from potassium acetate and sodium chloride environments,” in Innovative materials and design for sustainable transportation infrastructure (Reston, Virginia: ASCE), 42–57.
Keywords: deicer, freeze/thaw, concrete, degradation, pavement
Citation: Feng L, Zhang Y, Wang X, Mery S, Akin M, Li M, Xie N, Li Z and Shi X (2023) Impact of deicing salts on pervious concrete pavement. Front. Mater. 10:1189114. doi: 10.3389/fmats.2023.1189114
Received: 18 March 2023; Accepted: 18 May 2023;
Published: 01 June 2023.
Edited by:
Junjie Wang, Tsinghua University, ChinaReviewed by:
Francesco Todaro, Politecnico di Bari, ItalyGuojian Liu, Suzhou University of Science and Technology, China
Copyright © 2023 Feng, Zhang, Wang, Mery, Akin, Li, Xie, Li and Shi. This is an open-access article distributed under the terms of the Creative Commons Attribution License (CC BY). The use, distribution or reproduction in other forums is permitted, provided the original author(s) and the copyright owner(s) are credited and that the original publication in this journal is cited, in accordance with accepted academic practice. No use, distribution or reproduction is permitted which does not comply with these terms.
*Correspondence: Zhenming Li, emhlbm1pbmcubGlAc2hlZmZpZWxkLmFjLnVr; Xianming Shi, eGlhbm1pbmcuc2hpQHdzdS5lZHU=